The main tag of Forex News Today Articles.
You can use the search box below to find what you need.
[wd_asp id=1]

19 11, 2024

GBP/USD Forecast Today 18/11: Looking for Support (Video)

By |2024-11-19T00:13:41+02:00November 19, 2024|Forex News, News|0 Comments

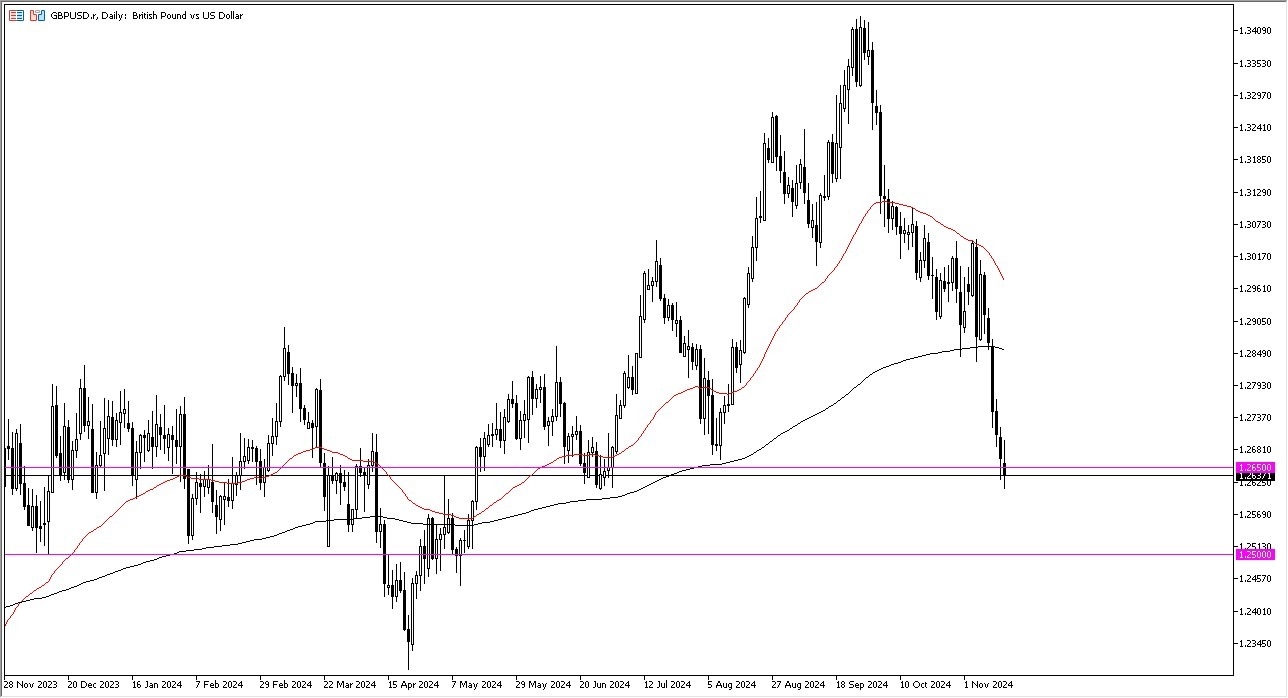
  • The British pound initially did try to rally during the trading session on Friday but gave back gains as it looks like we continue to struggle overall.
  • The 1.2650 level is an area that’s been important multiple times in the past, so I think it does make a certain amount of sense that it could offer support.
  • But having said that, we have plunged over the last week or so, especially after the election in the United States as the US dollar is king again.
  • Between the 1.2650 level and the 1.25 level, I think you’ve got an area that could be rather supportive, and a bounce from here would make a certain amount of sense mainly due to the fact that we’ve just sold off so much.

Interest Rates and More

Interest rates in America are to blame as to why the US dollar continues to strengthen as well as investment in US indices, because quite frankly, US indices continue to be the better performing ones in the world from a longer term perspective, dwarfing most others. So with that being said, I think you still have an argument for the US dollar, but whether or not we just fall from here, or if we get another bounce is the real question.

On a move to the upside, I’d be looking to fade any rally, especially if we get anywhere near the 200 day EMA, which is closer to the 1.2850 level. The Bank of England has been somewhat hesitant to cut rates, but they did recently. So it’ll be interesting to see what the trajectory there is. Federal Reserve comments coming out suggesting that perhaps the Americans might have to pause on any rate cuts. So, the game begins. We’ll have to wait and see how this plays out, but it certainly looks very negative at this point.

Ready to trade our GBP/USD daily analysis and predictions? Here are the best forex trading platforms UK to choose from. 

Source link

18 11, 2024

EUR/USD Forecast: Mild Recovery Within Bearish Trend

By |2024-11-18T22:13:13+02:00November 18, 2024|Forex News, News|0 Comments

  • EUR/USD forecast remains neutral with no clear bias.
  • Easing Fed’s dovishness keeps the US dollar strong.
  • Market awaits impetus to break out of current range. 

The EUR/USD forecast remains neutral for the day as the economic calendar is light and trading activity is thin. The pair attempted to gain some ground from Friday’s lows but failed to sustain the gains at 1.0570. The broader dollar strength overshadows the recovery in risk assets.

Are you interested in learning more about Canadian forex brokers? Check our detailed guide-

Geopolitics has again taken center stage with renewed heat from the Russia-Ukraine crisis.  Hence, the risk-off sentiment favors the US dollar and keeps pressure on the Euro. Moreover, the fear of a trade war between the European Union and the US has also deteriorated Euro’s outlook.

After Trump’s victory, market analysts have revised their forecast for the US dollar in 2025, expecting a sharp growth in the currency. Fed’s dovish bets have also eased as the rate cut path could be slowed down. Fed Chair Jerome Powell said he cannot predict Trump’s policy guidance on the future rate cuts. He also said that the economic indicators have not sent signals to ramp up rates. The inflation is slowly moving towards a sustainable 2% target that could help us attain a neutral rate.

Key Events to Watch

There is no significant event on the calendar today. However, the market participants may be looking for some fresh clues in today’s speech of ECB Chir Lagarde regarding monetary policy.

EUR/USD Technical Forecast: Rangebound behavior

EUR/USD Forecast: Mild Recovery Within Bearish Trend
EUR/USD 4-hour chart

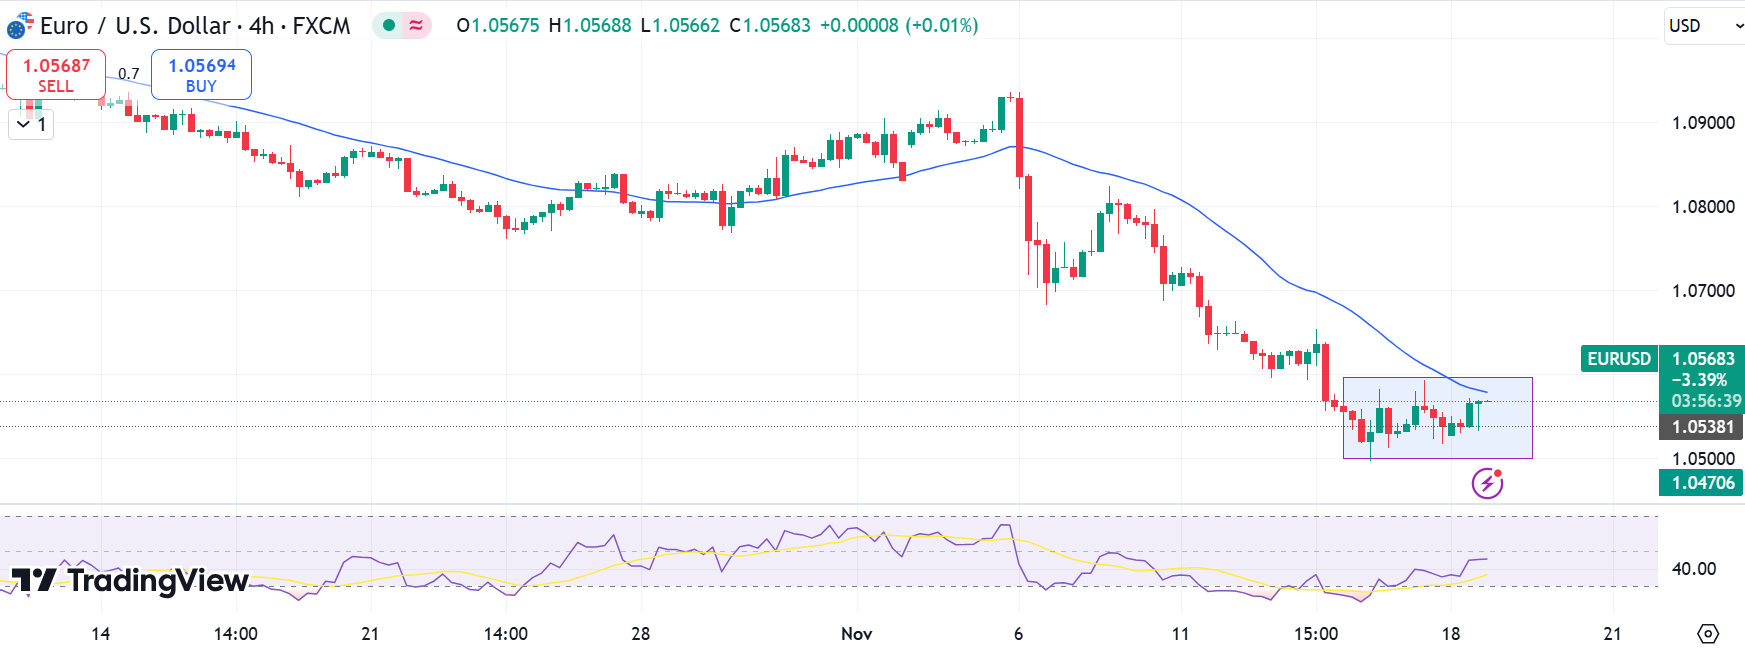
The EUR/USD forecast remains elusive as buyers attempt to stay above the 1.0500 mark but fail to sustain the gains beyond 1.0570. The 4-hour chart shows the price remains in a tight range starting from Nov 13th. The pair is perhaps looking for a fresh impetus to break out of the range on either side.

Are you interested in learning more about high leveraged brokers? Check our detailed guide-

The 30-SMA lies above the price, showing a sustained bearish momentum, while the RSI has moved up to 40.0 level which indicates the pair is out of oversold condition and the downside momentum may continue.

Technically, the pair needs acceptance above 1.0600 to initiate a bullish momentum, while breaking the 1.0500 mark may bring strong selling towards the 1.0450 area.

Looking to trade forex now? Invest at eToro!

68% of retail investor accounts lose money when trading CFDs with this provider. You should consider whether you can afford to take the high risk of losing your money

Source link

18 11, 2024

Plunges to 6-Month Low (Chart)

By |2024-11-18T20:11:36+02:00November 18, 2024|Forex News, News|0 Comments

  • The British Pound’s resilience against the strong US Dollar has not lasted long.
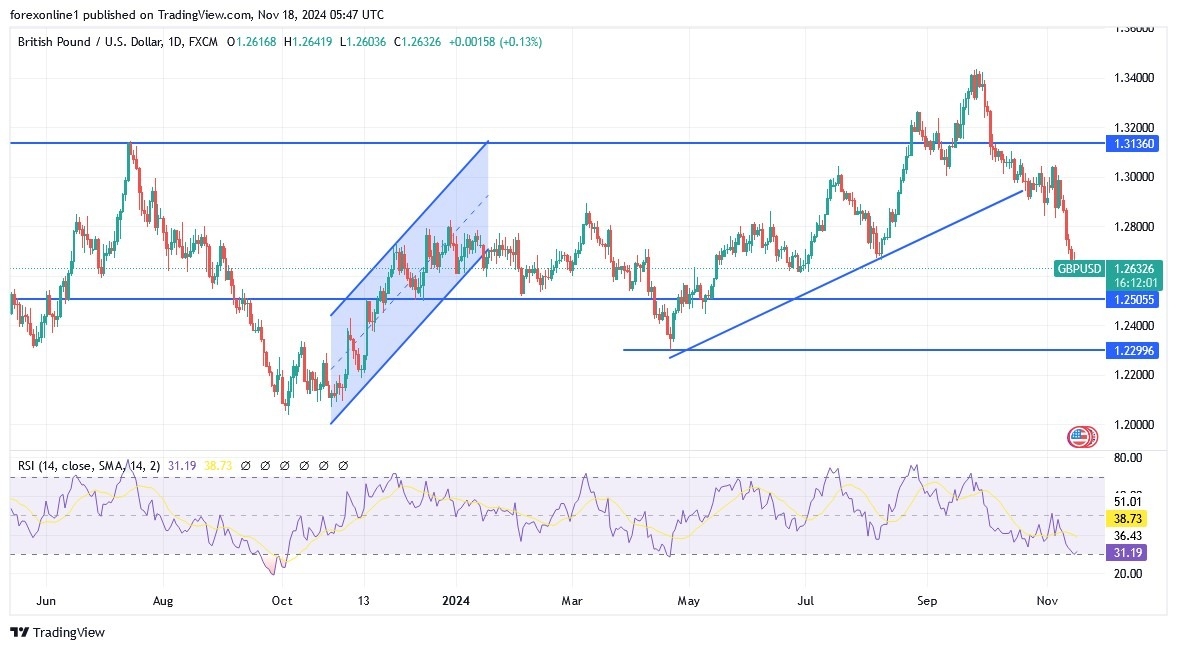
  • Over the past six trading sessions, the GBP/USD has been subjected to selling, starting from the resistance level of 1.3008.
  • Reaching the support level of 1.2596, the lowest level for the currency pair in six months, and closing the week’s trading stable around the level of 1.2617.
  • Technically, we mentioned that the movement of the pound sterling/dollar price below the psychological level of 1.3000 would give the bears momentum and thus prepare for stronger downward breaches, which is what actually happened.

The British Economy: Least Affected by Trump

With Trump’s victory, talk has increased about renewed trade wars and tariffs between global economies led by the United States. However, economic experts have stated that Trump’s policies may have a limited impact due to strong British service exports and the level of the goods trade deficit with the United States. Services are usually exempt from trade wars. Conversely, experts believe that the strength of the US economy under Trump will boost Britain if it increases the value of service exports.

Future of the Cautious Bank of England Policy

Moreover, Expectations have increased that the Bank of England’s policies will remain cautious after the recent announcement that inflation rates in the country rose above the bank’s target. According to the results of the economic calendar data, the British consumer price index may rise this week by an annual rate of 2.2%, according to the average forecast of 24 Bloomberg surveys. This is up from 1.7% last month, when it fell below the Bank of England’s 2% target for the first time in more than three years. At its last meeting, the Bank of England delivered a second interest rate cut by a quarter of a percentage point and sent no indication that rapid easing might be necessary. This came as the stance is more conservative than that of the neighbouring euro zone, and is in line with the calm tone adopted by US Federal Reserve Chairman Jerome Powell recently.

Technical forecasts and signals for the GBP/USD pair today:

Technically, the downward trend of the GBP/USD is gaining strength. The continued strength of the US dollar may give the bears the opportunity to move to stronger support levels, the closest of which is currently 1.2520, then 1.2440, and then 1.2300, which is important for moving technical indicators towards oversold levels. You can consider buying GBP/USD from both the second and last levels without taking risks and activating take-profit and stop-loss orders to ensure the preservation of the trading account. According to recent trades, the pound sterling is recording its worst extended losing streak in 10 years, falling by 2% last week alone, marking the seventh consecutive week of losses.

You can get more GBP/USD signals and free live trading recommendations exclusively on our website.

As for the performance of technical indicators, the Relative Strength Index (RSI) is on the verge of the 30 level, which confirms its proximity to oversold levels. Therefore, currency traders will be watching for new buying opportunities. As for the MACD indicator, it is also heading towards oversold levels. Ultimately, the Stochastic indicator is settling well below the 20 level and is waiting for a rebound upwards.

Ready to trade our daily GBP/USD Forex forecast? Here’s some of the best forex broker UK reviews to check out

Source link

18 11, 2024

USD/JPY Analysis Today 18/11: Awaits US Policies (Chart)

By |2024-11-18T18:10:39+02:00November 18, 2024|Forex News, News|0 Comments

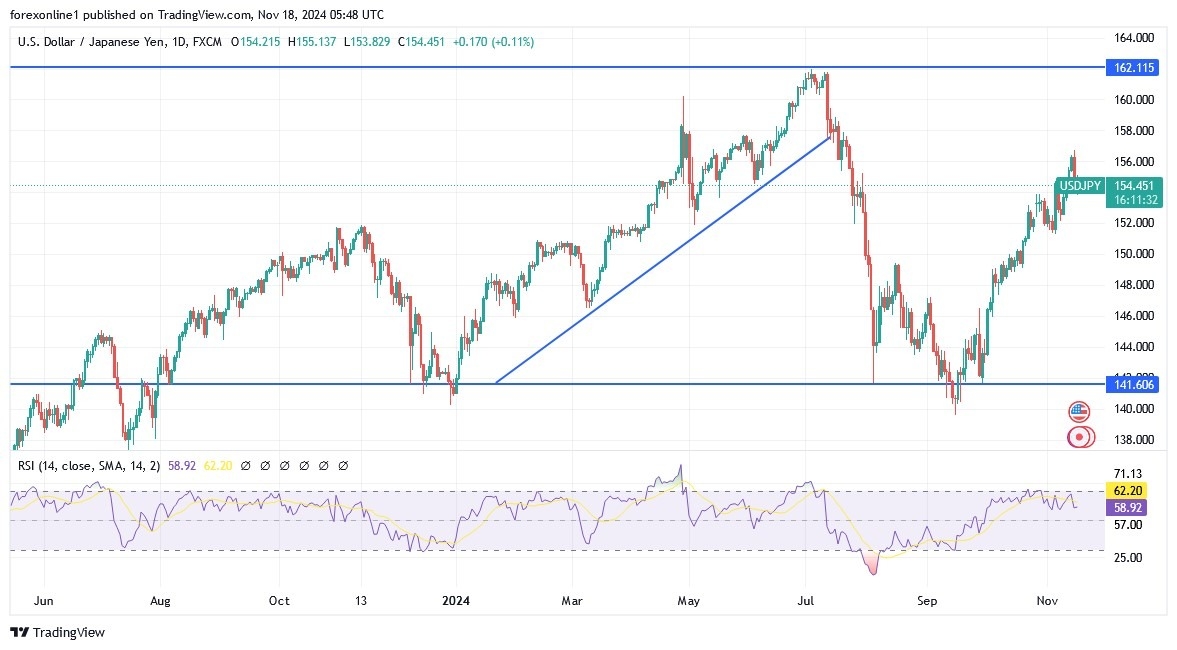
  • At the end of last week’s trading, the USD/JPY was subjected to selling, starting from the resistance level of 156.75, the highest for the currency pair in three months, with losses extending to the level of 153.86.
  • Obviously, this came amid profit-taking before trading closed stable around the level of 154.30.
  • Concurrently, the overall trend of the USD/JPY pair remains bullish and may remain so for some time.

US Dollar Stable Around Two-Year High

According to reliable trading platforms, the price of the US dollar index DXY, which measures the performance of the US currency against a basket of other major currencies, is stable around its highest in two years, and according to recent trading, the index has recorded seven consecutive weeks of gains. The US dollar’s gains came primarily in light of the strong US economic performance and hints from US Federal Reserve officials led by Jerome Powell that the bank will not accelerate the pace of reducing US interest rates as long as the economy is strong, especially compared to other global economies that are suffering. Recently, market expectations for a 25-basis point cut in US interest rates in December fell to 62%, down from 86% previously.

Strong US Economic Data

According to economic data, we have observed positive results for US economic sectors that confirm the view of the US Federal Reserve. Most notably, US retail sales exceeded expectations, indicating continued resilience in the consumer sector. Prior to that, the main and core US producer prices were announced as expected, but annual growth rates exceeded expectations, in contrast to the US consumer price index data, which met expectations.

In terms of the performance of US stock indices, over the past week, the S&P 500 lost 2.2%, the Dow Jones fell 2.3%, and the Nasdaq declined 2.9%, reflecting a reversal of the upward trend that followed the US presidential election and was driven by optimism surrounding President Trump’s policies.

USD/JPY Technical Analysis and Expectations Today:

Recently, the gap between expectations regarding the future of US and Japanese central bank policies has widened, which will be in favour of further strengthening the upward trend of the USD/JPY currency pair. Therefore expect to buy the currency pair back from every downward level, and currently, the closest support levels for the USD/JPY are 153.70, 152.20, and 150.00, respectively. Conversely, and according to the performance on the daily chart above, the psychological resistance of 160.00 will remain an important target for the upward trend and for the markets. Consequently, it will then increase talk of imminent Japanese intervention in the forex markets to prevent further decline in the yen. However, this time, there is Trump, who has often talked about countries that devalue their currencies.

Want to trade our daily USD/JPY forex analysis and predictions? Here’s a list of forex brokers in Japan to check out. 

Source link

18 11, 2024

EUR/USD Analysis Today 18/11: Headed for Parity (Chart)

By |2024-11-18T16:09:05+02:00November 18, 2024|Forex News, News|0 Comments

  • The US Federal Reserve’s affirmation of not rushing to cut interest rates, coupled with Trump’s election victory, has extended the US dollar’s gains.
  • This has increased selling pressure on the EUR/USD currency pair, driving it down to 1.0496, its lowest level in a year.
  • Last Friday, the euro attempted to rebound but gains were capped at 1.0592, and amidst stronger bearish control, the pair closed the week lower around the support level of 1.0538.


Trump Could Drive Euro/Dollar to Parity

According to Forex trading, the sharp losses that followed the announcement of Trump’s victory, which was followed by strong gains for the US dollar, its highest in two years, increased talk about the possibility of the euro/US dollar moving to the parity price of 1:1 in light of Trump’s trade policies. Especially, if the trade wars between the Eurozone and the United States expand. With the euro dollar breaking the 1.0440 level, these expectations may increase. Specifically, since they coincide with devastating economic and political issues that threaten the future of the single European currency area.

Concerns about Germany Will End Euro Gains

Given the increasingly gloomy outlook for the recovery of the German economy, coupled with the continued easing of European Central Bank policy, you should consider that any gains for the euro in the forex market may be subject to a rapid collapse. According to reliable trading platforms, the EUR/USD is around 1.0538, the EUR/JPY is around 162.64, the EUR/AUD is around 1.6300, and the EUR/GBP is around 0.8350, according to the latest trading price updates.

Will Germany See New Leadership?

The economic recession could hit the current German leadership. Markets are watching the agenda of the Christian Democratic Union leader who is vying to succeed Olaf Scholz. Dear reader, beware that the return of Donald Trump means that the next German government may have to deal with a global trade war, complicated relations with Beijing, and possibly difficult choices regarding the conflict in Ukraine – with extremist parties ready to capitalize on any misstep. Amid this tension, the Council of Economic Experts, which advises the German government, has scrapped its economic growth forecast for 2024 to predict a second year of contraction, followed by a small economic growth rate of 0.4% in 2025.

European Central Bank Policies

The US Federal Reserve’s recent affirmation that it will not rush to cut interest rates if the US economy is strong is widening the gap between it and the European Central Bank’s policies, which are following a rate-cutting path and will not change its direction in the face of current European political and economic concerns. Obviously, this would be a significant downward pressure factor for the EUR/USD in the coming months. Recently, the European Central Bank has cut interest rates three times since last June due to declining inflation and a slowdown in the eurozone economy. Currently, It is widely expected that interest rates will be cut again in December 2024, when policymakers receive updated forecasts that will help them assess the outlook for the eurozone.

EUR/USD Technical Analysis and Forecast:

Technically, the downward trend of the EUR/USD currency pair is getting stronger by breaking the support at 1.0500 consolidates the bears’ control. According to the direction of the technical indicators, the next most important support levels will be 1.0440 and 1.0390, which in turn will move the technical indicators towards strong oversold levels and increase expectations for the EUR/USD price to move towards the parity price. Conversely, and on the same time frame, the daily chart for a break of the downward trend on the bulls will push the EUR/USD price towards the resistance levels of 1.0750 and 1.0840, respectively.

We advise you to sell the EUR/USD pair from each upward level.

Ready to trade our daily EUR/USD Forex analysis? We’ve made a list of the best forex demo accounts worth trading with

Source link

18 11, 2024

EUR/JPY Signal Today – 18/11: EUR Tests 200 EMA (Chart)

By |2024-11-18T14:08:05+02:00November 18, 2024|Forex News, News|0 Comments

Potential signal:

I would be a buyer of this pair if we can recapture the ¥164 level. If we get above there, I would put a stop loss at the ¥163 level and aim for the ¥167 level.

  • Dear my daily analysis of the yen related pairs, it’s worth noting that the euro initially did try to rally, but then it plunged.
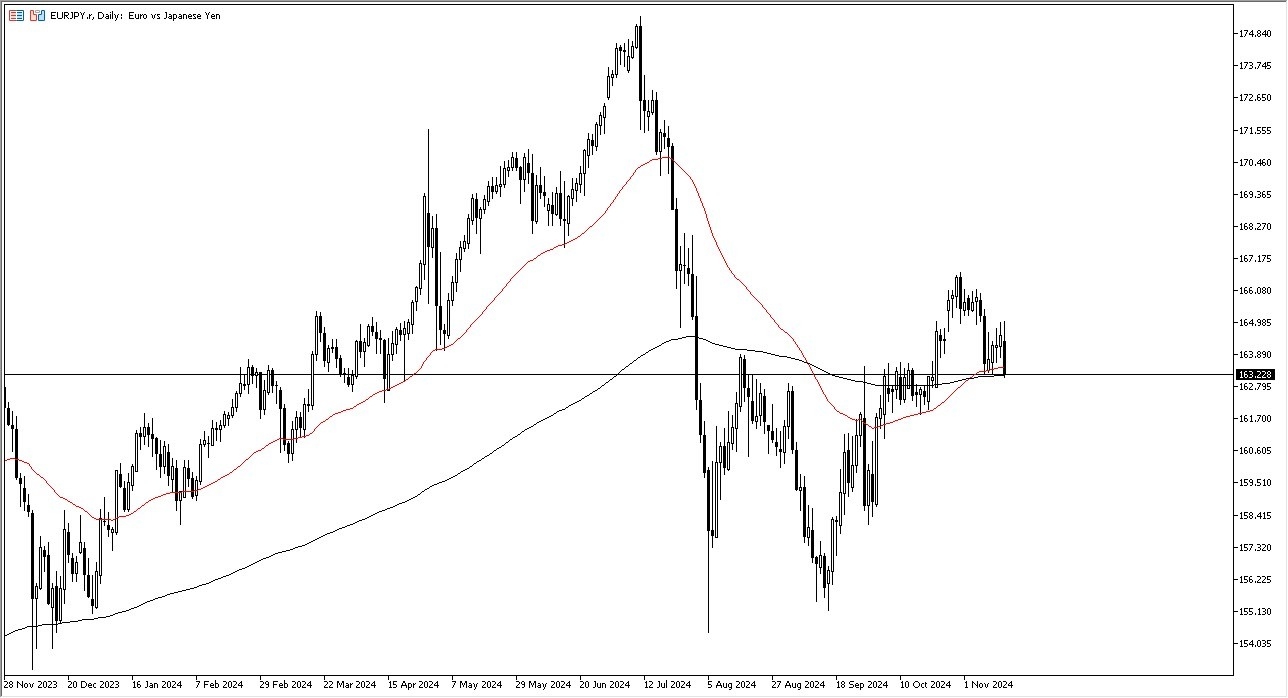
  • Because of this, we are now testing the 200 Day EMA, which of course is an important indicator that a lot of people will pay attention to for the longer-term, and therefore think you get a situation where if the buyers are going to return, it’s probably going to be fairly soon.
  • All things being equal, this is a fairly ugly candlestick, so it’ll be interesting to see if we can get some of that “mojo back” from the previous move higher.

All things being equal, this is a pair that continues to favor interest rate differentials for the euro, with this being the case, the market is likely to continue to see a lot of people getting involved, as they can get paid at the end of every day to hang on to this pair. Quite frankly, even though the euro itself isn’t necessarily a currency that I liked, it is going to probably fare better than the Japanese yen going forward.

Technical Analysis

The technical analysis for the EUR/JPY currency pair of course suggests that there is a lot of support in this area, as the ¥163 level is an area that we’ve seen a lot of action at previously. That being said, the market is likely to continue to see the area between they are in the ¥162 level as a major “squishy support level.” By doing so, the market is likely to continue to see a lot of value hunters out there trying to get involved, and therefore I think you’ve got a scenario where people will look for a value play to get long again.

If we were to break down below the ¥161 level, then it’s likely that the pair could drop down to the ¥158.50 level, which is an area that we have seen a lot of support at previously. That would be a target for short sellers, but at this point in time I think they will probably be repudiated long before we get to that area.

Ready to trade our daily Forex forecast? Here’s a list of some of the best regulated forex brokers to check out. 

Source link

18 11, 2024

Pound Sterling recovery could remain limited unless risk mood improves

By |2024-11-18T12:06:10+02:00November 18, 2024|Forex News, News|0 Comments

  • GBP/USD holds steady above 1.2600 to start the new week.
  • The pair closed the previous six trading days in negative territory.
  • The technical picture is yet to point to a buildup of recovery momentum.

GBP/USD registered six consecutive daily losses and fell over 2% in the previous week. The pair holds steady above 1.2600 in the European morning on Monday but the technical picture doesn’t yet point to a buildup of recovery momentum.

British Pound PRICE Last 7 days

The table below shows the percentage change of British Pound (GBP) against listed major currencies last 7 days. British Pound was the weakest against the US Dollar.

  USD EUR GBP JPY CAD AUD NZD CHF
USD   1.61% 2.36% 1.32% 1.40% 1.94% 1.95% 1.23%
EUR -1.61%   0.71% -0.18% -0.10% 0.41% 0.43% -0.28%
GBP -2.36% -0.71%   -0.96% -0.79% -0.29% -0.30% -1.00%
JPY -1.32% 0.18% 0.96%   0.07% 0.51% 0.70% -0.10%
CAD -1.40% 0.10% 0.79% -0.07%   0.58% 0.52% -0.19%
AUD -1.94% -0.41% 0.29% -0.51% -0.58%   -0.01% -0.66%
NZD -1.95% -0.43% 0.30% -0.70% -0.52% 0.00%   -0.72%
CHF -1.23% 0.28% 1.00% 0.10% 0.19% 0.66% 0.72%  

The heat map shows percentage changes of major currencies against each other. The base currency is picked from the left column, while the quote currency is picked from the top row. For example, if you pick the British Pound from the left column and move along the horizontal line to the US Dollar, the percentage change displayed in the box will represent GBP (base)/USD (quote).

The broad-based US Dollar (USD) strength weighed heavily on GBP/USD last week. Hawkish comments from Federal Reserve (Fed) officials and the inflation data from the US, which showed that the annual core Consumer Price Index (CPI) rose 3.3% in October, helped the USD outperform its rivals.

Meanwhile, the UK’s Office for National Statistics (ONS) reported on Friday that the UK’s Gross Domestic Product (GDP) expanded by 0.1% on a quarterly basis in the third quarter. This reading missed the market expectation for a 0.2% growth and didn’t allow GBP/USD to gain traction ahead of the weekend.

In the absence of high-tier data releases, investors could react to changes in risk perception on Monday. At the time of press, US stock index futures were trading mixed. In case Wall Street’s main indexes start the week on a bearish note amid escalating geopolitical tensions, GBP/USD could have a hard time holding its ground.

Over the weekend, CNN News reported that US President Joe Biden has authorized Ukraine to use powerful long-range American weapons to strike inside Russia. Reporting on the matter, “the change comes largely in response to Russia’s deployment of North Korean ground troops to supplement its own forces, a development that has caused alarm in Washington and Kyiv,” Reuters said.

In the early trading hours of the American session, Chicago Fed President Austan Goolsbee will be delivering a speech. According to the CME FedWatch Tool, markets are currently pricing in a nearly 40% probability of the Fed holding the policy rate unchanged at the December meeting. If Goolsbee adopts a cautious tone regarding another rate cut before the end of the year, GBP/USD could come under renewed bearish pressure.

GBP/USD Technical Analysis

GBP/USD was last seen trading near the upper limit of the 10-day-old descending regression channel at around 1.2630. In case the pair starts using this level as support, sellers could remain on the sidelines. However, the Relative Strength Index (RSI) indicator on the 4-hour chart remains below 40, suggesting that even if the pair rises, it would be considered as a technical correction rather than a reversal.

Above 1.2630, the 20-period Simple Moving Average (SMA) could act as next resistance at 1.2670 before 1.2700 (round level, static level). On the downside, 1.2580 (mid-point of the descending channel) could be seen as first support before 1.2530 (lower limit of the descending channel) and 1.2500 (round level).

Pound Sterling FAQs

The Pound Sterling (GBP) is the oldest currency in the world (886 AD) and the official currency of the United Kingdom. It is the fourth most traded unit for foreign exchange (FX) in the world, accounting for 12% of all transactions, averaging $630 billion a day, according to 2022 data. Its key trading pairs are GBP/USD, also known as ‘Cable’, which accounts for 11% of FX, GBP/JPY, or the ‘Dragon’ as it is known by traders (3%), and EUR/GBP (2%). The Pound Sterling is issued by the Bank of England (BoE).

The single most important factor influencing the value of the Pound Sterling is monetary policy decided by the Bank of England. The BoE bases its decisions on whether it has achieved its primary goal of “price stability” – a steady inflation rate of around 2%. Its primary tool for achieving this is the adjustment of interest rates. When inflation is too high, the BoE will try to rein it in by raising interest rates, making it more expensive for people and businesses to access credit. This is generally positive for GBP, as higher interest rates make the UK a more attractive place for global investors to park their money. When inflation falls too low it is a sign economic growth is slowing. In this scenario, the BoE will consider lowering interest rates to cheapen credit so businesses will borrow more to invest in growth-generating projects.

Data releases gauge the health of the economy and can impact the value of the Pound Sterling. Indicators such as GDP, Manufacturing and Services PMIs, and employment can all influence the direction of the GBP. A strong economy is good for Sterling. Not only does it attract more foreign investment but it may encourage the BoE to put up interest rates, which will directly strengthen GBP. Otherwise, if economic data is weak, the Pound Sterling is likely to fall.

Another significant data release for the Pound Sterling is the Trade Balance. This indicator measures the difference between what a country earns from its exports and what it spends on imports over a given period. If a country produces highly sought-after exports, its currency will benefit purely from the extra demand created from foreign buyers seeking to purchase these goods. Therefore, a positive net Trade Balance strengthens a currency and vice versa for a negative balance.


Source link

18 11, 2024

Euro finds support but remains vulnerable

By |2024-11-18T10:05:28+02:00November 18, 2024|Forex News, News|0 Comments

  • EUR/USD trades near 1.0550 following previous week’s sharp decline.
  • The pair remains technically bearish in the short term despite stabilizing.
  • ECB President Lagarde will deliver a speech later in the day.

EUR/USD managed to find a foothold on Friday but still lost nearly 1.7% in the previous week. The pair stays in a consolidation phase to begin the new week and trades at around 1.0550.

Euro PRICE Last 7 days

The table below shows the percentage change of Euro (EUR) against listed major currencies last 7 days. Euro was the weakest against the US Dollar.

  USD EUR GBP JPY CAD AUD NZD CHF
USD   1.68% 2.35% 1.33% 1.41% 1.94% 1.94% 1.29%
EUR -1.68%   0.62% -0.26% -0.16% 0.34% 0.35% -0.30%
GBP -2.35% -0.62%   -0.98% -0.78% -0.28% -0.28% -0.91%
JPY -1.33% 0.26% 0.98%   0.09% 0.53% 0.70% -0.02%
CAD -1.41% 0.16% 0.78% -0.09%   0.57% 0.51% -0.13%
AUD -1.94% -0.34% 0.28% -0.53% -0.57%   -0.02% -0.64%
NZD -1.94% -0.35% 0.28% -0.70% -0.51% 0.02%   -0.64%
CHF -1.29% 0.30% 0.91% 0.02% 0.13% 0.64% 0.64%  

The heat map shows percentage changes of major currencies against each other. The base currency is picked from the left column, while the quote currency is picked from the top row. For example, if you pick the Euro from the left column and move along the horizontal line to the US Dollar, the percentage change displayed in the box will represent EUR (base)/USD (quote).

Hawkish comments from Federal Reserve (Fed) officials caused investors to reassess the probability of one more 25 basis points rate cut in December last week, providing a boost to the US Dollar (USD) and weighing heavily on EUR/USD.

Monday’s economic calendar will not offer any high-impact data releases that could impact EUR/USD’s action. Hence, market participants will pay close attention to comments from central bank officials.

In the early American session, Chicago Fed President Austan Goolsbee will be delivering a speech. Speaking on the policy outlook on Friday, “I don’t like tying our hands,” Goolsbee said and added that they still have more data to come before deciding on the December policy decision. Later in the day, European Central Bank (ECB) President Christine Lagarde will deliver a speech titled “The Economic and Human Issues of a Changing Era” at an event organized by The Collège des Bernardins in Paris, France.

Meanwhile, investors will also keep an eye on geopolitical headlines. Over the weekend, CNN News reported that US President Joe Biden has authorized Ukraine to use powerful long-range American weapons to strike inside Russia. Reporting on the matter, “the change comes largely in response to Russia’s deployment of North Korean ground troops to supplement its own forces, a development that has caused alarm in Washington and Kyiv,” Reuters said.

US stock index futures trade marginally higher in the European morning but investors could seek refuge in case geopolitical tensions escalate further. A bearish opening in US stocks could help the USD regather its strength in the second half of the day.

EUR/USD Technical Analysis

EUR/USD seems to have stabilized following the previous week’s decline but the technical outlook remains bearish. The pair trades within the descending regression channel and the Relative Strength Index (RSI) indicator stays below 50. 

On the downside, 1.0500 (mid-point of the descending channel) aligns as first support before 1.0440 (lower limit of the descending channel). Looking north, first resistance could be spotted at 1.0570 (upper limit of the descending channel) ahead of 1.0600 (round level) and 1.0650 (50-period Simple Moving Average).

Euro FAQs

The Euro is the currency for the 19 European Union countries that belong to the Eurozone. It is the second most heavily traded currency in the world behind the US Dollar. In 2022, it accounted for 31% of all foreign exchange transactions, with an average daily turnover of over $2.2 trillion a day. EUR/USD is the most heavily traded currency pair in the world, accounting for an estimated 30% off all transactions, followed by EUR/JPY (4%), EUR/GBP (3%) and EUR/AUD (2%).

The European Central Bank (ECB) in Frankfurt, Germany, is the reserve bank for the Eurozone. The ECB sets interest rates and manages monetary policy. The ECB’s primary mandate is to maintain price stability, which means either controlling inflation or stimulating growth. Its primary tool is the raising or lowering of interest rates. Relatively high interest rates – or the expectation of higher rates – will usually benefit the Euro and vice versa. The ECB Governing Council makes monetary policy decisions at meetings held eight times a year. Decisions are made by heads of the Eurozone national banks and six permanent members, including the President of the ECB, Christine Lagarde.

Eurozone inflation data, measured by the Harmonized Index of Consumer Prices (HICP), is an important econometric for the Euro. If inflation rises more than expected, especially if above the ECB’s 2% target, it obliges the ECB to raise interest rates to bring it back under control. Relatively high interest rates compared to its counterparts will usually benefit the Euro, as it makes the region more attractive as a place for global investors to park their money.

Data releases gauge the health of the economy and can impact on the Euro. Indicators such as GDP, Manufacturing and Services PMIs, employment, and consumer sentiment surveys can all influence the direction of the single currency. A strong economy is good for the Euro. Not only does it attract more foreign investment but it may encourage the ECB to put up interest rates, which will directly strengthen the Euro. Otherwise, if economic data is weak, the Euro is likely to fall. Economic data for the four largest economies in the euro area (Germany, France, Italy and Spain) are especially significant, as they account for 75% of the Eurozone’s economy.

Another significant data release for the Euro is the Trade Balance. This indicator measures the difference between what a country earns from its exports and what it spends on imports over a given period. If a country produces highly sought after exports then its currency will gain in value purely from the extra demand created from foreign buyers seeking to purchase these goods. Therefore, a positive net Trade Balance strengthens a currency and vice versa for a negative balance.


Source link

18 11, 2024

CAD/JPY Forecast Today 14/11: Pushes Higher (Video)

By |2024-11-18T08:03:55+02:00November 18, 2024|Forex News, News|0 Comments

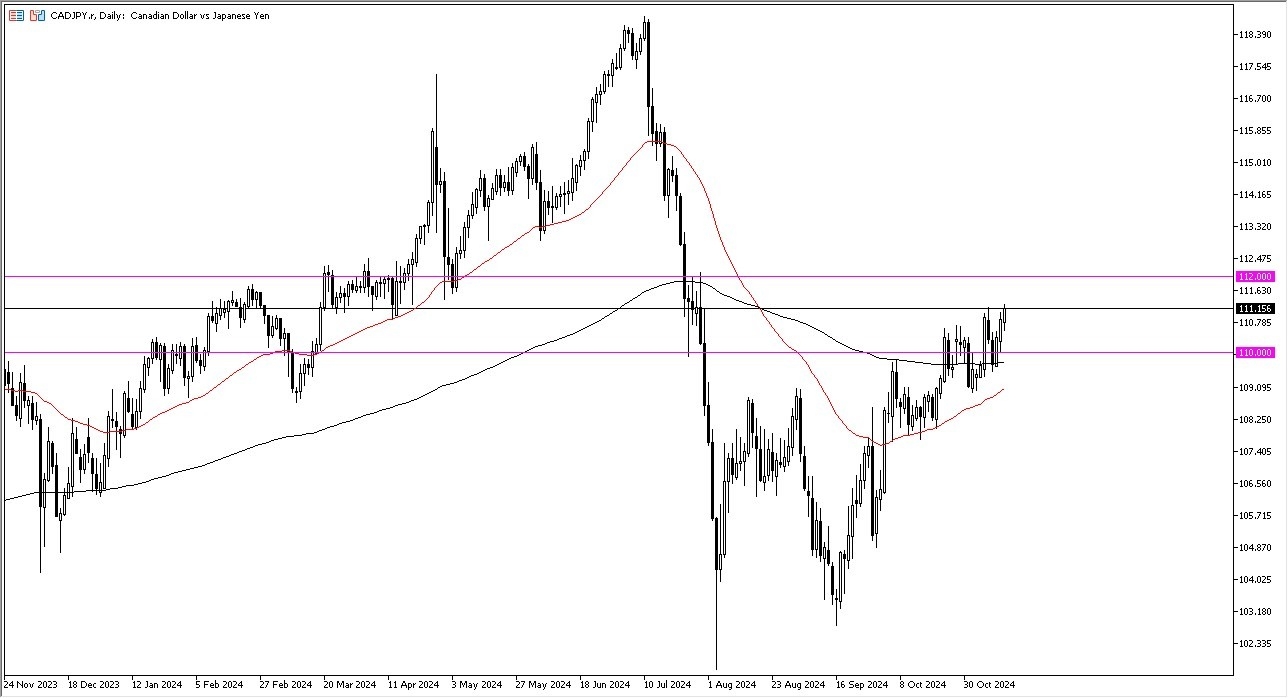
  • The Canadian dollar initially pulled back just a bit during the early hours on Wednesday, as the Japanese yen saw a little bit of strength early, but we have since turned around to show signs of life.
  • All things being equal, this is a market that has been very noisy for a while, and the fact that we had bounced from a couple of days ago at the 200 day EMA does suggest that we are going to continue to try to grind to the upside.
  • The 112 yen level is the top of an overall consolidation range that we have been in, and if we can break above that level, then it’s likely that we will go much higher.

On the other hand, if we turn around and drop from here, the 200 day EMA sits right around the 110 yen level, which of course is a large round psychologically significant figure and an area that a lot of people will be paying close attention to. Keep in mind that this is also a play on oil a lot of the times due to the fact that Canada is a major exporter of crude oil, while the Japanese import 100 percent of theirs. With this being the case, it does tend to move right along with the WTI crude oil market, for example.

Noisy Market Will Continue to Be So

That being said, the market is going to continue to be noisy, but I think given enough time, we will have to make a bigger decision. The Japanese yen itself is being hindered by the fact that the Bank of Japan can’t do anything to tighten interest rates, and as long as that’s going to be the case, there’s really no reason to think that the yen will strengthen significantly, unless of course there’s been some type of event.

I think this is a grind to the 112 yen level, and once we can break out of there, then we can really take off. For what it is worth, the US dollar climbed over a major hurdle against the yen today, so we may see the yen fall apart everywhere.

Ready to trade our Forex daily analysis and predictions? Here’s a list of the best Forex Trading platform in Canada to choose from. 

Source link

17 11, 2024

Weekly Forex Forecast – 17/11: EUR/USD, GBP/USD (Charts)

By |2024-11-17T21:59:07+02:00November 17, 2024|Forex News, News|0 Comments

(MENAFN– Daily Forex) Fundamental Analysis & market Sentiment

I wrote on 10th November that the best trade opportunities for the week were likely to be:

  • Long of bitcoin in USD terms. Bitcoin has risen by 12.55% over the past week.

  • Long of the S&P 500 index . The Index fell by 2.30% over the past week.

  • Long of the nasdaq 100 Index . The Index fell by 3.51% over the past week.

The weekly gain of 6.74% equals 2.25% per asset.Last week’s key takeaways were:

  • US CPI (inflation) – all the inflation metrics were exactly as forecasted, and the annualized rate rose to 2.6% .

  • US PPI – as expected, reinforcing no news on inflation.

  • US Retail Sales – slightly stronger than expected, at a month-on-month increase of 0.4% compared to the forecasted 0.3%. This may increase the chance of a rate hike by the Fed at its December policy meeting.

  • UK GDP – considerably worse than expected, showing a month-on-month contraction of 0.1% when an increase of 0.2% was expected. This increases the chance of a rate cut and has helped make the Pound the weakest of all major currencies right now.

  • Australian Wage Price Index – a fraction lower than expected at a quarterly increase of 0.8%. In a very small way, this may increase the case for a further rate cut.

  • New Zealand Inflation Expectations = 2.12%.

  • UK Claimant Count Change (Unemployment Claims) – more or less as expected.

  • Australian Unemployment Rate – as expected at 4.1%.Last week, the most important factors driving the market were not so much economic data but a growing digestion of what the Trump / Republican victory in the USA will mean economically and for markets generally. The strong slump in stock markets towards the end of the week, especially in the USA, should be cause for concern, as the major indices have almost retreated back to where they were when news of Trump’s victory began to emerge Week Ahead: 18th – 22nd NovemberThe coming week’s schedule is lighter, with the most important scheduled events likely to be inflation data releases in the UK and Canada.

  • UK CPI (inflation)

  • Canada CPI (inflation)

  • UK Monetary Policy Report Hearings

  • US Unemployment Claims

  • UK Retail Sales

  • Canada Retail Sales

  • US, German, UK, French Services & Manufacturing PMIMonthly Forecast November 2024 I made no monthly forecast for November, as the long-term trends in the Forex market were too unclear Forecast 17th November 2024I made no weekly forecast this week, as there were no unusually strong directional price movements over the past week, which is the basis of my weekly trading strategy.Last week, the US Dollar was the strongest major currency, while the British Pound was the weakest. One third of the most important Forex currency pairs and crosses changed in value by over 1%.You can trade these forecasts in a real or demo Forex brokerage account .Key Support/Resistance Levels for Popular Pairs Top Forex Brokers1 Get Started 74% of retail CFD accounts lose money Technical AnalysisUS Dollar IndexLast week, the US Dollar Index printed a large bullish candlestick that broke out beyond the resistance level at 105.81, as well as the upper trend line of the formerly dominant consolidating triangle chart pattern , which can be seen in the price chart below. These are bullish signs, but it should be noted that the candlestick has a large upper wick, showing that the Dollar struggled to hold some of its earlier gains as it consolidated towards the end of last week.The price is now above its levels from both three months ago and six months ago, suggesting a long-term bullish trend in the greenback, which should be exploitable.The strong US Dollar is supported by the expectation that the new Trump / Republican control of the executive and legislature in the USA will lead to a more hawkish monetary policy. This has been evidenced by the strong increase in US Treasury Yields over recent weeks.I have plenty of technical and fundamental reasons to be bullish on the US Dollar. The only bearish note comes from the price not clearing the 1-year+ high at 107.00, which was previously a major bearish inflection point, so I would be more bullish above 107.00 if the price gets established up there.
    EUR/USDLast week, the EUR/USD currency pair printed a relatively large bearish candlestick, which made the lowest weekly close seen in one year. The weekly candlestick closed not far from its low, although there is enough of a lower wick on the candlestick for it to be worth noting. The price is below its levels from both 3 and 6 months ago, which is my preferred metric for calling a long-term bearish trend. The US Dollar Index is also in a long-term bearish trend. A final bearish signal is that the 50-day moving average has crossed below the 100-day moving average, which validates the trend.So, there are plenty of reasons to go short here, but I remain concerned that the price area being reached was a bullish inflection point when it was last tested, around the $1.0500 area, and there may still be demand here. This concern is strengthened by the fact that for almost 2 years, the price has ranged approximately between $1.0500 and $1.1250.The best approach here is to look for short swing trades from retests and rejections of resistance levels above the current price. GBP/USDLast week, the GBP/USD currency pair printed a large bearish candlestick, making the lowest weekly close seen in 6 months. It was the largest bearish candlestick range in several months, suggesting strong bearish momentum. The weekly candlestick closed near its low, and the British Pound was the weakest of all major currencies last week. The price is below its levels from both 3 and 6 months ago, which is my preferred metric for calling a long-term bearish trend. The US Dollar Index is also in a long-term bearish trend.There are several bearish technical signs. Turning to fundamentals, one of the reasons the Pound is weak is that the Bank of England may be forced to cut rates more quickly after last week’s very poor UK GDP data, which showed a contraction of economic activity over the month. The weakening British economy may require a faster rate cut, which will help sink the Pound.The US Dollar also remained strong following the Republican victory in the US general election, so the price could continue falling for several reasons. However, I don’t want to be short here until the trend is established for longer – I like to see the 50-day moving average below the 100-day moving average before going short. Day traders may be interested in this pair on the short side. USD/JPYThe USD/JPY currency pair gained last week in line with the general rise in the US Dollar but gave up most of its gains by the end of the week, as can be seen by the large upper wick on the most recent weekly candlestick shown within the price chart below.The moving average positions still need to be fully bullish for the long term, so I do not see this pair as fully trending. Additionally, the price is above its level of 3 months ago but still needs to reach its level of 6 months ago, reinforcing the lack of true trend. European currencies like the Euro are considerably weaker than the Yen.So, although there are reasons not to trade this pair for trend or momentum, what it does have – in conjunction with almost all the Yen crosses – is a high level of volatility, making this an interesting currency pair for Forex day traders to focus on. USD/CADThe USD/CAD currency pair made a strong gain last week, as it made a bullish breakout to a new 4-year high price, which is a significant long-term high price.The weekly close was located quite near the top of the weekly range, which is another bullish sign.The technical picture could hardly be more bullish and is supported by the fundamental picture, which sees a strong US Dollar boosted by the upcoming Trump presidency and Republican Congress, and also a weak Canadian Dollar, which is being driven lower by the global decline in the price of crude oil – WTI Crude Oil closed last week at its lowest weekly closing price in 18 months.There are many reasons to think about going long here, but remember that this currency pair typically trends little as the American and Canadian economies are so intertwined. However, there are periods in which this is not true. As we have seen some divergence between the Federal Reserve and the Bank of Canada on monetary policy in recent months, this may be such a period now. BitcoinBitcoin saw another week of extraordinary gains as it powered to new all-time highs, topping to date above $93,000. The price rose by more than 10% over the week.There is no reason not to be bullish except that the price is now not far from the huge six-figure round number at $100,000. If the price arrives at, or very close to, that point, we will likely see massive profit taking as there will be a 25% gain within just a few weeks, an enormous rise in value for any asset. So, this leg of the bull run, or maybe this whole trend, maybe does not have much further to run.Bitcoin received a significant boost from the election victories of President Trump and Congressional Republicans in both Houses. Republicans are seen as more likely to favour lighter regulation of cryptocurrency, so their ascendancy has boosted both crypto in particular and risk sentiment in general, which also helps a risky asset like Bitcoin.I think it is smart to be long of Bitcoin, just be mindful of $100,000 as a potentially strong barrier. With such momentum and strong gains, a trend or momentum trader should be interested.Note that Bitcoin ETFs are not getting the full gain made by the underlying, not in some way, so if you can afford it, you might want to buy Bitcoin futures instead of a Bitcoin ETF or even spot Bitcoin. There are Bitcoin micro futures available on the CME, which are only sized at 10% of the value of one Bitcoin. NASDAQ 100 IndexThe NASDAQ 100 Index fell last week, especially on Friday, when it made its strongest daily fall since September. The daily chart below shows that after making a new record high recently following the Trump/Republican victory in the US election, the price printed classing topping price action triggered the big drop at the end of the week.The price is now almost where it was when it became clear Trump had won the Presidency, which is an ominous sign for the market. It was expected Trump would boost stocks quite strongly, but if the price falls just a bit further, we will be in negative Trump territory.There is a long-term bullish trend here, so there are still plenty of reasons to expect the price to turn bullish again.The price is now approaching a critical technical area just below the big round number at 20,000 – there is a confluence here of an obvious horizontal area of support and the lower trend line of the linear regression channel, which I have drawn to cover the recent bullish leg of the price action. If the price continues to fall and gets established below 19,800, it might quickly fall considerably.I do not see the NASDAQ 100 Index as a buy for now, especially below 19,800. Bottom LineI see the best trading opportunities this week as

    • Long of Bitcoin in USD terms.

    • Short of the EUR/USD currency pair.

    Ready to trade our weekly Forex analysis ? Check out our list of the best Forex brokers worth checking out.

    MENAFN17112024000131011023ID1108894781
    Source link

    Go to Top