The main tag of Forex News Today Articles.
You can use the search box below to find what you need.
[wd_asp id=1]
16
08, 2024
Pound Sterling benefits from Fed-BoE policy divergence
- The Pound Sterling hit a two-week high against the US Dollar, extending its recovery from five-week lows.
- GBP/USD buyers to retain control as eyes turn to Fed Minutes, PMI data and Jackson Hole Symposium.
- The path of least resistance appears to the upside for the Pound Sterling amid bullish technicals.
The Pound Sterling (GBP) sustained the rebound and hit a two-week high against US Dollar (USD), driving the GBP/USD pair to the 1.2900 mark amid a data-dominated week.
Pound Sterling cheered Fed-BoE policy divergence
GBP/USD rebounded strongly this week, helped by the return of risk flows and divergent monetary policy outlooks between the US Federal Reserve (Fed) and the Bank of England (BoE).
The high-impact economic data releases from both the US and the UK underscored the central bank’s imbalances regarding their potential policy action. Earlier in the week, strong UK employment data and hot Consumer Price Index (CPI) data prompted investors to dial down their expectations of the BoE lowering interest rate in September.
The annual UK inflation increased to 2.2%, rising back above the BoE’s 2.0% target, the Office for National Statistics (ONS) said, slightly less than the median forecast of 2.3%. Meanwhile, UK employment data was a positive surprise, with the Unemployment Rate falling from 4.4% to 4.2% in the quarter to June, beating market expectations of an increase to 4.5%. These figures were boosted by an increase in part-time jobs.
Data published by the ONS showed Friday that the UK Retail Sales rebounded 0.5% over the month in July after dropping 1.2% in June, aligning with the market forecast of a 0.5% increase in the reported month. The Core Retail Sales, stripping the auto motor fuel sales, jumped 0.7% MoM, against the previous decline of 1.3%, a tad softer than expectations.
On the other hand, strong US Retail Sales and Jobless Claims data combined with a benign inflation report suggested that a September rate cut from the Fed is very well on the table. Retail Sales in the US climbed 1% on the month, according to numbers adjusted for seasonality but not for inflation, beating the expectations of a 0.3% increase by a wide margin. Meanwhile, Initial Jobless claims for the week ended Aug. 10 came in at 227,000, a drop of 7,000 from the previous week and lower than the estimate for 235,000.
The annual US CPI inflation slowed for a fourth consecutive month to 2.9% in July 2024, the lowest since March 2021, compared to 3.0% in June and below forecasts of 3.0, the monthly CPI rebounded 0.2% last month after falling 0.1% in June, the Labor Department’s Bureau of Labor Statistics (BLS) said on Wednesday.
Markets are now pricing in just a 25% chance of a 50 basis points (bps) cut from the Fed next month, down from 55% a week ago, according to the CME Group’s FedWatch tool. However, the odds of a 25 bps September rate reduction still hold above 70%.
Other than policy divergence, risk sentiment remained in a sweeter spot almost throughout the week, following the previous week’s volatility that roiled it. No fresh signs of Middle East geopolitical escalation between Iran and Israel calmed nerves while encouraging US macro news alleviated recession fears.
Although Iran continued to issue warnings against an imminent attack on Israel, no such action was undertaken. Amongst the latest developments, the Israeli Defense Ministry reportedly imposed sanctions on 18 oil tankers transporting Iranian oil to cut down Iran’s vital fuel sale revenues. Iran’s Supreme Leader Ayatollah Ali Khamenei issued a warning on Thursday against any form of retreat or compromise, invoking the concept of “divine wrath”.
Fed Minutes to stand out in the Jackson Hole Symposium week
With the inflation reports from both sides of the Atlantic now out of the way, Pound Sterling traders eagerly await the Minutes of the Fed’s July policy meeting for fresh cues on the interest-rate outlook.
The Fed Minutes will be reported on Wednesday. The first two days of the week are devoid of any significant economic news from the UK and the US. However, Atlanta Fed President Raphael Bostic’s speech on Tuesday could offer some trading impetus.
Thursday will feature the UK and the US S&P Global preliminary Manufacturing and Services PMI data while the usual US weekly Jobless Claims and Existing Home Sales data will be also eyed.
The three-day annual Kansas City Fed’s Jackson Hole Symposium will be held on Thursday, with key central banks’ officials likely to speak.
Fed Chair Jerome Powell is due to speak at the Symposium on Friday at 14:00 GMT, followed by BoE Governor Andrew Bailey’s speech at 19:00 GMT. Ahead of that the US New Home Sales will be published.
Sentiment around the central banks’ policy expectations will remain a key driving force in the week ahead, with traders also focused on the Middle East geopolitical escalation between Iran and Israel.
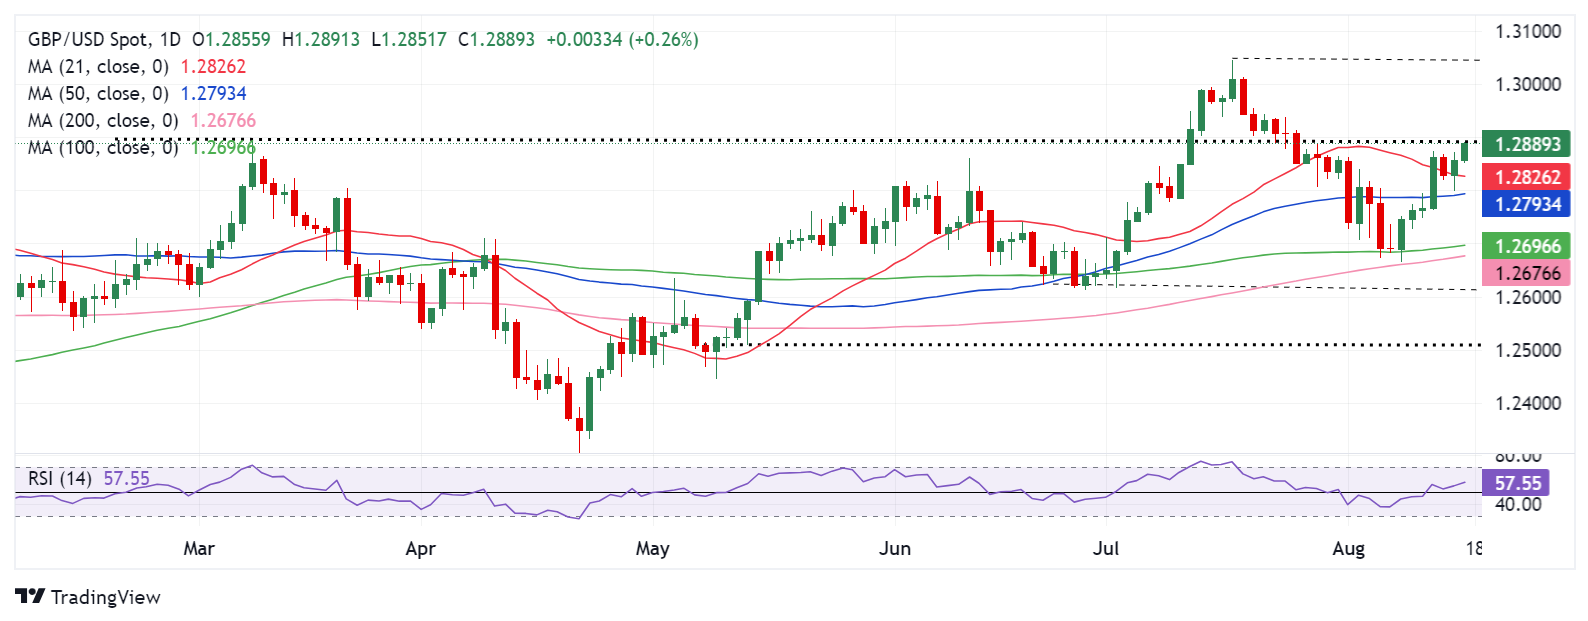
GBP/USD: Technical Outlook
Having defended the crucial 200-day Simple Moving Average (SMA), now at 1.2676, GBP/USD built a solid recovery from five-week lows of 1.2665.
In doing so, Pound Sterling buyers recorded a fresh two-week high just shy of the March 8 high of 1.2893 after recapturing the key 21-day SMA resistance at 1.2825 on a sustained basis.
With the 14-day Relative Strength Index (RSI) pointing north above the 50 level, currently near 56.50, the bullish potential remains intact for the British Pound.
If buyers manage to yield a weekly closing above the March 8 high of 1.2893 or the 1.2900 round figure, a fresh uptrend toward the 1.3000 psychological level cannot be ruled.
Next, the July high of 1.3045 will come into the picture, as buyers would aim for further upside to the 1.3100 level.
On the downside, the 21-day SMA resistance-turned-support at 1.2825 could come to the immediate rescue of buyers, below which the 50-day SMA at 1.2793 will be challenged.
On a sustained break of the 50-day SMA cap, additional declines could be seen toward the 1.2680 demand area, where the 100-day SMA and the 200-day SMA close in.
Thereafter, the June low of 1.2613 and the mid-May low at around 1.2510 will be the next bearish targets.
Central banks FAQs
Central Banks have a key mandate which is making sure that there is price stability in a country or region. Economies are constantly facing inflation or deflation when prices for certain goods and services are fluctuating. Constant rising prices for the same goods means inflation, constant lowered prices for the same goods means deflation. It is the task of the central bank to keep the demand in line by tweaking its policy rate. For the biggest central banks like the US Federal Reserve (Fed), the European Central Bank (ECB) or the Bank of England (BoE), the mandate is to keep inflation close to 2%.
A central bank has one important tool at its disposal to get inflation higher or lower, and that is by tweaking its benchmark policy rate, commonly known as interest rate. On pre-communicated moments, the central bank will issue a statement with its policy rate and provide additional reasoning on why it is either remaining or changing (cutting or hiking) it. Local banks will adjust their savings and lending rates accordingly, which in turn will make it either harder or easier for people to earn on their savings or for companies to take out loans and make investments in their businesses. When the central bank hikes interest rates substantially, this is called monetary tightening. When it is cutting its benchmark rate, it is called monetary easing.
A central bank is often politically independent. Members of the central bank policy board are passing through a series of panels and hearings before being appointed to a policy board seat. Each member in that board often has a certain conviction on how the central bank should control inflation and the subsequent monetary policy. Members that want a very loose monetary policy, with low rates and cheap lending, to boost the economy substantially while being content to see inflation slightly above 2%, are called ‘doves’. Members that rather want to see higher rates to reward savings and want to keep a lit on inflation at all time are called ‘hawks’ and will not rest until inflation is at or just below 2%.
Normally, there is a chairman or president who leads each meeting, needs to create a consensus between the hawks or doves and has his or her final say when it would come down to a vote split to avoid a 50-50 tie on whether the current policy should be adjusted. The chairman will deliver speeches which often can be followed live, where the current monetary stance and outlook is being communicated. A central bank will try to push forward its monetary policy without triggering violent swings in rates, equities, or its currency. All members of the central bank will channel their stance toward the markets in advance of a policy meeting event. A few days before a policy meeting takes place until the new policy has been communicated, members are forbidden to talk publicly. This is called the blackout period.


")
