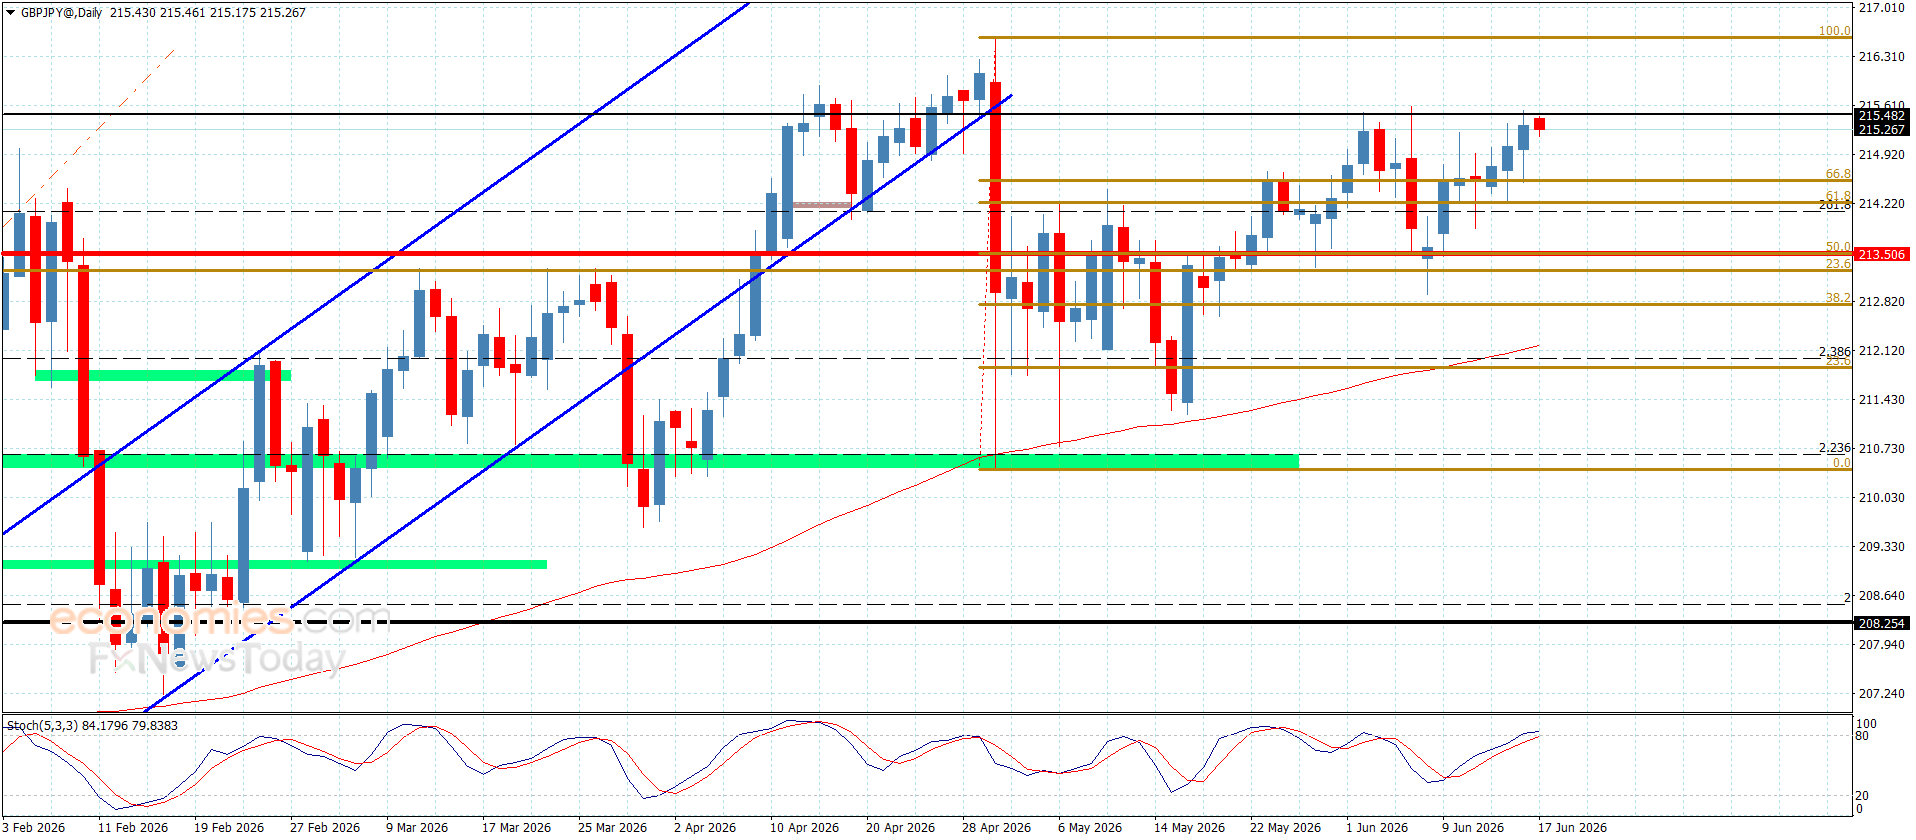
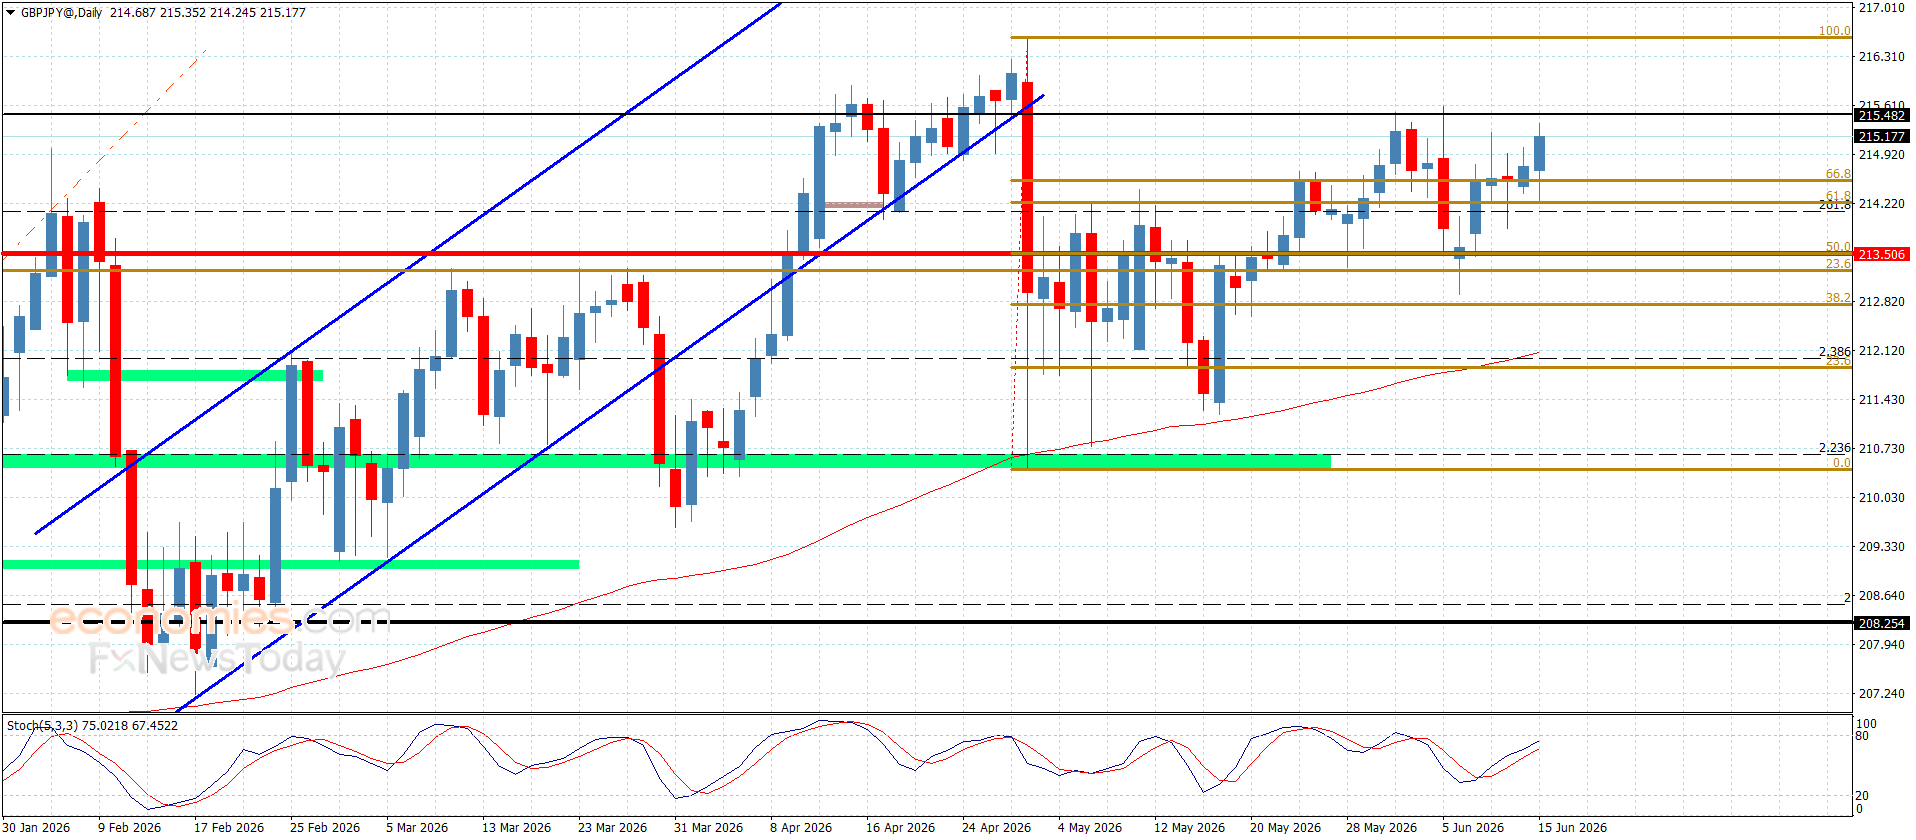
The pair’s price renewed its attempts to pressure the stable resistance at 215.50, trying to find a way to resume the previously expected bullish attack. We recommend waiting for the price to achieve the required breakout, which would strengthen the chances of reaching positive levels that may begin at 216.60 and extend in the near term toward 217.55.
However, failure to break through would push the price to form downward corrective waves, putting pressure on the 214.10 level and reaching the stable support at 213.50, which in turn represents the key level for confirming the proposed direction for the upcoming trades.
The expected trading range for today is between 214.50 and 216.65
EUR/JPY depreciates after three days of gains, trading around 186.20 during the Asian hours on Wednesday. The currency cross holds a constructive bullish bias as it remains above both the nine-day and 50-day Exponential Moving Averages (EMAs). This positioning suggests the recent advance is supported by underlying demand.
The 14-day Relative Strength Index (RSI) near 60 hints at firm but not yet overextended upside momentum. Additionally, the technical analysis of the daily chart suggests the EUR/JPY cross is remaining within the ascending channel pattern, suggesting an ongoing bullish bias.
The EUR/JPY cross may explore the region around the all-time high of 187.95, recorded on April 17, followed by the upper boundary of the ascending channel around 188.30.
On the downside, the primary support lies at the nine-day EMA of 185.66, followed by the 50-day EMA of 185.18. A break below these moving averages would cause a bearish shift, exposing the lower boundary of the ascending channel near 184.70. Further declines could push the EUR/JPY cross to test its nearly four-month low of 181.87, recorded on March 16, with further declines targeting the six-month low of 180.81, reached on February 12.
EUR/JPY: Daily Chart
(The technical analysis of this story was written with the help of an AI tool.)
Euro Price Today
The table below shows the percentage change of Euro (EUR) against listed major currencies today. Euro was the weakest against the Swiss Franc.
USD
EUR
GBP
JPY
CAD
AUD
NZD
CHF
USD
-0.03%
-0.01%
-0.08%
0.02%
0.05%
0.01%
-0.13%
EUR
0.03%
0.01%
-0.06%
0.03%
0.08%
0.08%
-0.10%
GBP
0.01%
-0.01%
-0.06%
0.03%
0.11%
0.05%
-0.08%
JPY
0.08%
0.06%
0.06%
0.08%
0.12%
0.05%
-0.02%
CAD
-0.02%
-0.03%
-0.03%
-0.08%
0.04%
-0.00%
-0.11%
AUD
-0.05%
-0.08%
-0.11%
-0.12%
-0.04%
-0.02%
-0.13%
NZD
-0.01%
-0.08%
-0.05%
-0.05%
0.00%
0.02%
-0.11%
CHF
0.13%
0.10%
0.08%
0.02%
0.11%
0.13%
0.11%
The heat map shows percentage changes of major currencies against each other. The base currency is picked from the left column, while the quote currency is picked from the top row. For example, if you pick the Euro from the left column and move along the horizontal line to the US Dollar, the percentage change displayed in the box will represent EUR (base)/USD (quote).
The Pound to Dollar exchange rate (GBP/USD) climbed to 10-day highs above 1.3460 after reports that the US and Iran had agreed a peace deal boosted risk appetite and reduced demand for the safe-haven US Dollar.
Lower oil prices and improving market sentiment helped Sterling advance, although investors remain cautious ahead of a crucial week of central bank decisions and key UK political developments.
GBP/USD Forecasts: Hits 10-Day Highs
The US and Iran agreement of a peace deal has underpinned risk appetite and curbed potential dollar support with the Pound to Dollar (GBP/USD) exchange rate advancing to 10-day highs at 1.3460 before settling around 1.3430.
As well as the Middle East situation, there is a key Federal Reserve meeting while the Bank of England (BoE) policy meeting and pivotal Makerfield by-election are due on “Super Thursday”.
There remains tough resistance in the 1.3500 area and, according to UoB; “while the increase in momentum suggests GBP could break above 1.3465, based on the prevailing momentum, it is too early to tell if GBP can break above 1.3490.”
On a longer-term perspective, ING considers that GBP/USD will retreat to 1.31 on a 3-month view before recovering to 1.35 into the year-end period.
Save on Your GBP/USD Transfer
Get better rates and lower fees on your next international money transfer.
Compare TorFX with top UK banks in seconds and see how much you could save.
Overnight, the US and Iran agreed a peace deal with a potential signing on Friday. Oil prices have moved lower while there has been a boost to risk appetite with equities posting net gains
ING is doubtful that risk appetite can strengthen sharply; “Financial markets have had opportunities to react to this kind of deal on several occasions already, and the MSCI World Index is already 5% higher than before the war. This suggests risk assets might not need to travel too far on today’s welcome news.”
As far as the Federal Reserve is concerned, markets expect rates to be held at 3.75%, but there is an important element of uncertainty over the statement and potential guidance. There is also the risk of a split vote.
ING commented; “The market clearly expects a less dovish set of communications (with an easing bias and expected 2026 rate cut removed), but we suspect he will have to talk tough on inflation to avoid upsetting the long end of the bond market.”
MUFG, however, does not see major dollar support; “The US rate market has already moved to scale back Fed rate hike expectations, but there is room for US yields and the US dollar to fall further if Kevin Warsh does not provide a hawkish policy surprise this week.”
Traders also expect the BoE to hold rates at 3.75% with a split vote as the majority back waiting to assess inflation trends while a minority are expected to back a rate hike.
MUFG senior economist Henry Cook expressed concern over a waiting game; “We do think there is a risk that they end up dithering a bit too much. Playing for time is potentially not the best strategy here.”
Like this piece? Please share with your friends and colleagues:
International Money Transfer? Ask our resident FX expert a money transfer question or try John’s new, free, no-obligation personal service! ,where he helps every step of the way,
ensuring you get the best exchange rates on your currency requirements.
The USD/JPY advances steadily on Tuesday as market participants brace for the Federal Reserve’s monetary policy decision, as the meeting kicked off during the day. At the time of writing, the pair trades at 160.47, within the intervention zone.
USD/JPY Price Forecast: Technical outlook
The USD/JPY has bounced off 159.50 since last week, but it has failed to gain traction amid investor fears of a potential Japanese FX market intervention. From a momentum standpoint, the uptrend should continue as the Relative Strength Index (RSI) is bullish.
Worth noting that the Bank of Japan (BoJ) raised interest rates on Tuesday by 25 basis points to 1% as expected, but the Yen failed to appreciate due to an improvement in risk appetite.
On the upside, the first resistance for USD/JPY is 160.50. A breach of the latter will expose the year-to-date (YTD) high of 160.73 ahead of the 161.00 milestone.
Conversely, if USD/JPY dives below 160.00, the first support would be psychological 159.50, ahead of challenging the 50-day Simple Moving Average (SMA) at 159.00. Below this level, the next support is the 100-day SMA at 158.02.
USD/JPY Price Chart – Daily
USD/JPY daily chart
Japanese Yen Price Today
The table below shows the percentage change of Japanese Yen (JPY) against listed major currencies today. Japanese Yen was the strongest against the Australian Dollar.
USD
EUR
GBP
JPY
CAD
AUD
NZD
CHF
USD
-0.15%
-0.08%
0.06%
0.03%
0.10%
-0.14%
-0.18%
EUR
0.15%
0.09%
0.26%
0.20%
0.24%
0.01%
-0.02%
GBP
0.08%
-0.09%
0.17%
0.13%
0.16%
-0.06%
-0.09%
JPY
-0.06%
-0.26%
-0.17%
-0.06%
-0.01%
-0.19%
-0.25%
CAD
-0.03%
-0.20%
-0.13%
0.06%
0.05%
-0.17%
-0.22%
AUD
-0.10%
-0.24%
-0.16%
0.01%
-0.05%
-0.22%
-0.25%
NZD
0.14%
-0.01%
0.06%
0.19%
0.17%
0.22%
-0.04%
CHF
0.18%
0.02%
0.09%
0.25%
0.22%
0.25%
0.04%
The heat map shows percentage changes of major currencies against each other. The base currency is picked from the left column, while the quote currency is picked from the top row. For example, if you pick the Japanese Yen from the left column and move along the horizontal line to the US Dollar, the percentage change displayed in the box will represent JPY (base)/USD (quote).
Japanese Yen FAQs
The Japanese Yen (JPY) is one of the world’s most traded currencies. Its value is broadly determined by the performance of the Japanese economy, but more specifically by the Bank of Japan’s policy, the differential between Japanese and US bond yields, or risk sentiment among traders, among other factors.
One of the Bank of Japan’s mandates is currency control, so its moves are key for the Yen. The BoJ has directly intervened in currency markets sometimes, generally to lower the value of the Yen, although it refrains from doing it often due to political concerns of its main trading partners. The BoJ ultra-loose monetary policy between 2013 and 2024 caused the Yen to depreciate against its main currency peers due to an increasing policy divergence between the Bank of Japan and other main central banks. More recently, the gradually unwinding of this ultra-loose policy has given some support to the Yen.
Over the last decade, the BoJ’s stance of sticking to ultra-loose monetary policy has led to a widening policy divergence with other central banks, particularly with the US Federal Reserve. This supported a widening of the differential between the 10-year US and Japanese bonds, which favored the US Dollar against the Japanese Yen. The BoJ decision in 2024 to gradually abandon the ultra-loose policy, coupled with interest-rate cuts in other major central banks, is narrowing this differential.
The Japanese Yen is often seen as a safe-haven investment. This means that in times of market stress, investors are more likely to put their money in the Japanese currency due to its supposed reliability and stability. Turbulent times are likely to strengthen the Yen’s value against other currencies seen as more risky to invest in.
Overall Trend: Bearish in the medium term with short-term rebound attempts.
Support Levels for EUR/USD Today: 1.1570 – 1.1510 – 1.1460
Resistance Levels for EUR/USD Today: 1.1655 – 1.1690 – 1.1780
EUR/USD Trading Signals:
Buy scenario: From the support level of 1.1530 with a target of 1.1730 and a stop-loss at 1.1470
Sell scenario: From the resistance level of 1.1710 with a target of 1.1560 and a stop-loss at 1.1780
Technical Analysis of EUR/USD Today
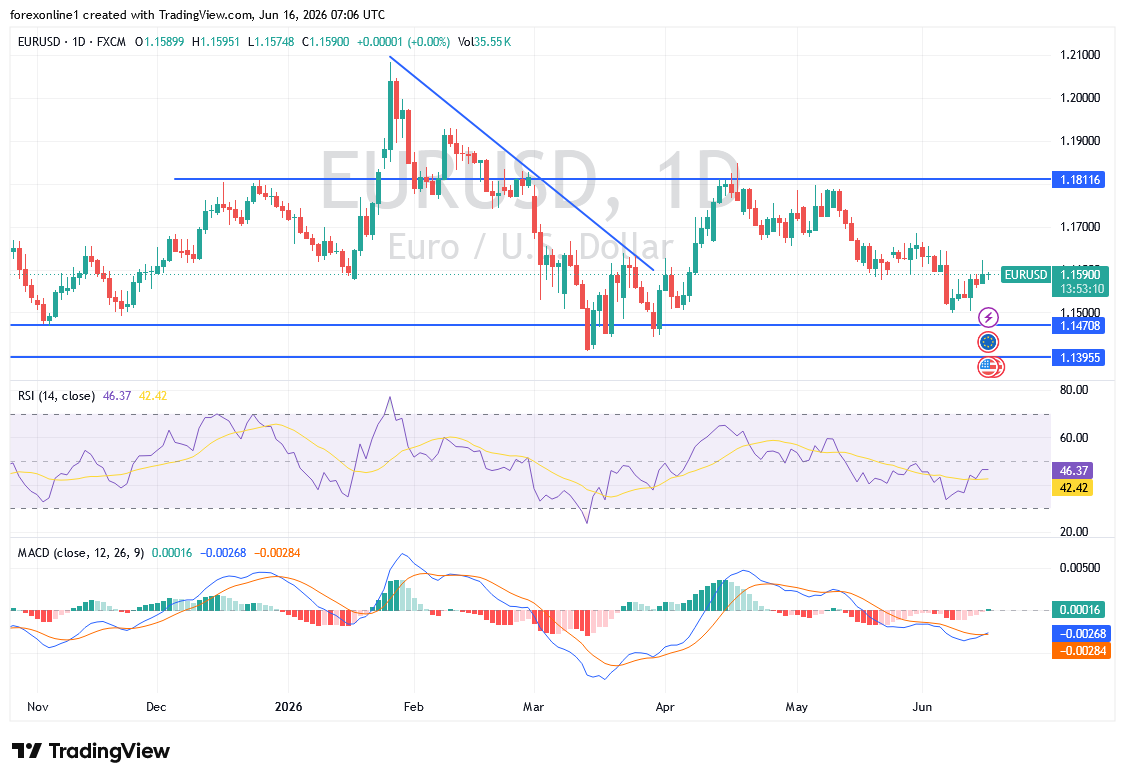
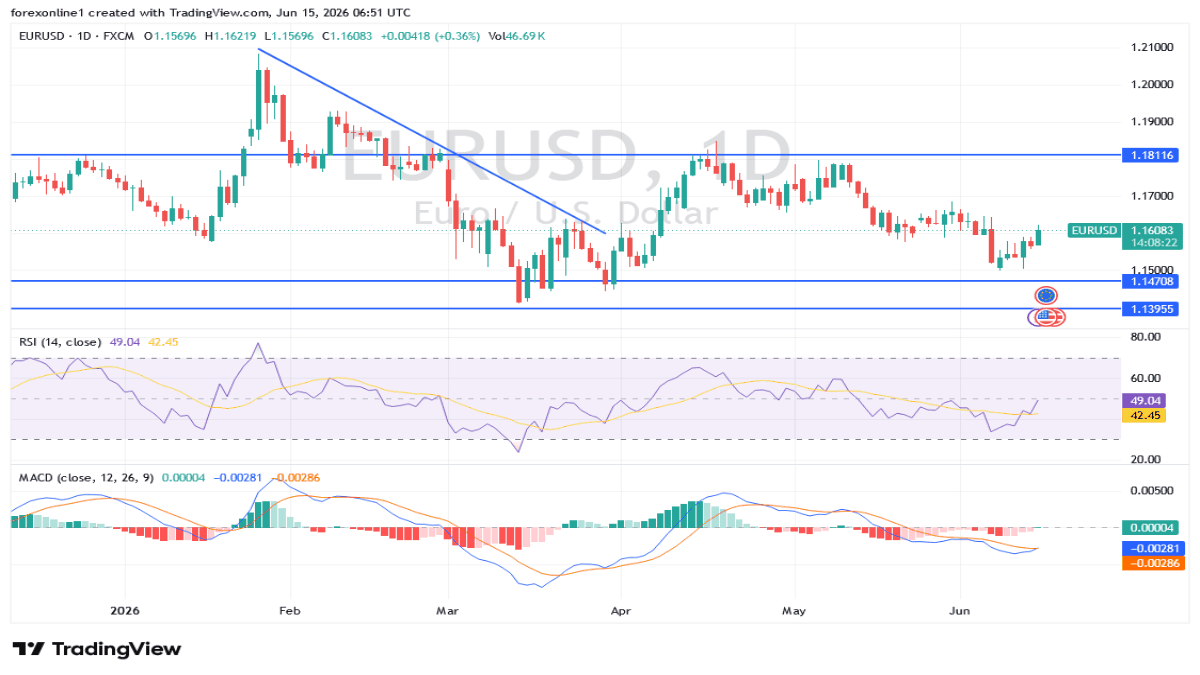
The EUR/USD pair is moving within a clear bearish trend inside a descending price channel extending since mid-April. The general trend still leans in favor of the sellers despite the current corrective rebound that followed the baseline test of strong support near the 1.1500 level.
This recovery comes as part of a corrective move toward dynamic resistance levels that coincide with the boundaries of the descending channel. This places the price before an important technical test that could determine the fate of the short-term trend: will the correction continue, or will selling pressure return once again?
Technically, the Fibonacci levels drawn from the high at 1.1690 to the low at 1.1500 indicate pivotal resistance zones that must be closely monitored during the current move.
The 38.2% correction level is located at 1.1570, followed by the 50% level at 1.1590, while the 61.8% level extends to 1.1615, which nearly coincides with the upper boundary of the descending channel. This confluence of Fibonacci levels with the descending channel’s resistance represents a potentially strong supply zone, which could push the price to rebound back toward the recent low or even register new lows if bearish momentum returns.
From a Moving Averages perspective, the 100-day Simple Moving Average (SMA) remains below its 200-day counterpart, reflecting the continuation of the overall bearish structure. Furthermore, both averages are sloping downward and sit well above current trading levels, reinforcing the likelihood of continued negative pressure over the medium term.
As for momentum, the Stochastic indicator has risen sharply from oversold territory, indicating a temporary improvement in bullish momentum as it currently heads toward the midpoint of its range. This supports the continuation of the current corrective move before any potential resumption of the downward trend.
Similarly, the Relative Strength Index (RSI) is experiencing a gradual recovery from its recent low levels, with additional room to move upward before entering the overbought zone.
However, the emergence of weakness signals near current resistance levels could be an early indication that the correction is over and the downtrend is regaining control.
EUR/USD Future Outlook
The EUR/USD pair may remain within its current price range on reputable trading platforms until the market reacts to the US Federal Reserve’s announcement this week. The euro’s gains came as investors flocked to riskier assets following the US and Iran’s announcement of a preliminary agreement to end their three-month-long conflict.
Trading advice:
It is preferable for traders to monitor the price reaction at the 1.1700 resistance level, while maintaining strict risk management given the ongoing uncertainty in the markets.
EUR/JPY depreciates after two days of gains, trading around 185.60 during the early European hours on Tuesday. The currency cross holds a mild bullish bias as it trades above the nine-day and 50-day Exponential Moving Averages (EMAs).
Meanwhile, the 14-day Relative Strength Index (RSI) around 54 sits in neutral territory, hinting at a constructive but not overstretched upside tone as long as price remains supported above the medium-term average.
Additionally, the technical analysis of the daily chart suggests the EUR/JPY cross is moving within the ascending channel pattern, suggesting an ongoing bullish bias.
The EUR/JPY cross may find the primary resistance at the six-week high of 186.21, reached on June 5. Further advances would lead the currency cross to approach the all-time high of 187.95, recorded on April 17, followed by the upper boundary of the ascending channel around 188.20.
On the downside, the immediate support lies at the nine-day EMA of 185.39, followed by the 50-day EMA of 185.12. Further declines below these moving averages would trigger a bearish shift, exposing the lower boundary of the ascending channel near 184.70. Extended downward momentum could push the EUR/JPY cross to test its nearly four-month low of 181.87, recorded on March 16, with further declines targeting the six-month low of 180.81, reached on February 12.
EUR/JPY: Daily Chart
(The technical analysis of this story was written with the help of an AI tool.)
Euro Price Today
The table below shows the percentage change of Euro (EUR) against listed major currencies today. Euro was the weakest against the US Dollar.
USD
EUR
GBP
JPY
CAD
AUD
NZD
CHF
USD
0.02%
0.04%
-0.02%
0.13%
0.22%
0.15%
0.04%
EUR
-0.02%
0.03%
0.00%
0.12%
0.21%
0.13%
0.03%
GBP
-0.04%
-0.03%
-0.02%
0.10%
0.17%
0.12%
0.01%
JPY
0.02%
0.00%
0.02%
0.12%
0.20%
0.16%
0.06%
CAD
-0.13%
-0.12%
-0.10%
-0.12%
0.08%
0.00%
-0.09%
AUD
-0.22%
-0.21%
-0.17%
-0.20%
-0.08%
-0.06%
-0.15%
NZD
-0.15%
-0.13%
-0.12%
-0.16%
-0.01%
0.06%
-0.10%
CHF
-0.04%
-0.03%
-0.01%
-0.06%
0.09%
0.15%
0.10%
The heat map shows percentage changes of major currencies against each other. The base currency is picked from the left column, while the quote currency is picked from the top row. For example, if you pick the Euro from the left column and move along the horizontal line to the US Dollar, the percentage change displayed in the box will represent EUR (base)/USD (quote).
The British pound has strengthened against the US dollar, with the GBP/USD pair moving decisively beyond the 20-day exponential moving average (EMA) amid reports of a potential US-Iran diplomatic agreement. The development has injected fresh optimism into currency markets, particularly for risk-sensitive pairs like cable.
US-Iran Deal Talks Boost Risk Appetite
Reports emerging from diplomatic channels indicate that the United States and Iran are nearing a framework agreement on nuclear and regional security issues. While details remain unconfirmed, market participants have interpreted the progress as a positive step toward de-escalation in the Middle East, reducing geopolitical risk premiums that have weighed on the dollar in recent sessions.
The potential deal has triggered a shift in sentiment, with traders reducing safe-haven allocations to the greenback. This has provided a tailwind for the pound, which had been trading in a narrow range below the 20-day EMA for much of the past week.
Technical Outlook: Key Levels to Watch
The break above the 20-day EMA, currently near 1.2650, signals a short-term bullish shift in momentum. The pair is now testing resistance around the 1.2700 psychological level, a zone that has capped upside attempts in recent weeks.
If the pound sustains its advance, the next key target lies at the 50-day EMA near 1.2780. A decisive close above this level would open the door to the 1.2850 region, where the 100-day EMA converges with prior price congestion.
On the downside, the 20-day EMA now serves as initial support, with a break below exposing the 1.2600 handle and the recent swing low near 1.2550.
Market Implications for Traders
The GBP/USD move reflects a broader recalibration of currency markets as geopolitical risks recede. For traders, the key question is whether the US-Iran developments represent a sustainable catalyst or a temporary reprieve. The dollar’s trajectory will also depend on upcoming US economic data, including non-farm payrolls and inflation figures, which could reinforce or reverse the current trend.
The pound’s outlook remains tied to Bank of England policy expectations. With UK inflation still above target, markets are pricing in a slower pace of rate cuts relative to the Federal Reserve, which has provided underlying support for sterling.
Conclusion
The GBP/USD pair’s advance beyond the 20-day EMA is a technically significant move, supported by improving sentiment around US-Iran diplomatic efforts. While the short-term bias has turned bullish, traders should watch for confirmation at key resistance levels and remain attentive to evolving geopolitical and economic data. The next few sessions will be critical in determining whether this breakout has lasting momentum.
FAQs
Q1: What is the 20-day EMA and why is it important for GBP/USD? The 20-day exponential moving average is a short-term technical indicator that smooths price data to identify trend direction. A move above it often signals bullish momentum and is closely watched by forex traders for entry and exit signals.
Q2: How does a US-Iran deal affect the GBP/USD exchange rate? A US-Iran agreement can reduce geopolitical risk, which tends to weaken the safe-haven US dollar and boost risk-sensitive currencies like the British pound. Improved sentiment and reduced uncertainty often lead to capital flows away from the dollar.
Q3: What are the key resistance and support levels for GBP/USD? Key resistance is at 1.2700 (psychological level) and 1.2780 (50-day EMA). Key support is at 1.2650 (20-day EMA) and 1.2600 (round number), with a break below exposing the 1.2550 swing low.
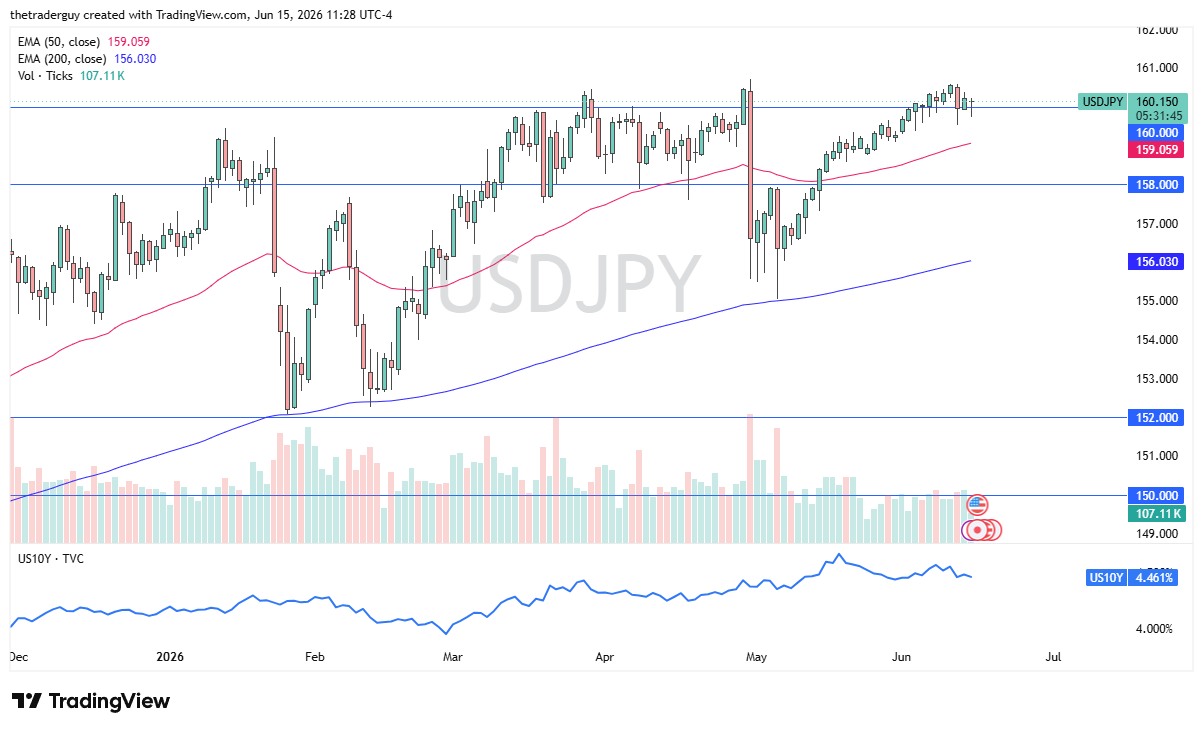
The US dollar initially pulled back just a touch during the trading session here on Monday but turned around to show signs of life. The 160-yen level is an area that I think a lot of people will be watching very closely, as it’s a large psychologically significant level, but it’s also the beginning of significant resistance, I think that runs to about the 160.60-yen level.
If we can break above there, then it’s likely that the market goes even higher, as it is a smashing of the 1990 swing high. If we do fall from here, then I think there’s plenty of support near the 50-day EMA. So, I look at this as a buy on the dip type of market.
Interest Rate Differentials and Long-Term Targets
With that being said, I’m paying close attention to the 10-year yield. It did drop a little bit during the session, hinging on the idea of peace breaking out in the Middle East. It’s really not a new peace deal, I think we’re talking about, I think it is a situation where we are looking at a longer-term ceasefire. Who knows what it really turns into, and I would also point out that, unfortunately, the demands and the little bits that are being released by the Iranians now suggest things that I’d be really surprised if the Americans went along with.
Regardless, the interest rate differential in this pair continues to favor the US dollar, and I do think that we will eventually break out, kicking off a longer-term buy-and-hold type of market. The measured move from the rounding bottom that started in 1990 is 224-yen.
Christopher Lewis is a technical analyst and market commentator at DailyForex with more than two decades of trading experience in Forex and other leveraged markets. Based in Columbus, Ohio, he specializes in chart-based analysis of major currency pairs, stock indices, commodities, and energy markets, focusing on clear support and resistance levels, trend structure, and risk management. Christopher produces daily written and video analysis for traders who rely on technical setups to navigate volatile market conditions
As seen on:Pairs Of Aces Podcast,The Trader Guy, FXEmpire
Overall Trend: Bearish in the medium term with short-term rebound attempts.
Support Levels for EUR/USD Today: 1.1525 – 1.1470 – 1.1400
Resistance Levels for EUR/USD Today: 1.1640 – 1.1700 – 1.1770
EUR/USD Trading Signals:
Buy scenario: From the support level of 1.1480 with a target of 1.1650 and a stop-loss at 1.1400
Sell scenario: From the resistance level of 1.1670 with a target of 1.1480 and a stop-loss at 1.1760
Technical Analysis of EUR/USD Today
Technically, the EUR/USD currency pair continues to move near important resistance levels following a strong bearish wave over the past few weeks. The current performance reflects a state of hesitation among traders amid an absence of strong catalysts to push the price to break through new levels.
According to top trading platforms, the currency pair stabilized near the 1.1600 resistance level. Currently, short-term indicators show bullish rebound attempts, but the general trend still leans downward. However, continued trading below key resistances could prompt some profit-taking and a bearish correction before resuming the main trend.
The Bullish Scenario
If buyers succeed in pushing prices above the 1.1600 resistance, the rally could extend towards 1.1650 and then 1.1700, with a clear improvement in positive momentum.
The Bearish Scenario
If the US dollar strengthens or the Federal Reserve issues hawkish statements, the pair could decline towards the 1.1500 support level, followed by 1.1450 and then 1.1380.
Currently, the technical indicators remain bearish. The most prominent indicators on the daily timeframe are the 14-day RSI, the MACD, and the moving averages. Breaking the 1.1700 resistance level is crucial for a shift to a bullish trend in the near term. The EUR/USD pair will be affected today by new comments from European Central Bank (ECB) President Christine Lagarde at 10:15 AM Egypt time. This will be followed by the release of industrial production figures for the Eurozone and the United States. It’s worth noting that the ECB raised interest rates by 25 basis points, which provided temporary support to the euro.
At that time, the Euro found initial support from this move, as policymakers indicated that monetary policy tightening remains firmly on the table, boosting expectations for a potential rate hike again in July.
Factors Affecting the Pair’s Movement Today
The EUR/USD pair’s movements today will be influenced by several key factors, most notably:
Statements from ECB policymakers.
Economic data from the Eurozone and the United States.
US dollar movements related to interest rate expectations.
Continued geopolitical uncertainty in global markets.
Trading Advice:
It is recommended that traders monitor price action at the 1.1600 and 1.1700 resistance levels, while maintaining strict risk management given the ongoing market uncertainty.
Mahmoud has been working fulltime in the Foreign Exchange markets for 12 years. Offers his analysis, articles and recommendations at the most renewed Arabic websites specialized in the global financial markets, and his experience gained a lot of interest among Arab traders. Works on providing technical analysis, market news, free signals and more with follow up for at least 12 hours a day, and aims to simplify forex trading and the concept of trading for his audience.
The pair continues to remain positioned within a positive trend so far, supported by the formation of the 213.50 level as the first key support. This has led to renewed attempts to reach the resistance near 215.50, in an effort to find a breakout path to resume the upward movement in the short to medium term trading.
Based on the above, we will remain waiting for the price to achieve the required breakout, which would increase the likelihood of targeting 216.10 and 216.65 initially. With continued positive factors, the movement could extend toward 217.50, which represents the first main target of the upward trend.
The expected trading range for today is between 214.00 and 216.10