The main tag of Forex News Today Articles.
You can use the search box below to find what you need.
[wd_asp id=1]

10 04, 2026

EUR/GBP Forecast: Crucial Support Zone Expected to Hold Through 2025 – ING Analysis

By |2026-04-10T13:04:15+02:00April 10, 2026|Forex News, News|0 Comments

BitcoinWorld

EUR/GBP Forecast: Crucial Support Zone Expected to Hold Through 2025 – ING Analysis

Financial markets in London and Frankfurt are closely monitoring the EUR/GBP currency pair as ING analysts project a crucial support zone will hold through 2025, potentially stabilizing the cross-rate amid diverging monetary policies between the European Central Bank and Bank of England. The euro-pound exchange rate, currently trading around 0.8550, faces significant technical and fundamental tests as central banks navigate inflation challenges while economic growth patterns diverge across European economies.

EUR/GBP Technical Analysis and Support Zone Dynamics

Technical analysts at ING have identified a critical support zone between 0.8520 and 0.8480 for the EUR/GBP pair. This zone represents a confluence of multiple technical factors that historically provided substantial buying interest. The 200-day moving average currently intersects this region, creating additional technical significance. Furthermore, Fibonacci retracement levels from the 2024 rally align with these price points, strengthening the zone’s importance.

Market participants observe several key technical indicators suggesting potential stabilization. The Relative Strength Index (RSI) recently approached oversold territory near 30, typically preceding corrective bounces in trending markets. Additionally, trading volume patterns show increased activity near the support zone, indicating heightened institutional interest at these levels. Bollinger Band analysis reveals the pair testing the lower band boundary, a condition that often precedes mean reversion moves in currency markets.

Historical Context of EUR/GBP Support Levels

The identified support zone carries historical significance dating back to pre-Brexit trading ranges. Market memory often creates psychological barriers at price levels where previous reversals occurred. Technical analysts note that this zone previously acted as resistance during 2023’s downward trend before breaking higher in early 2024. Such role reversals between support and resistance frequently create stronger technical barriers, as multiple market participants establish positions around these levels.

Fundamental Drivers Behind EUR/GBP Movements

Monetary policy divergence represents the primary fundamental driver for EUR/GBP movements in 2025. The European Central Bank maintains a cautious approach toward interest rate adjustments, prioritizing inflation control over growth stimulation. Conversely, the Bank of England faces different economic pressures, particularly regarding consumer spending patterns and housing market stability. This policy divergence creates natural currency valuation pressures that technical levels must withstand.

Economic growth differentials further influence the currency pair’s trajectory. Eurozone economies demonstrate varying recovery paces, with Germany’s manufacturing sector showing signs of stabilization while Southern European nations experience stronger service sector growth. Meanwhile, UK economic indicators reveal persistent challenges in productivity growth and trade balance improvements. These fundamental factors create underlying currents that technical analysis must incorporate for accurate forecasting.

Key economic indicators affecting EUR/GBP:

  • Interest rate differentials between ECB and BoE
  • Inflation convergence or divergence patterns
  • Manufacturing PMI comparisons across regions
  • Trade balance developments and current account positions
  • Labor market strength and wage growth trends

Central Bank Policy Implications for Currency Markets

Central bank communications increasingly influence currency valuations beyond mere policy decisions. The European Central Bank’s forward guidance emphasizes data dependency, creating uncertainty about the timing and magnitude of future rate adjustments. This uncertainty typically increases currency volatility but may also strengthen support zones as markets price in various scenarios. The Bank of England faces similar communication challenges while managing market expectations about inflation persistence.

Quantitative tightening programs represent another crucial factor. Both central banks continue balance sheet reduction efforts, though at different paces and scales. The relative speed of these programs affects currency supply dynamics, potentially strengthening the currency of the central bank pursuing more aggressive balance sheet normalization. Market participants closely monitor these technical aspects of monetary policy implementation, as they directly impact currency valuation models.

Institutional Positioning and Market Sentiment

Commitments of Traders reports reveal changing institutional positioning around the EUR/GBP support zone. Hedge funds and asset managers adjusted their exposure throughout 2024, with recent data showing reduced net short positions as the pair approached technical support. This positioning shift suggests professional traders anticipate potential stabilization or reversal near current levels. Meanwhile, retail trader sentiment indicators show increased caution, typically a contrarian signal in currency markets.

Comparative Analysis of European Economic Conditions

The eurozone and United Kingdom face distinct economic challenges that influence their respective currencies. Eurozone integration efforts continue affecting currency stability, particularly regarding fiscal policy coordination and energy market reforms. These structural factors create longer-term currency valuation pressures that technical analysis must consider. Meanwhile, UK-specific factors including post-Brexit trade arrangements and financial services competitiveness create unique pound sterling dynamics.

Economic Indicator Comparison: Eurozone vs United Kingdom

Indicator Eurozone (Latest) United Kingdom (Latest) Impact on EUR/GBP
Core Inflation 2.8% 3.2% Moderate Sterling pressure
GDP Growth Forecast 1.2% 0.8% Euro supportive
Unemployment Rate 6.5% 4.2% Mixed implications
Manufacturing PMI 48.7 47.2 Neutral to Euro positive
Consumer Confidence -14.2 -21.5 Euro supportive

Risk Factors That Could Break EUR/GBP Support

Several risk factors threaten the integrity of the identified EUR/GBP support zone. Geopolitical developments in Eastern Europe continue affecting energy markets and European economic stability. Any escalation in regional conflicts could disproportionately impact eurozone economies through energy price channels. Additionally, political developments within European Union member states create uncertainty about fiscal policy coordination and structural reform implementation.

UK-specific risks include persistent inflation surprises that might force more aggressive Bank of England action than currently anticipated. Housing market vulnerabilities represent another concern, particularly if mortgage rate resets create consumer spending constraints. Furthermore, trade relationship developments with both European Union and non-EU partners could significantly impact pound sterling valuations through current account effects.

Primary risk scenarios for EUR/GBP:

  • Unexpected ECB policy pivot toward earlier easing
  • UK inflation persistence requiring additional rate hikes
  • European recession signals deepening beyond expectations
  • Significant divergence in energy price impacts between regions
  • Political instability affecting fiscal policy coordination

Market Structure and Liquidity Considerations

Currency market structure evolution affects how support zones function in modern trading environments. Algorithmic trading participation continues growing, potentially amplifying moves toward technical levels while also providing liquidity near those levels. The EUR/GBP pair benefits from deep liquidity pools during European trading hours, though Asian and American session liquidity varies significantly. This liquidity pattern creates potential for overnight gaps that technical analysts must consider when evaluating support zone reliability.

Market microstructure analysis reveals changing transaction patterns around key technical levels. Order book data shows concentrated liquidity accumulation near the 0.8520 support level, with both resting orders and algorithmic liquidity provision creating a buffer against rapid declines. This market structure development supports ING’s analysis that the zone should hold against normal market volatility, though exceptional events could overwhelm these technical defenses.

Conclusion

ING’s EUR/GBP analysis presents a technically grounded forecast suggesting the identified support zone between 0.8520 and 0.8480 should hold through 2025’s market conditions. This projection combines rigorous technical analysis with fundamental understanding of central bank policies and economic divergences. While risk factors exist that could challenge this support zone, the confluence of technical indicators, institutional positioning, and market structure developments creates substantial evidence for the zone’s durability. Currency traders and risk managers should monitor this EUR/GBP support zone closely, as its integrity will significantly influence cross-rate volatility and directional bias throughout the coming year.

FAQs

Q1: What specific price levels define the EUR/GBP support zone according to ING?
ING analysts identify the critical support zone between 0.8520 and 0.8480, representing a confluence of technical factors including the 200-day moving average and key Fibonacci retracement levels.

Q2: How does monetary policy divergence affect the EUR/GBP exchange rate?
Divergence between European Central Bank and Bank of England policies creates natural currency valuation pressures, with interest rate differentials and quantitative tightening pace differences directly impacting the exchange rate’s fundamental valuation.

Q3: What technical indicators support the analysis that this zone will hold?
Multiple technical indicators suggest potential stabilization, including RSI approaching oversold conditions, Bollinger Band positioning, historical support/resistance role reversal, and volume patterns showing increased activity near these levels.

Q4: What are the main risk factors that could break this EUR/GBP support?
Primary risks include unexpected central bank policy pivots, geopolitical developments affecting European energy markets, UK inflation persistence requiring additional rate hikes, and significant economic divergence beyond current expectations.

Q5: How does market structure affect support zone reliability in modern currency trading?
Algorithmic trading participation and order book liquidity concentration near technical levels can both amplify moves toward support zones and provide defensive liquidity, creating more defined technical barriers than in previous market eras.

This post EUR/GBP Forecast: Crucial Support Zone Expected to Hold Through 2025 – ING Analysis first appeared on BitcoinWorld.

Source link

10 04, 2026

Pound To Dollar Price Forecast: GBP Rangebound As Ceasefire Doubts Linger

By |2026-04-10T09:03:00+02:00April 10, 2026|Forex News, News|0 Comments

The Pound US Dollar (GBP/USD) exchange rate traded in a narrow range on Thursday as markets adopted a cautious tone amid uncertainty over the durability of the US-Iran ceasefire.

Latest — Exchange Rates:
Pound to Dollar (GBP/USD): 1.34466 (+0.4%)
Euro to Dollar (EUR/USD): 1.17103 (+0.44%)
Dollar to Japanese Yen (USD/JPY): 158.745 (+0.06%)

DAILY RECAP:

The US Dollar (USD) was relatively muted as investors weighed conflicting signals surrounding the US-Iran ceasefire.

While the agreement initially sparked a strong improvement in market sentiment, signs of strain quickly emerged, leaving traders cautious.

Markets appeared caught between optimism that the ceasefire would hold and concerns that tensions could escalate again.

This uncertainty kept demand for the safe-haven US Dollar contained, resulting in limited movement.

Meanwhile, the increasingly risk-sensitive Pound (GBP) was also subdued.

A lack of UK economic data left Sterling without a clear catalyst, while the cautious market mood discouraged strong directional positioning.

foreign exchange rates

As a result, GBP/USD remained rangebound through the session.

GBP/USD Exchange Rate Forecast: Jump in US Inflation to Boost the ‘Greenback’?

Looking forward, high-impact US economic data could influence the Pound US Dollar exchange rate.

The key release is the US consumer price index for March, which will provide insight into inflation dynamics.

Markets expect headline inflation to rise, which could support the US Dollar by dampening expectations for Federal Reserve interest rate cuts.

Attention will also turn to the University of Michigan’s preliminary consumer sentiment index.

Meanwhile, developments in the Middle East will remain a key driver, with shifts in risk appetite likely to influence the direction of GBP/USD.

Source link

10 04, 2026

U.S. Dollar Retreats As GDP Growth Rate Misses Estimates: Analysis For EUR/USD, GBP/USD, USD/CAD, USD/JPY

By |2026-04-10T05:02:23+02:00April 10, 2026|Forex News, News|0 Comments

Scan QR code to install app

Important DisclaimersFXEmpire is owned and operated by Empire Media Network LTD., Company Registration Number 514641786, registered at 7 Jabotinsky Road, Ramat Gan 5252007, Israel. The content provided on this website includes general news and publications, our personal analysis and opinions, and materials provided by third parties. This content is intended for educational and research purposes only. It does not constitute, and should not be interpreted as, a recommendation or advice to take any action, including making any investment or purchasing any product. Before making any financial decision, you should conduct your own due diligence, exercise your own discretion, and consult with competent advisors. The content on this website is not personally directed to you, and we do not take into account your individual financial situation or needs. The information contained on this website is not necessarily provided in real time, nor is it guaranteed to be accurate. Prices displayed may be provided by market makers and not by exchanges. Any trading or other financial decision you make is entirely your own responsibility, and you must not rely solely on any information provided through the website. FXEmpire does not provide any warranty regarding the accuracy, completeness, or reliability of any information contained on the website and shall bear no responsibility for any trading losses you may incur as a result of using such information. The website may include advertisements and other promotional content. FXEmpire may receive compensation from third parties in connection with such content. FXEmpire does not endorse, recommend, or assume responsibility for the use of any third-party services or websites. Empire Media Network LTD., its employees, officers, subsidiaries, and affiliates shall not be liable for any loss or damage resulting from your use of the website or reliance on the information provided herein.Risk DisclaimersThis website contains information about cryptocurrencies, contracts for difference (CFDs), and other financial instruments, as well as about brokers, exchanges, and other entities trading in such instruments. Both cryptocurrencies and CFDs are complex instruments and involve a high risk of losing money. You should carefully consider whether you understand how these instruments work and whether you can afford to take the high risk of losing your money. FX Empire encourages you to conduct your own research before making any investment decision and to avoid investing in any financial instrument unless you fully understand how it works and the risks involved.

Source link

10 04, 2026

CIBC Euro To Dollar Forecast: EUR/USD Tipped At 1.19 By End 2026

By |2026-04-10T01:01:19+02:00April 10, 2026|Forex News, News|0 Comments

The Euro to Dollar (EUR/USD) exchange rate proved resilient early this week amid elevated uncertainty and jumped to highs just above 1.17 on Wednesday following the announcement of a 2-week cease-fire between the US and Iran.

CIBC expects a net EUR/USD advance to 1.19 by the end of this year as the dollar loses traction amid lower US yields.

Inevitably there is still a high degree of uncertainty over the Middle East situation and whether there will be a durable easing of tensions and a resumption of shipping through the Strait of Hormuz.

The bank notes the potential for fresh dollar gains if the Iran situation deteriorates again, but also considers that the US currency is overvalued at current levels.

Importantly, CIBC considers that the economic impact already seen will reinforce its expectations that yields will move in favour of European currencies during the course of this year.

The bank expects that the ECB will be more willing to raise interest rates to combat any second-round inflation effects. In contrast, it does not expect the Federal Reserve will hike rates and, at this stage, is still backing two rate cuts by the end of this year.

foreign exchange rates

Source link

9 04, 2026

GBP/JPY Price Forecast: Pound holds gains with 213.30 high in sight 

By |2026-04-09T21:00:01+02:00April 9, 2026|Forex News, News|0 Comments

The Pound (GBP) is trading higher against a weak Japanese Yen (JPY), extending its rally for the fourth consecutive day, with pullbacks finding support in the lower 212.00s and March highs in the 213.30 area still on the bulls’ radar.

The GBP has shown greater resilience than the Yen to the war in Iran. Investors’ concerns about the economic consequences of the Oil shock in major crude importers, such as Japan, have been a significant headwind to any JPY rally since the war began.

The strong Japanese Labour Cash Earnings data witnessed earlier this week boosted speculation of a near-term interest rate hike by the Bank of Japan (BoJ). This posibility was endorsed by former board member Seiji Adachi on Tuesday, and the Yen bounced up from lows on Wednesday, but the rally was short-lived.

Technical Analysis

GBP/JPY maintains its near-term bullish bias intact. The Relative Strength Index (RSI) stays in positive territory after pulling back from overbought levels, and the Moving Average Convergence Divergence (MACD) histogram remains slightly positive, suggesting that upside momentum is present but not yet exhausted.

Bulls were halted on Wednesday at 213.15, a few pips below the March top of 213.31. Further up, the next target would be the February 9 high, in the 214.00 area.

Support is at Wednesday’s low, near 212.20, ahead of the April 1 high, at 211.44, and the April 2 and 5 lows around 210.50.

(The technical analysis of this story was written with the help of an AI tool.)

(This story was corrected on April 9 at 09:00 GMT to say that the 214.00 area is the February 9 high, and not an early-February high, as previously reported.)

Pound Sterling Price Today

The table below shows the percentage change of British Pound (GBP) against listed major currencies today. British Pound was the strongest against the Japanese Yen.

USD EUR GBP JPY CAD AUD NZD CHF
USD 0.04% 0.03% 0.24% 0.09% 0.20% -0.18% -0.05%
EUR -0.04% 0.02% 0.20% 0.08% 0.16% -0.19% -0.07%
GBP -0.03% -0.02% 0.19% 0.06% 0.15% -0.21% -0.08%
JPY -0.24% -0.20% -0.19% -0.15% -0.04% -0.43% -0.28%
CAD -0.09% -0.08% -0.06% 0.15% 0.12% -0.27% -0.14%
AUD -0.20% -0.16% -0.15% 0.04% -0.12% -0.35% -0.23%
NZD 0.18% 0.19% 0.21% 0.43% 0.27% 0.35% 0.12%
CHF 0.05% 0.07% 0.08% 0.28% 0.14% 0.23% -0.12%

The heat map shows percentage changes of major currencies against each other. The base currency is picked from the left column, while the quote currency is picked from the top row. For example, if you pick the British Pound from the left column and move along the horizontal line to the US Dollar, the percentage change displayed in the box will represent GBP (base)/USD (quote).

Source link

9 04, 2026

EUR/JPY Price Forecast: Rebounds above 185.00 toward upper ascending channel boundary

By |2026-04-09T16:59:02+02:00April 9, 2026|Forex News, News|0 Comments

EUR/JPY rebounds after registering little losses in the previous day, trading around 185.30 during the European hours on Thursday. The daily chart’s technical analysis indicates the currency cross is trending higher within an ascending channel, signaling a bullish bias.

The near-term bias is bullish as the EUR/JPY cross holds above both the nine-day period and 50-period Exponential Moving Averages (EMAs), respectively. The alignment of the shorter EMA above the longer one suggests an underlying upward trend, while the Relative Strength Index (RSI) at 61.38 points to firm but not yet overstretched bullish momentum as the pair edges toward overhead levels.

The EUR/JPY cross may retest immediate resistance near the upper boundary of the ascending channel around 185.70. A break above the channel would reinforce the bullish outlook and open the door toward the all-time high of 186.88, recorded on January 23.

On the downside, initial support is seen at the nine-day EMA of 184.52. A move below this level could weaken the bullish bias, exposing the 50-day EMA at 183.64, followed by the channel’s lower boundary around 183.00.

EUR/JPY: Daily Chart

(The technical analysis of this story was written with the help of an AI tool.)

Euro Price Today

The table below shows the percentage change of Euro (EUR) against listed major currencies today. Euro was the strongest against the Japanese Yen.

USD EUR GBP JPY CAD AUD NZD CHF
USD 0.03% 0.03% 0.21% 0.06% 0.20% -0.23% -0.06%
EUR -0.03% 0.02% 0.20% 0.06% 0.16% -0.24% -0.09%
GBP -0.03% -0.02% 0.17% 0.02% 0.14% -0.27% -0.10%
JPY -0.21% -0.20% -0.17% -0.16% -0.03% -0.46% -0.28%
CAD -0.06% -0.06% -0.02% 0.16% 0.14% -0.29% -0.12%
AUD -0.20% -0.16% -0.14% 0.03% -0.14% -0.40% -0.24%
NZD 0.23% 0.24% 0.27% 0.46% 0.29% 0.40% 0.16%
CHF 0.06% 0.09% 0.10% 0.28% 0.12% 0.24% -0.16%

The heat map shows percentage changes of major currencies against each other. The base currency is picked from the left column, while the quote currency is picked from the top row. For example, if you pick the Euro from the left column and move along the horizontal line to the US Dollar, the percentage change displayed in the box will represent EUR (base)/USD (quote).

Source link

9 04, 2026

Pound Sterling to Dollar Forecast: GBP’s “Sentiment-driven Gains” see 1% Rally

By |2026-04-09T12:57:56+02:00April 9, 2026|Forex News, News|0 Comments


– Written by

The Pound to Dollar exchange rate (GBP/USD) surged above 1.3400 after a ceasefire agreement in the US-Iran conflict triggered a sharp drop in oil prices and a rebound in global risk appetite.

While the weaker dollar has boosted Sterling in the short term, analysts warn that uncertainty remains high and gains could face resistance near the 1.35 level.

GBP/USD Forecasts: Jump Above 1.3400

The Pound to Dollar (GBP/USD) exchange rate jumped above the 1.3400 level in Asia on Wednesday following the announcement of a ceasefire in the US-Iran conflict.

Just ahead of President Trump’s deadline, a deal brokered by Pakistan secured a 2-week ceasefire. In return, Iran pledged to allow transit to resume through the Strait of Hormuz.

Oil prices dropped sharply and there was a surge in risk appetite with a 2.0% gain for the FTSE 100 index while the dollar posted sharp losses with the dollar index (DXY) around 98.80 from close to 100 on Tuesday.

A dip in energy prices and a decline in bond yields will alleviate pressure on the UK economy, although both metrics are worse than before the conflict started.

Save on Your GBP/USD Transfer

Get better rates and lower fees on your next international money transfer.
Compare TorFX with top UK banks in seconds and see how much you could save.


Compare the Best GBP/USD Rates »

UoB commented; “While the short-term rally appears overdone, there is scope for GBP to rise to 1.3480.” There is also likely to be tough resistance on any approach to the 1.3500 area.

ING noted the importance of energy prices; “Risk assets are rallying as combatants in Iran pull back from the brink. The most impactful news overnight has been Iran’s announcement that it will allow safe passage for traffic through the Strait of Hormuz during this ceasefire.”

MUFG commented; “There are a lot of uncertainties that will persist but having said that, this of course is a step in the right direction and we see this as reducing considerably, over the short-term at least, the risk of a major risk-off and with it a strengthening of the dollar.

It added; “This outcome is a clear bearish outcome for the US dollar.”

According to National Australia Bank head of FX strategy Ray Attrill; “If the strategic waterway is reopened, we could be able to consolidate the risk-on rally that we’re seeing.”

He added; “But a lot has to happen in the next 14 days. Markets still need to proceed with a degree of scepticism.”

ING commented on the dollar; DXY rallied just over 3% through March. It has gapped lower today, and a further sell-off to 98.50 looks possible. However, there remains too much uncertainty to expect a full unwind of the March rally, and it is therefore premature to call for a break under 98.00.”

Rabobank noted the wide range of potential outcomes; “In terms of our macro and market scenarios, the latest news leans towards our base case of fighting being over by mid-April with a slow Hormuz reopening – and on US terms. Obviously, if this pause instead leads to more fighting, we move towards our other, more damaging scenarios.”

ING added; “Don’t expect a complete reversal of March trends, however.”

Like this piece? Please share with your friends and colleagues:


International Money Transfer? Ask our resident FX expert a money transfer question or try John’s new, free, no-obligation personal service! ,where he helps every step of the way,
ensuring you get the best exchange rates on your currency requirements.

TAGS: Pound Dollar Forecasts

Source link

9 04, 2026

USD/JPY Price Forecast: Symmetrical Triangle breakdown below 159.00 warrants more downside

By |2026-04-09T08:57:07+02:00April 9, 2026|Forex News, News|0 Comments

The USD/JPY pair trades 0.9% lower to near 158.20 during the European trading session on Wednesday. The pair faces intense selling pressure as the US Dollar (USD) underperforms across the board, following the announcement of a two-week ceasefire between the United States (US) and Iran.

US Dollar Price Today

The table below shows the percentage change of US Dollar (USD) against listed major currencies today. US Dollar was the weakest against the New Zealand Dollar.

USD EUR GBP JPY CAD AUD NZD CHF
USD -0.84% -0.96% -0.89% -0.28% -1.22% -1.62% -1.27%
EUR 0.84% -0.14% -0.06% 0.55% -0.36% -0.82% -0.45%
GBP 0.96% 0.14% 0.06% 0.70% -0.21% -0.66% -0.31%
JPY 0.89% 0.06% -0.06% 0.61% -0.30% -0.72% -0.38%
CAD 0.28% -0.55% -0.70% -0.61% -0.91% -1.32% -0.99%
AUD 1.22% 0.36% 0.21% 0.30% 0.91% -0.42% -0.09%
NZD 1.62% 0.82% 0.66% 0.72% 1.32% 0.42% 0.34%
CHF 1.27% 0.45% 0.31% 0.38% 0.99% 0.09% -0.34%

The heat map shows percentage changes of major currencies against each other. The base currency is picked from the left column, while the quote currency is picked from the top row. For example, if you pick the US Dollar from the left column and move along the horizontal line to the Japanese Yen, the percentage change displayed in the box will represent USD (base)/JPY (quote).

As of writing, the US Dollar Index (DXY), which tracks the Greenback’s value against six major currencies, is down 0.75% to near 98.75.

Earlier in the day, US President Donald Trump announced that he had suspended planned attacks on Iranian civilian infrastructure for two weeks, as Tehran agreed to the reopening of the Strait of Hormuz, a passage to almost 20% of global energy supply.

Meanwhile, disappeared hawkish Federal Reserve (Fed) bets due to anchoring global inflation expectations, following a temporary truce between the US and Iran, have also weighed on the US Dollar.

According to the CME FedWatch tool, traders have priced out hopes of an interest rate hike this year, a sharp turnaround from expectations of two hikes built after the war started.

USD/JPY technical analysis

USD/JPY plummets to near 158.20 during the day. The near-term trend of the pair has turned bearish, following a breakdown of the Symmetrical Triangle formation on a four-hour timeframe. Price now holds below the broken ascending support line from 157.46, reinforcing the loss of upside structure, while the 200-period EMA near 158.40 caps intraday rebounds as dynamic resistance.

The 14-day Relative Strength Index (RSI) has dropped to 28, entering oversold territory and signaling strong bearish momentum, though stretched conditions could slow immediate downside extension.

Initial resistance emerges at the confluence of the 200-period EMA and former support trend-line area around 158.40, with the descending trend line adding another barrier closer to 159.00. A recovery through 159.00 would open 159.60 as the next resistance band and neutralize the current downside pressure.

On the downside, minor support is seen at 157.50, and a clear break below this would confirm a deeper bearish phase toward 157.00. Oversold RSI suggests that any bounce into 158.40–159.00 is likely to be treated as a selling area while price holds below the descending trend line.

(The technical analysis of this story was written with the help of an AI tool.)

Risk sentiment FAQs

In the world of financial jargon the two widely used terms “risk-on” and “risk off” refer to the level of risk that investors are willing to stomach during the period referenced. In a “risk-on” market, investors are optimistic about the future and more willing to buy risky assets. In a “risk-off” market investors start to ‘play it safe’ because they are worried about the future, and therefore buy less risky assets that are more certain of bringing a return, even if it is relatively modest.

Typically, during periods of “risk-on”, stock markets will rise, most commodities – except Gold – will also gain in value, since they benefit from a positive growth outlook. The currencies of nations that are heavy commodity exporters strengthen because of increased demand, and Cryptocurrencies rise. In a “risk-off” market, Bonds go up – especially major government Bonds – Gold shines, and safe-haven currencies such as the Japanese Yen, Swiss Franc and US Dollar all benefit.

The Australian Dollar (AUD), the Canadian Dollar (CAD), the New Zealand Dollar (NZD) and minor FX like the Ruble (RUB) and the South African Rand (ZAR), all tend to rise in markets that are “risk-on”. This is because the economies of these currencies are heavily reliant on commodity exports for growth, and commodities tend to rise in price during risk-on periods. This is because investors foresee greater demand for raw materials in the future due to heightened economic activity.

The major currencies that tend to rise during periods of “risk-off” are the US Dollar (USD), the Japanese Yen (JPY) and the Swiss Franc (CHF). The US Dollar, because it is the world’s reserve currency, and because in times of crisis investors buy US government debt, which is seen as safe because the largest economy in the world is unlikely to default. The Yen, from increased demand for Japanese government bonds, because a high proportion are held by domestic investors who are unlikely to dump them – even in a crisis. The Swiss Franc, because strict Swiss banking laws offer investors enhanced capital protection.

Source link

9 04, 2026

Forecast update for EURUSD -08-04-2026.

By |2026-04-09T04:56:04+02:00April 9, 2026|Forex News, News|0 Comments

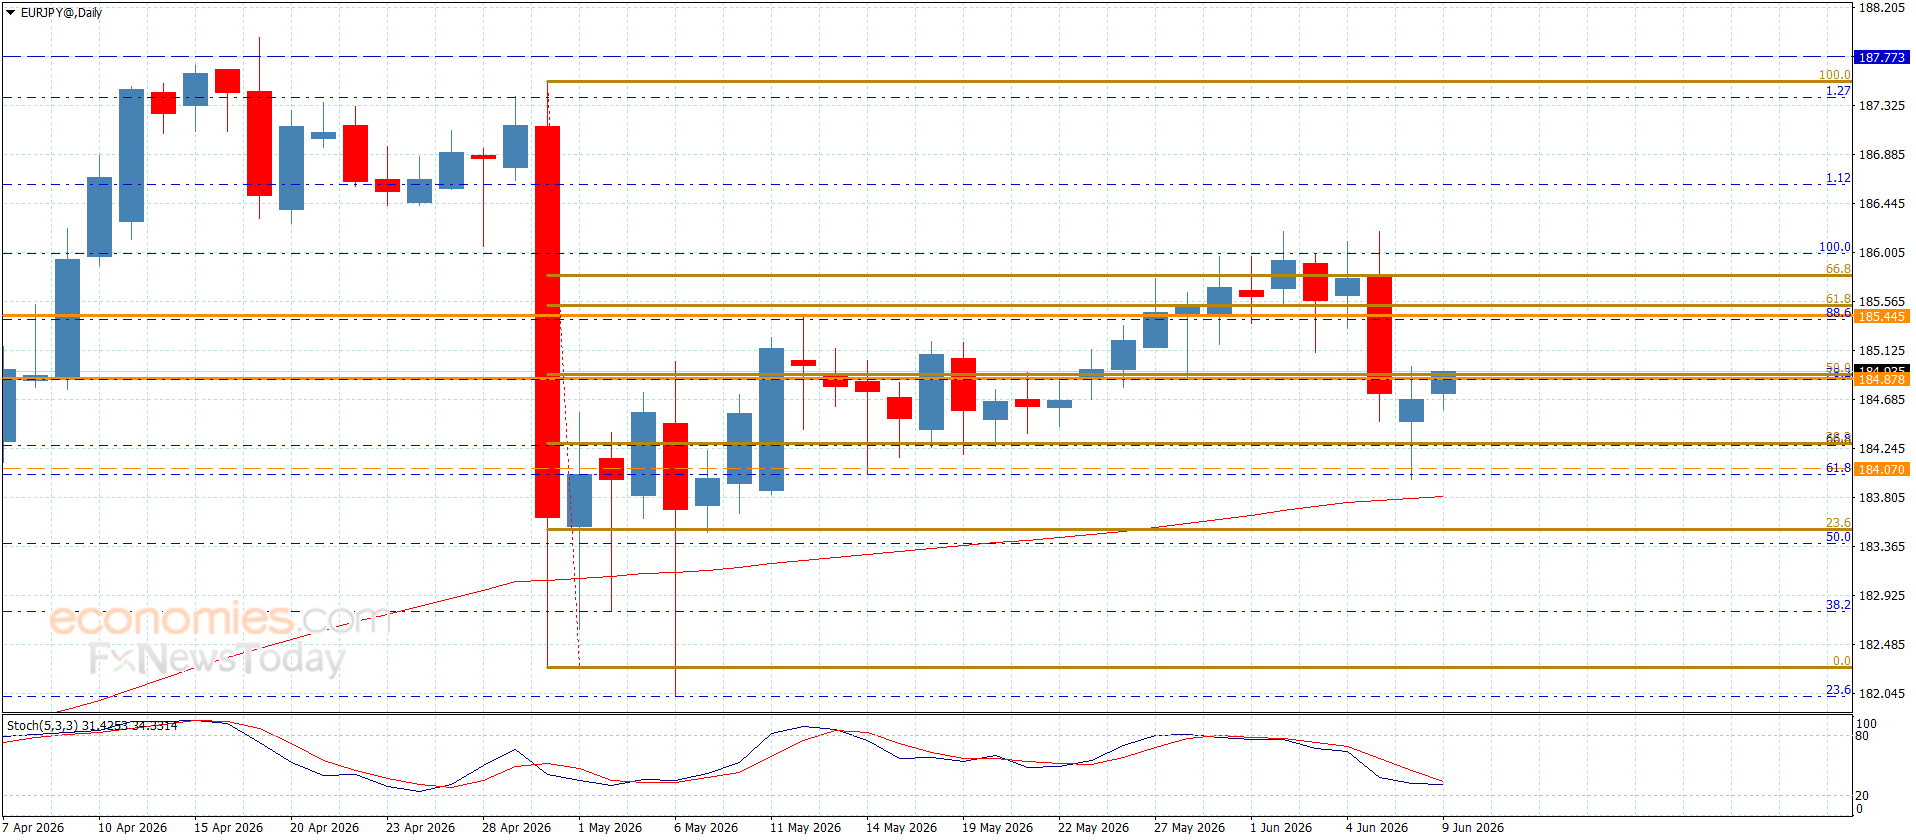
The EURJPY pair renewed the positive attempts since yesterday, due to the continuation of providing positive momentum by the main indicators by its rally above the initial resistance at 184.80, to test the barrier at 185.45 to bounce directly to settle near 184.90.


The price might be forced to provide mixed trading by its stability below 184.45, and there is a chance for forming bearish waves to target 184.20 and 183.70 level, while its success to surpass the barrier at 185.45 will open the way for forming strong bullish waves, to expect reaching 186.00 initially, reaching 186.65.


The expected trading range for today is between 184.40 and 185.45


Trend forecast: Fluctuated


Source link

9 04, 2026

The EURJPY attempts to recover the positivity– Forecast today – 8-4-2026

By |2026-04-09T00:55:09+02:00April 9, 2026|Forex News, News|0 Comments

The EURJPY pair renewed the positive attempts since yesterday, due to the continuation of providing positive momentum by the main indicators by its rally above the initial resistance at 184.80, to test the barrier at 185.45 to bounce directly to settle near 184.90.


The price might be forced to provide mixed trading by its stability below 184.45, and there is a chance for forming bearish waves to target 184.20 and 183.70 level, while its success to surpass the barrier at 185.45 will open the way for forming strong bullish waves, to expect reaching 186.00 initially, reaching 186.65.


The expected trading range for today is between 184.40 and 185.45


Trend forecast: Fluctuated


Source link

Go to Top