The main tag of Forex News Today Articles.
You can use the search box below to find what you need.
[wd_asp id=1]

12 04, 2026

EUR/GBP Forecast: Critical Support from Converging SMAs Faces Formidable 0.8750 Resistance

By |2026-04-12T13:17:12+02:00April 12, 2026|Forex News, News|0 Comments

BitcoinWorld

EUR/GBP Forecast: Critical Support from Converging SMAs Faces Formidable 0.8750 Resistance

The EUR/GBP currency pair currently demonstrates a technically significant configuration, with converging simple moving averages providing underlying support while formidable resistance caps gains below the 0.8750 psychological level. This critical juncture emerges as European and British economic policies diverge, creating a complex trading environment for currency analysts and institutional investors. Market participants now closely monitor whether technical support will hold against fundamental headwinds, potentially determining the cross’s directional bias for the coming trading sessions.

EUR/GBP Technical Analysis: The SMA Convergence Phenomenon

Technical analysts observe a notable convergence of multiple simple moving averages on the EUR/GBP daily chart. Specifically, the 50-day, 100-day, and 200-day SMAs have compressed within a historically narrow range, typically indicating reduced volatility and potential energy accumulation for a significant directional move. This convergence pattern often precedes substantial breakouts in currency markets. Consequently, traders interpret this compression as a coiled spring effect, where the pair builds energy before selecting a definitive trend direction.

Historical data reveals similar SMA convergence patterns preceded the EUR/GBP’s 2023 rally from 0.8500 to 0.8900. Currently, the 50-day SMA provides immediate dynamic support around 0.8680, while the 200-day SMA offers stronger foundational support near 0.8650. These technical levels create a multi-layered support zone that has defended against three separate bearish attempts during the past month. Market technicians emphasize that sustained trading above these converged averages would signal underlying strength, potentially enabling a challenge of higher resistance levels.

The 0.8750 Resistance Barrier: A Psychological and Technical Hurdle

The 0.8750 level represents more than just a numerical price point for the EUR/GBP pair. This resistance zone combines psychological significance with technical validation from previous market behavior. During the past six months, the cross has tested this level on four separate occasions, each time encountering substantial selling pressure that reversed gains. This repeated rejection establishes 0.8750 as a formidable technical ceiling that requires significant fundamental catalysts to overcome.

Market microstructure analysis reveals increased limit sell orders clustered around 0.8740-0.8760, creating an order book imbalance that reinforces this resistance zone. Additionally, options market data shows elevated implied volatility for strikes at 0.8750, indicating traders’ expectations for price containment below this level. The resistance confluence includes the 61.8% Fibonacci retracement level from the March 2024 decline, further strengthening its technical significance. Breaking above this barrier would require either substantial Euro strength or pronounced Pound weakness, supported by convincing volume expansion.

Fundamental Drivers: Diverging European and British Economic Policies

Beyond technical patterns, fundamental factors increasingly influence the EUR/GBP exchange rate trajectory. The European Central Bank maintains a cautiously dovish stance despite persistent inflation concerns, while the Bank of England confronts more pronounced stagflation risks. This policy divergence creates opposing forces on the currency pair. European economic indicators show modest improvement in manufacturing PMIs, yet consumer confidence remains subdued amid energy price volatility.

Conversely, British economic data reveals stronger-than-expected services sector activity but concerning retail sales contraction. This mixed fundamental backdrop explains the EUR/GBP’s recent range-bound behavior between 0.8650 and 0.8750. Political developments further complicate the outlook, with European parliamentary elections approaching and British fiscal policy announcements pending. Currency strategists note that interest rate differential expectations continue favoring the Pound, creating underlying headwinds for EUR/GBP appreciation despite technical support structures.

Historical Context and Comparative Analysis

Examining historical EUR/GBP behavior during similar technical configurations provides valuable context for current market conditions. The table below illustrates three previous instances of SMA convergence and subsequent price action:

Period SMA Convergence Range Subsequent Move Catalyst
Q3 2021 0.8520-0.8560 Breakout to 0.8720 ECB Policy Shift
Q1 2023 0.8780-0.8820 Breakdown to 0.8500 UK Inflation Surge
Q4 2023 0.8650-0.8680 Consolidation then Rally Brexit Deal Clarification

This historical analysis reveals that SMA convergence periods typically resolve within 4-8 weeks, with the direction determined by whichever fundamental catalyst emerges first. The current convergence appears most similar to the Q4 2023 pattern, suggesting potential for resolution within the coming month. Market participants monitor several key catalysts that could trigger the next directional move, including:

  • Central bank communications: Upcoming ECB and BoE meeting minutes
  • Inflation data: Eurozone and UK CPI releases scheduled for next week
  • Political developments: European election polls and UK fiscal announcements
  • Energy markets: Natural gas price fluctuations affecting both economies differently

Risk Assessment and Trading Implications

Professional traders approach the current EUR/GBP configuration with measured positioning, recognizing both opportunity and risk. The converging SMAs provide clearly defined support levels for potential long entries, with logical stop-loss placements below the 200-day average. However, the formidable 0.8750 resistance necessitates cautious profit-taking approaches for bullish positions. Risk-reward ratios currently favor range-trading strategies over directional bets until either support or resistance breaks convincingly.

Options market positioning reveals increased demand for strangle strategies, indicating expectations for heightened volatility following the current compression period. Institutional flow data shows balanced positioning between Euro and Pound exposures, suggesting uncertainty about the eventual breakout direction. Market technicians emphasize that a daily close above 0.8750 with expanding volume would invalidate the resistance thesis, potentially opening a path toward 0.8800. Conversely, a breakdown below the SMA confluence around 0.8650 would signal technical deterioration, targeting the 0.8600 psychological support level.

Expert Perspectives on the EUR/GBP Outlook

Leading currency analysts offer nuanced views on the EUR/GBP technical setup. Jane Wilson, Chief Currency Strategist at Global Forex Advisors, notes: “The SMA convergence provides meaningful support, but fundamental divergences between European and British economies create conflicting signals. We recommend patience until either technical level breaks with conviction.” Her assessment reflects the prevailing cautious sentiment among institutional traders.

Michael Chen, Head of Quantitative Research at EuroCapital Markets, adds: “Our statistical models show a 68% probability of range-bound trading between 0.8650 and 0.8750 over the next two weeks. However, volatility expectations increase substantially beyond that timeframe as seasonal liquidity patterns shift.” This quantitative perspective aligns with the technical compression narrative, suggesting impending directional resolution.

Conclusion

The EUR/GBP forecast presents a classic technical dilemma, with converging simple moving averages providing underlying support against the formidable 0.8750 resistance barrier. This configuration reflects broader market uncertainty about European and British economic trajectories. While technical patterns suggest potential for upward resolution, fundamental headwinds and historical resistance create substantial obstacles. Traders should monitor both technical levels and upcoming economic releases, particularly inflation data and central bank communications, which will likely determine whether support holds or resistance breaks. The current EUR/GBP setup exemplifies how technical and fundamental analysis must integrate for accurate currency forecasting in complex market environments.

FAQs

Q1: What does SMA convergence mean for the EUR/GBP pair?
SMA convergence occurs when multiple simple moving averages compress within a narrow price range, typically indicating reduced volatility and potential energy accumulation for a significant directional move. For EUR/GBP, this suggests the pair may be preparing for a substantial breakout.

Q2: Why is the 0.8750 level particularly significant resistance?
The 0.8750 level combines psychological importance with technical validation, having rejected price advances on multiple recent occasions. It also aligns with key Fibonacci retracement levels and hosts concentrated sell orders in the market microstructure.

Q3: How do fundamental factors currently affect EUR/GBP?
Diverging central bank policies between the ECB and BoE create opposing forces, with European cautiousness contrasting against British stagflation concerns. Economic data releases and political developments further influence the cross’s direction.

Q4: What historical patterns resemble the current EUR/GBP setup?
The Q4 2023 period showed similar SMA convergence around 0.8650-0.8680, which resolved with a rally following Brexit deal clarifications. This suggests potential for directional resolution within 4-8 weeks.

Q5: What trading strategies suit the current EUR/GBP configuration?
Range-trading approaches between 0.8650 support and 0.8750 resistance offer favorable risk-reward profiles currently. Breakout strategies with confirmation above resistance or below support may become appropriate once either level breaks with convincing volume.

This post EUR/GBP Forecast: Critical Support from Converging SMAs Faces Formidable 0.8750 Resistance first appeared on BitcoinWorld.

Source link

12 04, 2026

EUR/GBP Forecast: Critical Support from Converging SMAs Faces Formidable 0.8750 Resistance

By |2026-04-12T09:16:14+02:00April 12, 2026|Forex News, News|0 Comments

BitcoinWorld

EUR/GBP Forecast: Critical Support from Converging SMAs Faces Formidable 0.8750 Resistance

The EUR/GBP currency pair currently demonstrates a technically significant configuration, with converging simple moving averages providing underlying support while formidable resistance caps gains below the 0.8750 psychological level. This critical juncture emerges as European and British economic policies diverge, creating a complex trading environment for currency analysts and institutional investors. Market participants now closely monitor whether technical support will hold against fundamental headwinds, potentially determining the cross’s directional bias for the coming trading sessions.

EUR/GBP Technical Analysis: The SMA Convergence Phenomenon

Technical analysts observe a notable convergence of multiple simple moving averages on the EUR/GBP daily chart. Specifically, the 50-day, 100-day, and 200-day SMAs have compressed within a historically narrow range, typically indicating reduced volatility and potential energy accumulation for a significant directional move. This convergence pattern often precedes substantial breakouts in currency markets. Consequently, traders interpret this compression as a coiled spring effect, where the pair builds energy before selecting a definitive trend direction.

Historical data reveals similar SMA convergence patterns preceded the EUR/GBP’s 2023 rally from 0.8500 to 0.8900. Currently, the 50-day SMA provides immediate dynamic support around 0.8680, while the 200-day SMA offers stronger foundational support near 0.8650. These technical levels create a multi-layered support zone that has defended against three separate bearish attempts during the past month. Market technicians emphasize that sustained trading above these converged averages would signal underlying strength, potentially enabling a challenge of higher resistance levels.

The 0.8750 Resistance Barrier: A Psychological and Technical Hurdle

The 0.8750 level represents more than just a numerical price point for the EUR/GBP pair. This resistance zone combines psychological significance with technical validation from previous market behavior. During the past six months, the cross has tested this level on four separate occasions, each time encountering substantial selling pressure that reversed gains. This repeated rejection establishes 0.8750 as a formidable technical ceiling that requires significant fundamental catalysts to overcome.

Market microstructure analysis reveals increased limit sell orders clustered around 0.8740-0.8760, creating an order book imbalance that reinforces this resistance zone. Additionally, options market data shows elevated implied volatility for strikes at 0.8750, indicating traders’ expectations for price containment below this level. The resistance confluence includes the 61.8% Fibonacci retracement level from the March 2024 decline, further strengthening its technical significance. Breaking above this barrier would require either substantial Euro strength or pronounced Pound weakness, supported by convincing volume expansion.

Fundamental Drivers: Diverging European and British Economic Policies

Beyond technical patterns, fundamental factors increasingly influence the EUR/GBP exchange rate trajectory. The European Central Bank maintains a cautiously dovish stance despite persistent inflation concerns, while the Bank of England confronts more pronounced stagflation risks. This policy divergence creates opposing forces on the currency pair. European economic indicators show modest improvement in manufacturing PMIs, yet consumer confidence remains subdued amid energy price volatility.

Conversely, British economic data reveals stronger-than-expected services sector activity but concerning retail sales contraction. This mixed fundamental backdrop explains the EUR/GBP’s recent range-bound behavior between 0.8650 and 0.8750. Political developments further complicate the outlook, with European parliamentary elections approaching and British fiscal policy announcements pending. Currency strategists note that interest rate differential expectations continue favoring the Pound, creating underlying headwinds for EUR/GBP appreciation despite technical support structures.

Historical Context and Comparative Analysis

Examining historical EUR/GBP behavior during similar technical configurations provides valuable context for current market conditions. The table below illustrates three previous instances of SMA convergence and subsequent price action:

Period SMA Convergence Range Subsequent Move Catalyst
Q3 2021 0.8520-0.8560 Breakout to 0.8720 ECB Policy Shift
Q1 2023 0.8780-0.8820 Breakdown to 0.8500 UK Inflation Surge
Q4 2023 0.8650-0.8680 Consolidation then Rally Brexit Deal Clarification

This historical analysis reveals that SMA convergence periods typically resolve within 4-8 weeks, with the direction determined by whichever fundamental catalyst emerges first. The current convergence appears most similar to the Q4 2023 pattern, suggesting potential for resolution within the coming month. Market participants monitor several key catalysts that could trigger the next directional move, including:

  • Central bank communications: Upcoming ECB and BoE meeting minutes
  • Inflation Eurozone and UK CPI releases scheduled for next week
  • Political developments: European election polls and UK fiscal announcements
  • Energy markets: Natural gas price fluctuations affecting both economies differently

Risk Assessment and Trading Implications

Professional traders approach the current EUR/GBP configuration with measured positioning, recognizing both opportunity and risk. The converging SMAs provide clearly defined support levels for potential long entries, with logical stop-loss placements below the 200-day average. However, the formidable 0.8750 resistance necessitates cautious profit-taking approaches for bullish positions. Risk-reward ratios currently favor range-trading strategies over directional bets until either support or resistance breaks convincingly.

Options market positioning reveals increased demand for strangle strategies, indicating expectations for heightened volatility following the current compression period. Institutional flow data shows balanced positioning between Euro and Pound exposures, suggesting uncertainty about the eventual breakout direction. Market technicians emphasize that a daily close above 0.8750 with expanding volume would invalidate the resistance thesis, potentially opening a path toward 0.8800. Conversely, a breakdown below the SMA confluence around 0.8650 would signal technical deterioration, targeting the 0.8600 psychological support level.

Expert Perspectives on the EUR/GBP Outlook

Leading currency analysts offer nuanced views on the EUR/GBP technical setup. Jane Wilson, Chief Currency Strategist at Global Forex Advisors, notes: “The SMA convergence provides meaningful support, but fundamental divergences between European and British economies create conflicting signals. We recommend patience until either technical level breaks with conviction.” Her assessment reflects the prevailing cautious sentiment among institutional traders.

Michael Chen, Head of Quantitative Research at EuroCapital Markets, adds: “Our statistical models show a 68% probability of range-bound trading between 0.8650 and 0.8750 over the next two weeks. However, volatility expectations increase substantially beyond that timeframe as seasonal liquidity patterns shift.” This quantitative perspective aligns with the technical compression narrative, suggesting impending directional resolution.

Conclusion

The EUR/GBP forecast presents a classic technical dilemma, with converging simple moving averages providing underlying support against the formidable 0.8750 resistance barrier. This configuration reflects broader market uncertainty about European and British economic trajectories. While technical patterns suggest potential for upward resolution, fundamental headwinds and historical resistance create substantial obstacles. Traders should monitor both technical levels and upcoming economic releases, particularly inflation data and central bank communications, which will likely determine whether support holds or resistance breaks. The current EUR/GBP setup exemplifies how technical and fundamental analysis must integrate for accurate currency forecasting in complex market environments.

FAQs

Q1: What does SMA convergence mean for the EUR/GBP pair?
SMA convergence occurs when multiple simple moving averages compress within a narrow price range, typically indicating reduced volatility and potential energy accumulation for a significant directional move. For EUR/GBP, this suggests the pair may be preparing for a substantial breakout.

Q2: Why is the 0.8750 level particularly significant resistance?
The 0.8750 level combines psychological importance with technical validation, having rejected price advances on multiple recent occasions. It also aligns with key Fibonacci retracement levels and hosts concentrated sell orders in the market microstructure.

Q3: How do fundamental factors currently affect EUR/GBP?
Diverging central bank policies between the ECB and BoE create opposing forces, with European cautiousness contrasting against British stagflation concerns. Economic data releases and political developments further influence the cross’s direction.

Q4: What historical patterns resemble the current EUR/GBP setup?
The Q4 2023 period showed similar SMA convergence around 0.8650-0.8680, which resolved with a rally following Brexit deal clarifications. This suggests potential for directional resolution within 4-8 weeks.

Q5: What trading strategies suit the current EUR/GBP configuration?
Range-trading approaches between 0.8650 support and 0.8750 resistance offer favorable risk-reward profiles currently. Breakout strategies with confirmation above resistance or below support may become appropriate once either level breaks with convincing volume.

This post EUR/GBP Forecast: Critical Support from Converging SMAs Faces Formidable 0.8750 Resistance first appeared on BitcoinWorld.

Source link

11 04, 2026

U.S. Dollar Pulls Back As Inflation Rate Jumps to 3.3%: Analysis For EUR/USD, GBP/USD, USD/CAD, USD/JPY

By |2026-04-11T21:12:44+02:00April 11, 2026|Forex News, News|0 Comments

Scan QR code to install app

Important DisclaimersFXEmpire is owned and operated by Empire Media Network LTD., Company Registration Number 514641786, registered at 7 Jabotinsky Road, Ramat Gan 5252007, Israel. The content provided on this website includes general news and publications, our personal analysis and opinions, and materials provided by third parties. This content is intended for educational and research purposes only. It does not constitute, and should not be interpreted as, a recommendation or advice to take any action, including making any investment or purchasing any product. Before making any financial decision, you should conduct your own due diligence, exercise your own discretion, and consult with competent advisors. The content on this website is not personally directed to you, and we do not take into account your individual financial situation or needs. The information contained on this website is not necessarily provided in real time, nor is it guaranteed to be accurate. Prices displayed may be provided by market makers and not by exchanges. Any trading or other financial decision you make is entirely your own responsibility, and you must not rely solely on any information provided through the website. FXEmpire does not provide any warranty regarding the accuracy, completeness, or reliability of any information contained on the website and shall bear no responsibility for any trading losses you may incur as a result of using such information. The website may include advertisements and other promotional content. FXEmpire may receive compensation from third parties in connection with such content. FXEmpire does not endorse, recommend, or assume responsibility for the use of any third-party services or websites. Empire Media Network LTD., its employees, officers, subsidiaries, and affiliates shall not be liable for any loss or damage resulting from your use of the website or reliance on the information provided herein.Risk DisclaimersThis website contains information about cryptocurrencies, contracts for difference (CFDs), and other financial instruments, as well as about brokers, exchanges, and other entities trading in such instruments. Both cryptocurrencies and CFDs are complex instruments and involve a high risk of losing money. You should carefully consider whether you understand how these instruments work and whether you can afford to take the high risk of losing your money. FX Empire encourages you to conduct your own research before making any investment decision and to avoid investing in any financial instrument unless you fully understand how it works and the risks involved.

Source link

11 04, 2026

EUR/USD Price Forecast: Critical Analysis Reveals Hesitant Bears as Breakout Above 1.1670 Remains in Play

By |2026-04-11T17:11:45+02:00April 11, 2026|Forex News, News|0 Comments

BitcoinWorld

EUR/USD Price Forecast: Critical Analysis Reveals Hesitant Bears as Breakout Above 1.1670 Remains in Play

Financial markets in London and New York observed cautious trading activity on Thursday, December 4, 2025, as the EUR/USD currency pair approached a critical technical juncture. Technical analysis reveals that bearish momentum appears hesitant despite recent pressure, with a potential breakout above the 1.1670 resistance level remaining firmly in play according to multiple chart patterns and indicators.

EUR/USD Price Forecast: Technical Landscape Analysis

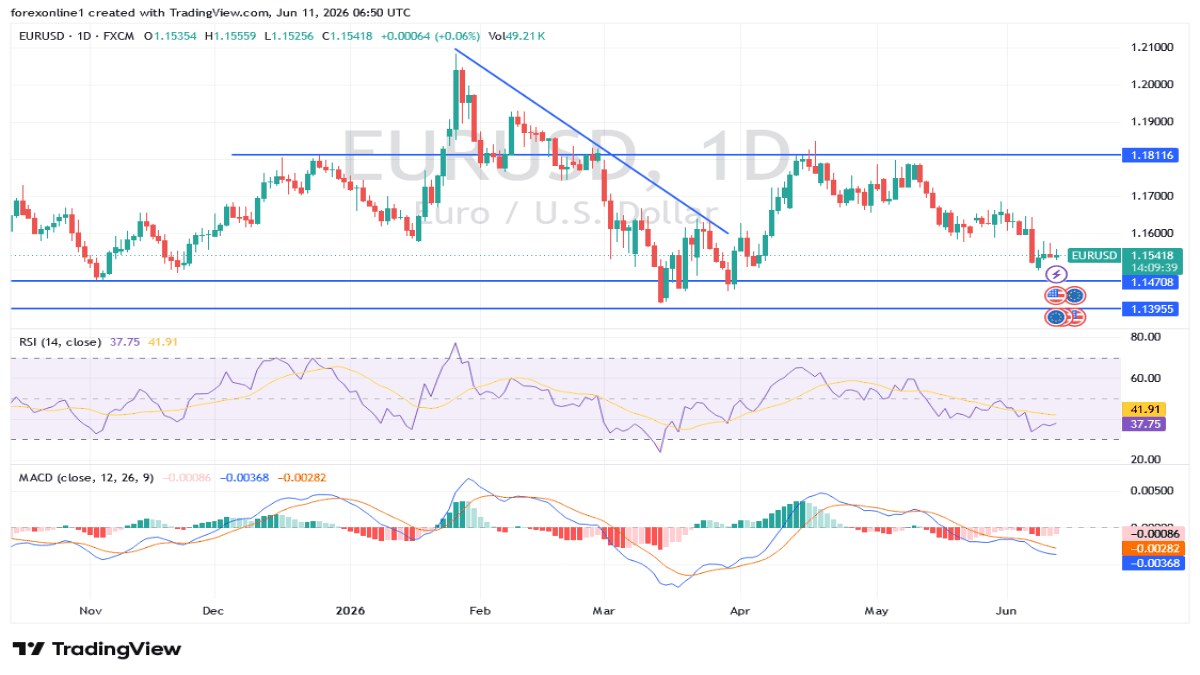
Market analysts currently examine the EUR/USD pair through multiple technical frameworks. The currency pair recently tested support near 1.1620 before rebounding toward the 1.1650 region. Consequently, this price action suggests underlying strength despite apparent bearish pressure. Furthermore, the 50-day moving average provides dynamic support around 1.1635, creating a confluence zone with horizontal support levels.

Several key technical elements merit attention in the current EUR/USD forecast. First, the Relative Strength Index (RSI) currently reads 48, indicating neutral momentum without extreme overbought or oversold conditions. Second, trading volume patterns show declining volume during recent pullbacks, suggesting weak bearish conviction. Third, Fibonacci retracement levels from the October swing high to November low identify 1.1670 as the 61.8% retracement level, a historically significant technical barrier.

Recent price action reveals important characteristics for traders. Specifically, the pair has established higher lows since mid-November, forming a potential ascending triangle pattern. Meanwhile, daily candlestick patterns show rejection of lower prices near 1.1620 on three separate occasions. These technical developments collectively suggest that bears lack sufficient momentum to drive prices significantly lower at present.

Market Context and Fundamental Backdrop

The current EUR/USD price forecast operates within a complex fundamental environment. European Central Bank policy decisions continue to influence euro dynamics, particularly regarding interest rate differentials with the Federal Reserve. Additionally, economic data releases from both regions create intermittent volatility spikes that technical analysis must contextualize.

Recent economic indicators provide crucial background for the EUR/USD forecast. Eurozone inflation data showed modest improvement last week, reducing immediate pressure for aggressive ECB easing. Conversely, U.S. employment figures demonstrated resilience, supporting the dollar’s underlying strength. These competing fundamental forces create the technical indecision currently visible on price charts.

Expert Analysis and Institutional Perspectives

Major financial institutions offer nuanced views on the EUR/USD outlook. Goldman Sachs analysts note that positioning data reveals net short euro positions approaching extreme levels, potentially limiting further downside. Meanwhile, JPMorgan’s technical team identifies 1.1670 as a “make or break” level for near-term direction. Bloomberg Intelligence reports that options market pricing shows balanced risk perceptions around current levels.

Historical precedent provides additional context for the current EUR/USD forecast. During similar technical setups in 2023, the pair frequently experienced false breakdowns before resuming broader trends. Statistical analysis of past breakouts above the 1.1670 level reveals an average follow-through of approximately 150 pips over subsequent sessions. This historical data informs current risk-reward calculations for traders.

Technical Indicators and Chart Pattern Interpretation

Multiple technical indicators converge around the 1.1670 level in the EUR/USD forecast. Bollinger Bands show contraction, indicating reduced volatility and potential for an impending expansion. The Average Directional Index (ADX) reads 22, suggesting a non-trending market environment that favors range-bound strategies. Meanwhile, moving average convergence divergence (MACD) shows a bullish crossover on the four-hour chart, providing short-term momentum signals.

Key resistance and support levels structure the current trading range:

  • Immediate Resistance: 1.1670 (horizontal resistance and Fibonacci level)
  • Secondary Resistance: 1.1700 (psychological level and previous swing high)
  • Primary Support: 1.1620 (recent swing low and volume node)
  • Secondary Support: 1.1585 (200-day moving average and October low)

Chart patterns suggest several potential scenarios for the EUR/USD forecast. The ascending triangle formation would complete with a breakout above 1.1670, projecting measured moves toward 1.1750. Alternatively, a breakdown below 1.1620 would invalidate the bullish pattern structure. Volume profile analysis identifies high-volume nodes between 1.1640 and 1.1660, indicating price acceptance in this region.

Risk Factors and Market Sentiment Indicators

Several risk factors could alter the current EUR/USD forecast trajectory. Geopolitical developments in Eastern Europe continue to influence euro sentiment, particularly regarding energy market stability. Additionally, unexpected central bank communications from either the ECB or Fed could override technical considerations. Market sentiment indicators show retail traders maintaining net long positions, while institutional positioning appears more balanced.

The Commitment of Traders (COT) report provides positioning context for the EUR/USD forecast. Commercial hedgers increased long euro positions recently, while leveraged funds reduced net short exposure. This positioning shift suggests professional money flows may be anticipating euro strength. Open interest in EUR/USD futures contracts remains elevated near yearly highs, indicating sustained market participation.

Trading Implications and Strategy Considerations

The current EUR/USD forecast presents distinct trading implications across different timeframes. Swing traders monitor the 1.1670 breakout level for potential trend continuation signals. Day traders focus on intraday support and resistance reactions, particularly around European and U.S. session overlaps. Position traders consider broader fundamental developments while respecting technical boundaries.

Risk management parameters derive naturally from the technical landscape. Stop-loss placements below 1.1620 protect against pattern invalidation, while breakout scenarios above 1.1670 warrant trailing stop methodologies. Position sizing should account for the potential volatility expansion following a confirmed breakout or breakdown. Correlation analysis with other dollar pairs provides additional confirmation signals for directional bias.

Seasonal patterns offer supplementary context for the EUR/USD forecast. Historically, December trading often features reduced liquidity but increased volatility during year-end positioning adjustments. The pair has shown positive December returns in seven of the past ten years, though past performance never guarantees future results. This seasonal tendency may influence institutional behavior around current technical levels.

Conclusion

The EUR/USD price forecast reveals a market at a critical technical juncture with bears demonstrating hesitation despite apparent pressure. The 1.1670 resistance level represents a decisive barrier whose breach would signal renewed bullish momentum and potentially trigger algorithmic buying programs. Technical indicators suggest balanced conditions that favor breakout scenarios in either direction, though chart patterns lean cautiously bullish. Market participants should monitor price action around identified key levels while maintaining flexible risk parameters that acknowledge both breakout potential and false signal risks inherent in current market conditions.

FAQs

Q1: What makes the 1.1670 level particularly significant in the current EUR/USD forecast?
The 1.1670 level represents a confluence of technical factors including a key Fibonacci retracement level (61.8%), previous swing high resistance, and a psychological round number. Multiple tests of this level increase its technical significance for determining near-term direction.

Q2: How does current market volatility affect the EUR/USD breakout potential?
Reduced volatility, as indicated by contracting Bollinger Bands, typically precedes volatility expansion and directional moves. The current low-volatility environment suggests an impending resolution of the trading range, though the direction remains uncertain until confirmed by price action.

Q3: What fundamental factors could override the technical EUR/USD forecast?
Unexpected central bank policy shifts, particularly from the ECB or Federal Reserve, could override technical considerations. Additionally, significant geopolitical developments or extreme economic data surprises could drive price action outside technically defined ranges.

Q4: How reliable are chart patterns like the potential ascending triangle in current market conditions?
Chart patterns provide probabilistic frameworks rather than certain predictions. The potential ascending triangle pattern suggests bullish resolution but requires confirmation above 1.1670 with accompanying volume. False breakouts remain common in low-volatility environments.

Q5: What timeframes are most relevant for the current EUR/USD analysis?
The analysis applies across multiple timeframes but finds particular relevance on daily and four-hour charts for swing trading perspectives. Intraday traders might focus on hourly charts for entry precision, while longer-term investors should consider weekly charts for broader context.

This post EUR/USD Price Forecast: Critical Analysis Reveals Hesitant Bears as Breakout Above 1.1670 Remains in Play first appeared on BitcoinWorld.

Source link

11 04, 2026

GBP/JPY Forecast: Critical Bullish Breakout Looms Above Formidable 214.00-215.00 Resistance

By |2026-04-11T13:10:03+02:00April 11, 2026|Forex News, News|0 Comments


GBP/JPY Forecast: Critical Bullish Breakout Looms Above Formidable 214.00-215.00 Resistance


Skip to content


Source link

11 04, 2026

GBP/USD Forecast: Technicals turn slightly bullish for Pound Sterling amid Mideast drama

By |2026-04-11T09:09:08+02:00April 11, 2026|Forex News, News|0 Comments

The Pound Sterling (GBP) staged a stellar recovery from near four-month lows against the US Dollar (USD) and clinched two-month highs just shy of the 1.3500 threshold.

Pound Sterling bulls returned with a bang

The week started with the domination of safe-haven flows and the risk-sensitive Pound Sterling in multi-month troughs.

Markets remained nervous as they weighed US President Donald Trump’s social media threat posted on Sunday, in which he ratcheted up pressure on Iran, while extending the deadline to reopen the Strait of Hormuz to Tuesday at 8 PM Eastern Time or Wednesday 00:00 GMT.

On the other side, Iran mulled a “much more devastating” retaliation if civilian targets are hit.  Against the deepening escalation in the Middle East conflict, investors scurried for safety in the world’s reserve currency, the USD, once again, extending its recovery.

The Greenback also capitalized on the increased expectations about the US Federal Reserve’s (Fed) interest rate outlook, especially after a blockbuster February jobs report.

Data released by the Bureau of Labor Statistics (BLS) on Friday showed that US Nonfarm Payrolls jumped by 178K in March, against the consensus of +60K and a 133K drop recorded in February (revised down from -92K). The Unemployment Rate unexpectedly fell to 4.3%, vs. 4.4% consensus and 4.4% prior.

However, the GBP/USD showed some resilience and embarked upon a recovery as the USD failed to sustain at higher levels against its major counterparts. The tide entirely turned against the buck following Trump’s TACO trade early Wednesday, which provided legs to the GBP/USD rebound.

Risk-on flows returned with a bang after the United States (US) and Iran brokered a two-week ceasefire and agreed to enter negotiations on April 10, potentially paving the way for a lasting peace in the Middle East and resumption of Gulf oil and gas exports through the vital Strait of Hormuz.

In light of the de-escalation, the currency pair stretched higher and reached the highest levels in two months just below 1.3500.

However, GBP/USD sellers quickly jumped in and triggered a sharp retracement amid investors’ concerns over whether Trump would stick to the ceasefire agreement ahead of Friday’s negotiations on the ten-point proposal.

The Iranian proposal submitted to the US on Wednesday included maximalist demands that the Trump administration previously rejected.

The Greenback regained its safe-haven bid in the latter part of the week as doubts about the Mideast ceasefire countered the dovish Minutes of the Fed’s March monetary policy meeting.

Israel continued its attacks on the Iran-aligned militant group, Hezbollah, in Lebanon. Iranian Foreign Minister Abbas Araghchi noted that the announcement said that the ceasefire included Lebanon.

On Friday, Israeli Prime Minister Benjamin Netanyahu said that there is “no ceasefire in Lebanon” and Israel would continue “to strike Hezbollah with full force”. Late Thursday, Netanyahu had issued an instruction to start direct negotiations with Lebanon “as soon as possible,” per the Washington Post.

Also, sentiment remained fragile and kept the pair on the back foot ahead of the highly-anticipated US-Iran peace talks and the top-tier Consumer Price Index (CPI) report from the US.

The BLS reported ahead of the weekend that annual inflation in the US, as measured by the change in the CPI, climbed to 3.3% in March from 2.4% in February. This print came in line with the market expectation. Additionally, the core CPI, which excludes volatile food and energy prices, rose 0.2% on a monthly basis, compared to analysts’ estimate of 0.3%. The USD struggled to gather strength following these data and allowed GBP/USD to remain in the upper half of its weekly range.

Middle East updates and Bailey’s speech on tap

After an eventful week, the focus will continue to remain on any signs of de-escalation in the Middle East conflict following Friday’s US-Iran negotiations.

The economic calendar is relatively light in the US, while the UK docket has several appearances of the Bank of England (BoE) Governor Andrew Bailey throughout the week.

Monday is devoid of any high-impact macro releases, while Tuesday features the US ADP four-week Employment Change and Producer Price Index (PPI) data.

Bailey is scheduled to participate in a moderated discussion about the future of central banking at Columbia University, in New York, later on Tuesday. A bunch of Fed policymakers are also lined up that day.

Bailey will speak on Wednesday at two separate events. On Thursday, the UK monthly growth and industrial numbers will be reported, followed by the US weekly Jobless Claims data.

The Fed and BoE officials are set to deliver their speeches on Friday, filling up the data-dry calendar.

Beyond the statistics and speeches from the central bank officials, developments on the US-Iran war will remain the main market driver.

GBP/USD technical analysis

GBP/USD daily chart

In the daily chart, GBP/USD trades at 1.3468, holding a constructive bullish tone as spot sits above the 20-, 50-, 100- and 200-day simple moving averages clustered between roughly 1.3324 and 1.3435. This stacked moving average support suggests the recent recovery remains intact, while the Relative Strength Index (14) around 58 leans positive without yet flagging overbought conditions, hinting that buyers still retain control in the near term.

On the topside, initial resistance emerges at the horizontal barrier near 1.3555, ahead of a stronger cap at 1.3700, where sellers may look to fade extended advances. On the downside, immediate protection is provided by the tight cluster of the 50-day SMA at 1.3435, the 100-day SMA at 1.3434 and the 200-day SMA at 1.3413, with the 20-day SMA lower at 1.3324 before more substantial horizontal support at 1.3221, 1.3160 and 1.3034.

(The technical analysis of this story was written with the help of an AI tool.)

Risk sentiment FAQs

In the world of financial jargon the two widely used terms “risk-on” and “risk off” refer to the level of risk that investors are willing to stomach during the period referenced. In a “risk-on” market, investors are optimistic about the future and more willing to buy risky assets. In a “risk-off” market investors start to ‘play it safe’ because they are worried about the future, and therefore buy less risky assets that are more certain of bringing a return, even if it is relatively modest.

Typically, during periods of “risk-on”, stock markets will rise, most commodities – except Gold – will also gain in value, since they benefit from a positive growth outlook. The currencies of nations that are heavy commodity exporters strengthen because of increased demand, and Cryptocurrencies rise. In a “risk-off” market, Bonds go up – especially major government Bonds – Gold shines, and safe-haven currencies such as the Japanese Yen, Swiss Franc and US Dollar all benefit.

The Australian Dollar (AUD), the Canadian Dollar (CAD), the New Zealand Dollar (NZD) and minor FX like the Ruble (RUB) and the South African Rand (ZAR), all tend to rise in markets that are “risk-on”. This is because the economies of these currencies are heavily reliant on commodity exports for growth, and commodities tend to rise in price during risk-on periods. This is because investors foresee greater demand for raw materials in the future due to heightened economic activity.

The major currencies that tend to rise during periods of “risk-off” are the US Dollar (USD), the Japanese Yen (JPY) and the Swiss Franc (CHF). The US Dollar, because it is the world’s reserve currency, and because in times of crisis investors buy US government debt, which is seen as safe because the largest economy in the world is unlikely to default. The Yen, from increased demand for Japanese government bonds, because a high proportion are held by domestic investors who are unlikely to dump them – even in a crisis. The Swiss Franc, because strict Swiss banking laws offer investors enhanced capital protection.

Source link

11 04, 2026

USD/JPY Forex Forecast 10/04: Pressures 160 (Video&Chart)

By |2026-04-11T05:08:05+02:00April 11, 2026|Forex News, News|0 Comments

  • The US dollar continues to bounce against the yen, waiting to see if we can break higher.

  • The US dollar has rallied a bit against the Japanese yen during trading on Thursday as we continue to see a lot of noise in the interest rate environment.

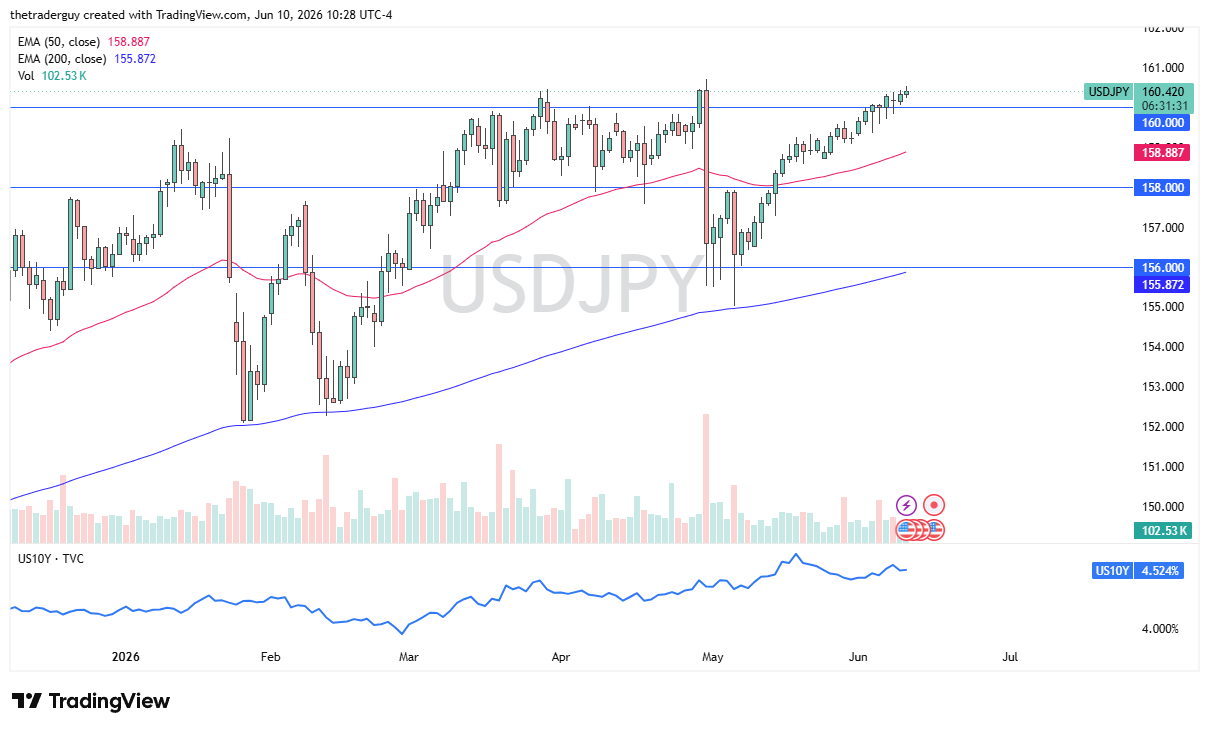
  • The 158-yen level on the bottom of the range and the 160-yen level on the top is how I see the market right now.

Obviously, there is a lot going on that could greatly influence what happens next, not the least of which of course would be any ceasefire talks in the Middle East, but I would also watch very closely the 10-year yield in both countries, but specifically the United States.

The longer it stays above 4.3% the more likely it is the US dollar breaks out. It has fallen back below there during this session so we will see how that plays out. I suspect probably what you are going to see more than anything else is a lot of volatility over the next couple of days because we have those ceasefire talks on Friday in Islamabad, so we will have to see how that plays out.

Market Volatility and Key Resistance

It certainly looks like the USD/JPY market is pricing in some type of good news when I look at other assets. So, I anticipate that the US dollar may weaken a bit but ultimately this is a market that I also pay close attention to the 160.4-yen level because that would be an area that if we could break above it could really spell serious trouble for the Japanese yen.

That is a 1990 high that the US dollar made against the Japanese yen and if we were to break that, things could get ugly really fast. All things being equal, I do think this is a scenario where traders are going to have to be very patient, but I do think it also remains a buy-on-the-dip type of scenario as clearly the interest rate differential will continue to favor the US dollar.

Again, I think the 158-yen level continues to be a major support for the greenback right now and I do like the idea of buying closer to that, in fact I did overnight. But you can see just how noisy this market might end up being and with that being the case you do have to be somewhat cautious with your position sizing, but ultimately, I believe this is a market that will threaten that 160.4-yen level which is so important.

If we were to break down below the 50-day EMA then that obviously would be a major breakout just waiting to happen and, in that way, the Japanese yen probably strengthens across the board for not only moving against US dollar but maybe other currencies. The 156-yen level at that point for me would be the next support level.

Want to trade our USD/JPY forex analysis and predictions? Here’s a list of forex brokers in Japan to check out.

Christopher Lewis has been trading Forex and has over 20 years experience in financial markets. Chris has been a regular contributor to Daily Forex since the early days of the site. He writes about Forex for several online publications, including FX Empire, Investing.com, and his own site, aptly named The Trader Guy. Chris favours technical analysis methods to identify his trades and likes to trade equity indices and commodities as well as Forex. He favours a longer-term trading style, and his trades often last for days or weeks.

Source link

11 04, 2026

Forecast update for EURUSD -10-04-2026.

By |2026-04-11T01:07:01+02:00April 11, 2026|Forex News, News|0 Comments

The CADJPY ended the bullish corrective rally by facing a strong barrier at 210.65, as it represents %100 Fibonacci extension level, forcing it to form sideways trading by its stability near 201.40.


The stability below the current barrier and stochastic attempt to provide negative momentum will increase the chances of forming bearish waves, to attempt to reach 200.70 and 200.25, while breaching the barrier will ease the mission of recording extra gains that might extend towards 212.20 initially.


The expected trading range for today is between 200.70 and 201.60


Trend forecast: Bearish


Source link

10 04, 2026

GBP/JPY Price Forecast: Bulls eye breakout above 214.00-215.00 resistance

By |2026-04-10T21:05:58+02:00April 10, 2026|Forex News, News|0 Comments

GBP/JPY edges higher on Friday, extending gains for a fifth straight day as the Japanese Yen (JPY) remains on the defensive against most of the major peers. Elevated Oil prices continue to weigh on the Yen, given Japan’s status as a major net importer.

Meanwhile, the British Pound (GBP), a cyclical currency, is drawing support from a modest improvement in risk sentiment as earlier concerns over the durability of the US-Iran ceasefire ease, with traders now looking ahead to upcoming negotiations in Pakistan over the weekend.

At the time of writing, the cross is trading around 214.12, its highest level since February 9. Apart from near-term price action, the wide interest rate differential between the UK and Japan remains a key driver supporting the cross.

From a technical perspective, GBP/JPY maintains a bullish bias, with shallow pullbacks within a broader uptrend. The latest leg higher follows a rebound from the 100-day Simple Moving Average (SMA) at 210.68, which acts as reliable support and continues to cushion the downside.

Price is now testing the 214.00-215.00 zone, which has capped upside attempts since mid-January. A sustained break above this area would strengthen bullish momentum and open the door for further gains.

The Relative Strength Index (RSI) near 63 points to strengthening bullish momentum without yet signaling overbought conditions. Meanwhile, the Moving Average Convergence Divergence (MACD) has turned positive again, suggesting that upside momentum is rebuilding after the recent consolidation phase.

On the downside, initial support is reinforced by the 100-day SMA at 210.68, which serves as the first line of defense should GBP/JPY correct lower. A deeper pullback would likely look toward the 200-day SMA at 205.52 as a more substantial structural floor, where longer-term buyers could re-emerge to protect the broader uptrend.

Japanese Yen Price Today

The table below shows the percentage change of Japanese Yen (JPY) against listed major currencies today. Japanese Yen was the strongest against the Australian Dollar.

USD EUR GBP JPY CAD AUD NZD CHF
USD -0.14% -0.15% 0.08% 0.08% 0.09% 0.13% -0.24%
EUR 0.14% -0.01% 0.24% 0.23% 0.23% 0.28% -0.11%
GBP 0.15% 0.00% 0.26% 0.25% 0.23% 0.29% -0.11%
JPY -0.08% -0.24% -0.26% -0.03% 0.01% 0.00% -0.37%
CAD -0.08% -0.23% -0.25% 0.03% 0.01% 0.06% -0.33%
AUD -0.09% -0.23% -0.23% -0.01% -0.01% 0.04% -0.34%
NZD -0.13% -0.28% -0.29% -0.01% -0.06% -0.04% -0.39%
CHF 0.24% 0.11% 0.11% 0.37% 0.33% 0.34% 0.39%

The heat map shows percentage changes of major currencies against each other. The base currency is picked from the left column, while the quote currency is picked from the top row. For example, if you pick the Japanese Yen from the left column and move along the horizontal line to the US Dollar, the percentage change displayed in the box will represent JPY (base)/USD (quote).

Source link

10 04, 2026

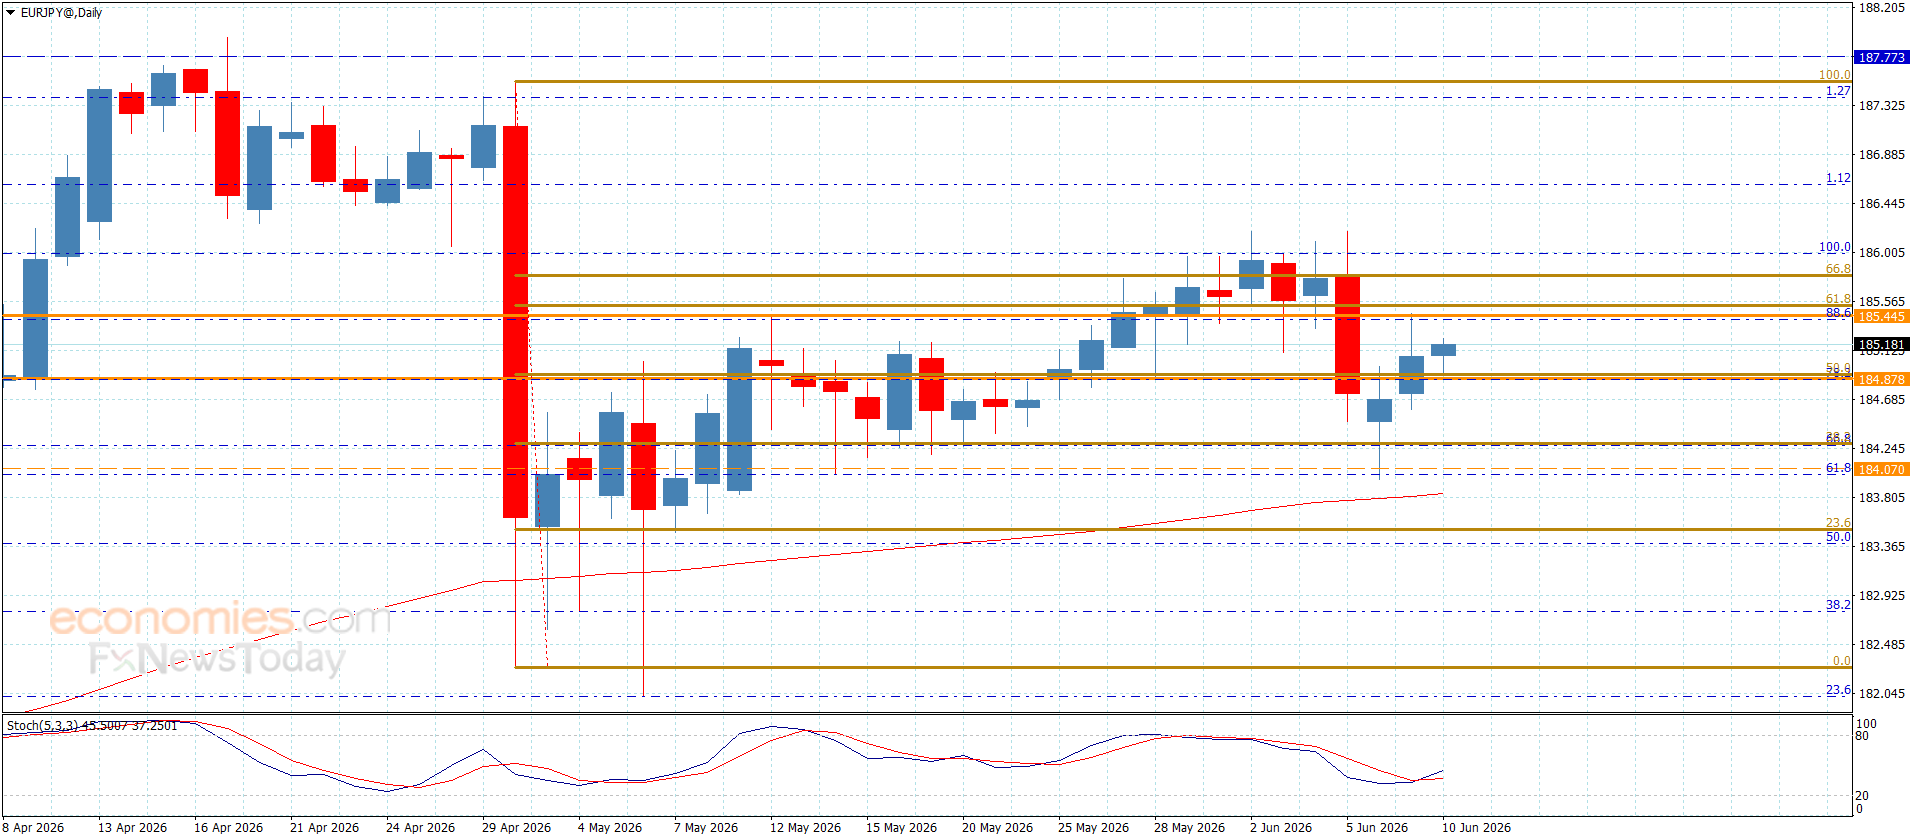
The EURJPY resumes the rise– Forecast today – 10-4-2026

By |2026-04-10T17:05:16+02:00April 10, 2026|Forex News, News|0 Comments

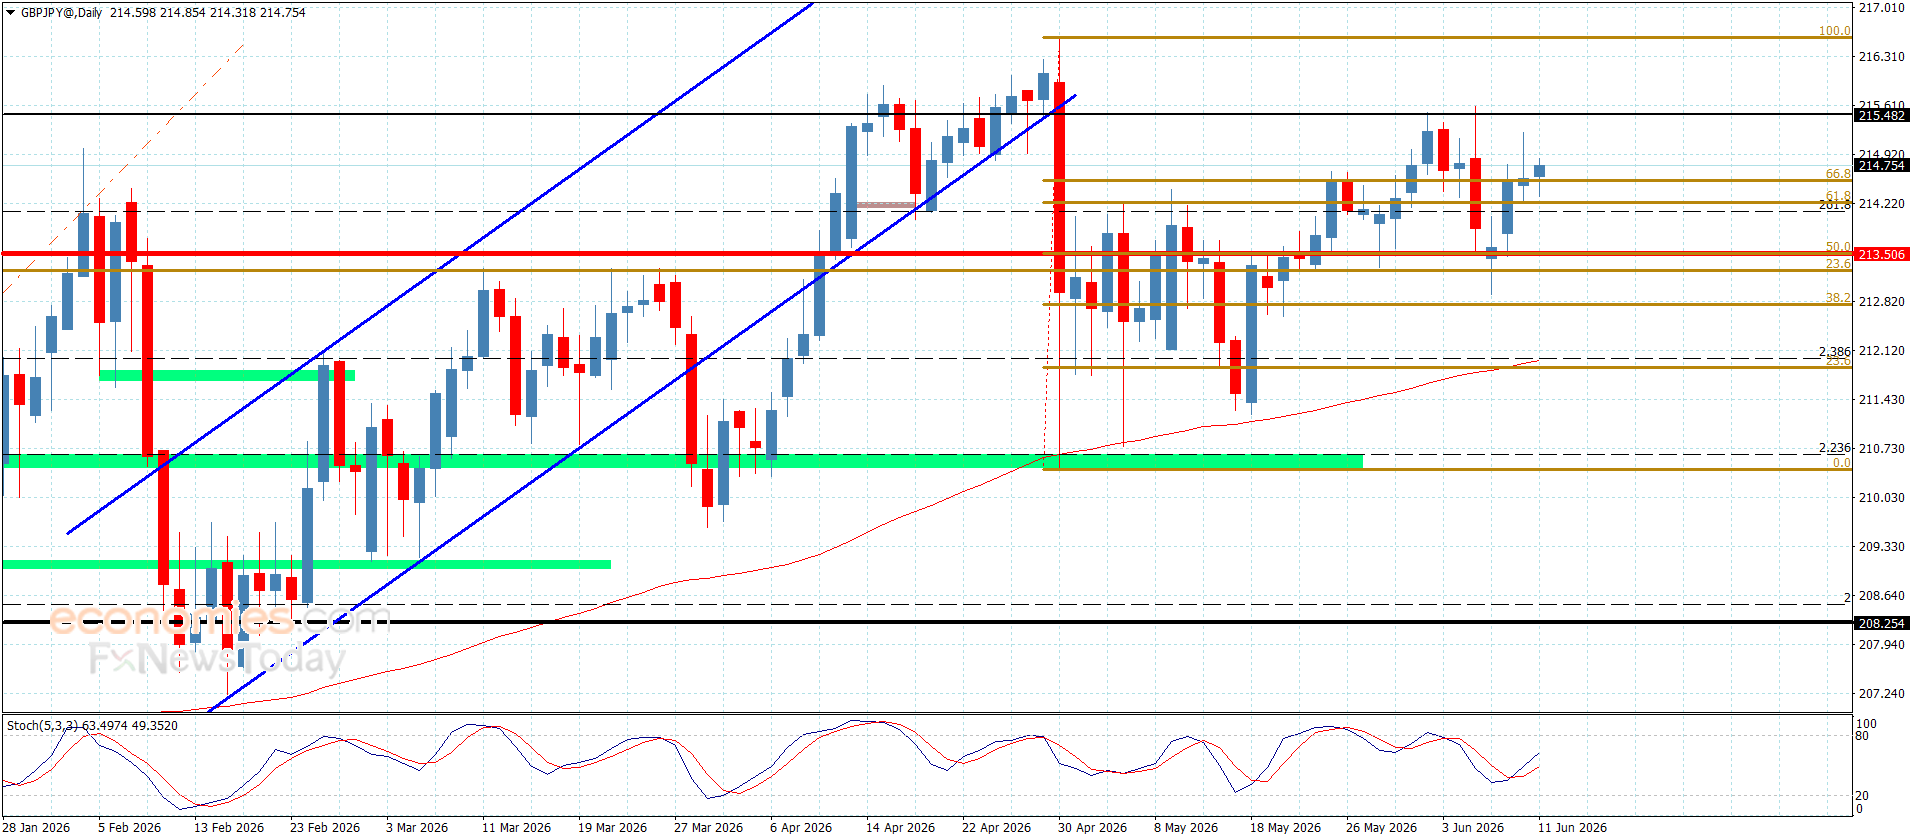
The GBPJPY pair is under strong positive pressures, pushing it to surpass the resistance at 213.30, to settle above it to confirm regaining the bullish bias by its stability within the minor bullish channel’s levels, recording 213.85 level.


The continuation of providing positive closes above 213.30 level will allow it to take advantage from the main indicators, to begin targeting new positive stations that might begin at 214.10 and 215.00, while the return to settle below 213.30 will force it to activate the bearish corrective scenario again, forming the initial negative targets at 211.90 level.


The expected trading range for today is between 213.30 and 215.00


Trend forecast: Bullish


Source link

Go to Top