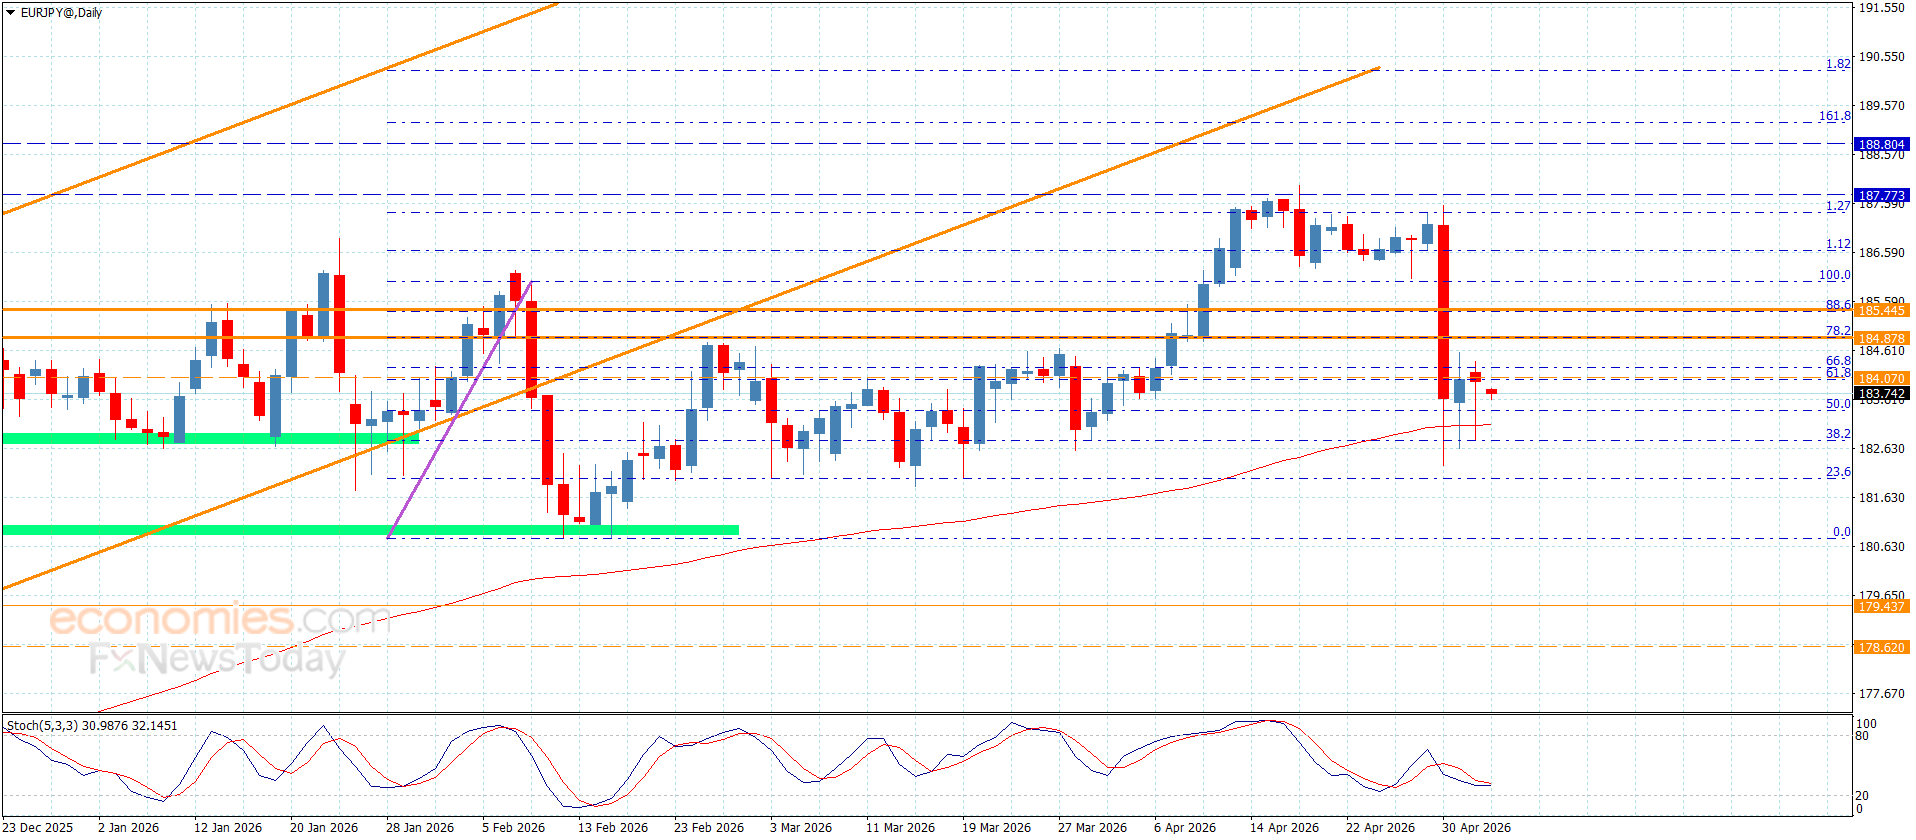
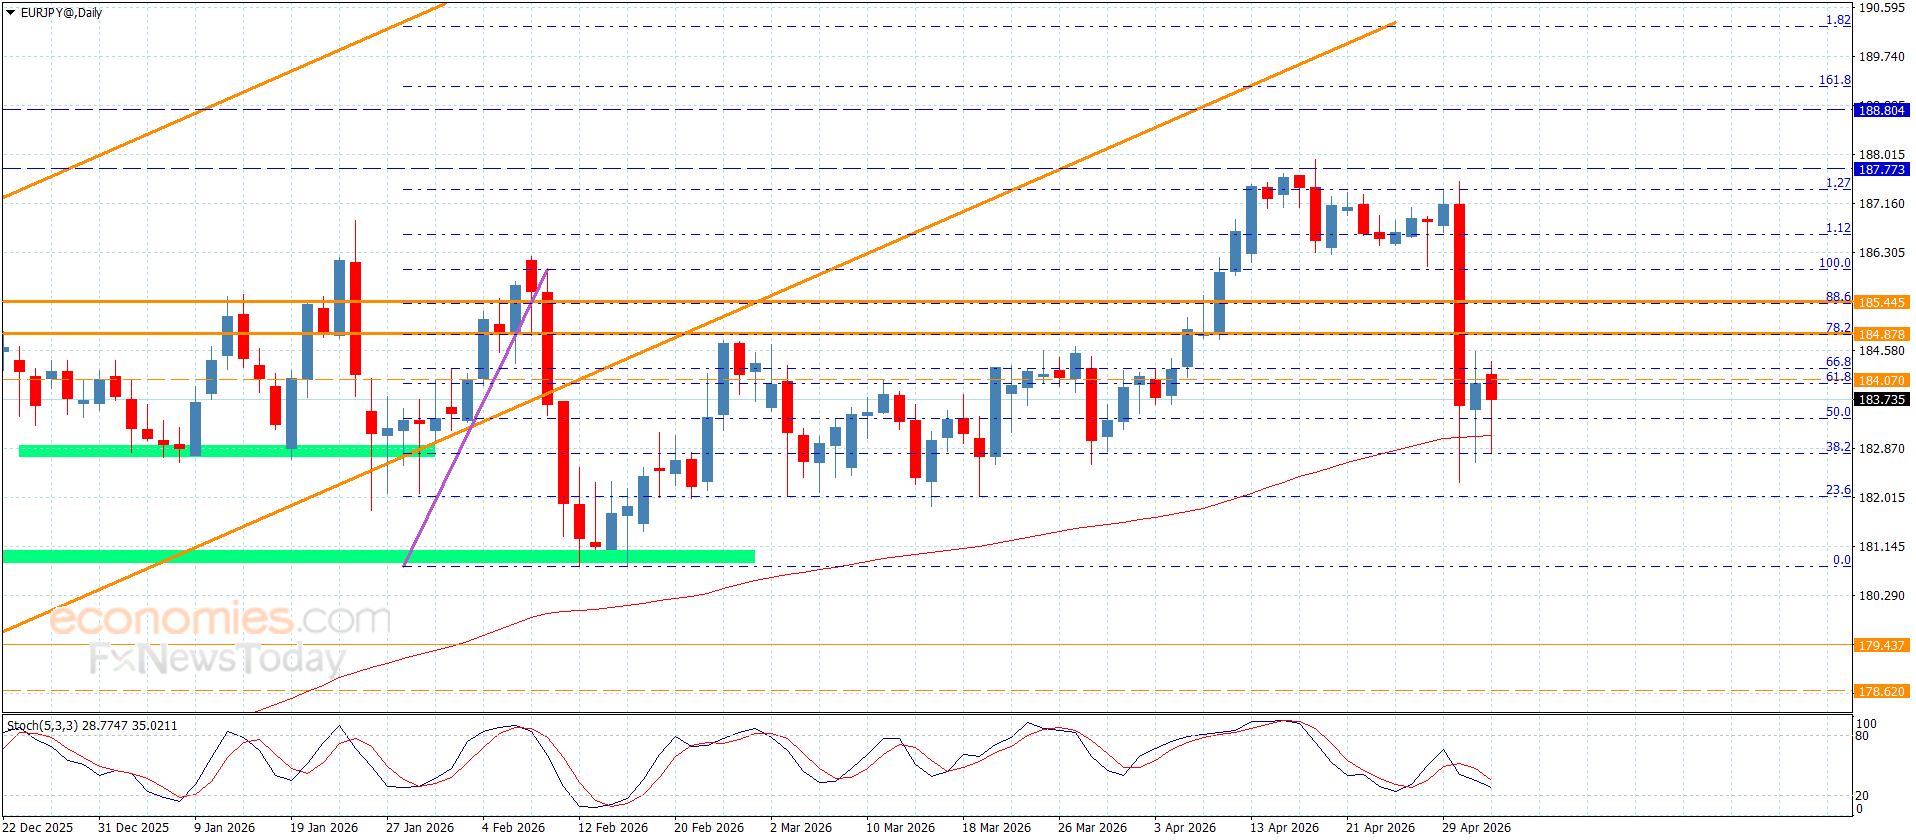
The EURJPY pair reached the target at 182.80, which represents a strong obstacle against the negative trend, which forces it to form temporary positive rebound, to settle near 183.75 as appears in the above image.
Note that the current positive rebound will affect the negative scenario, due to the stability below the main barrier at 185.45 besides the attempt of forming a barrier against the current trading at 184.85, therefore we will keep waiting for breaking the current obstacle, to open the way for reaching the extra negative stations, which might begin at 182.10 reaching the next main target at 181.25.
The expected trading range for today is between 182.80 and 184.20
The Pound to Dollar exchange rate (GBP/USD) is holding just below 1.3600, after rebounding from support near 1.3450, as markets continue to navigate a mix of central bank caution and geopolitical uncertainty.
The Bank of England has adopted a wait-and-see stance on interest rates, helping to steady Sterling, while broader dollar moves and Middle East developments remain the dominant drivers for GBP/USD direction.
GBP/USD Forecasts: BoE wait and see
Credit Agricole is relatively bullish on the Pound, but still forecasts that the Pound to Dollar (GBP/USD) exchange rate will retreat to 1.31 by the end of 2026 as the dollar strengthens.
GBP/USD found support close to 1.3450 during the week and spiked to highs above 1.36 before settling just below this level with overall ranges still relatively contained.
Scotiabank sees scope for further near-term gains; “We note the absence of any material resistance ahead of the January high in the mid/upper-1.38s.
Middle East developments will remain key elements across all currencies. According to Credit Agricole; “The ebb and flow of geopolitical risks should remain an important driver of the GBP as well, and GBP/USD could continue to follow the broad USD moves across the board.
Save on Your GBP/USD Transfer
Get better rates and lower fees on your next international money transfer.
Compare TorFX with top UK banks in seconds and see how much you could save.
The Bank of England held interest rates at 3.75% at the latest meeting with an 8-1 vote as Pill voted for a rate hike. The bank noted the importance of Middle East developments and the high degree of uncertainty over energy prices and the economic implications.
It outlined three scenarios of differing severity for underlying inflation. Under the first two, the implications for interest rates would be limited, but the severe scenario would require multiple rate hikes.
Traders are pricing in three rate hikes this year whereas many investment banks expect only one hike.
Credit Agricole sees scope for a firm Pound even if rate expectations are scaled back; “We further note that the GBP remained firm even though UK rates investors have pared back somewhat their rate expectations in the wake of the policy meeting. Despite the latest correction lower, however, the GBP remains one of highest yielding G10 currencies and the currency could continue to draw support from its considerable rate appeal.
It added; “We conclude that it may take a more meaningful drop of the GBP’s relative rate appeal to see the currency suffer.”
Scotiabank notes that markets have not fully priced-in a June rate hike and commented;.”We thus see scope for further fundamental strength in the pound.”
It also considers that investors may be over-pessimistic surrounding the outlook; “Bearish sentiment offers the potential for further upside as markets shake off lingering concerns related to the US/Iran conflict as well as the political uncertainty that continues to plague PM Starmer.”
The bank also sees scope for dollar weakness; “The USD has already faded a good portion of the geopolitically-driven risk premium that was observed from early March, but the DXY continues to trade above its fair value and see scope for further weakness.”
Like this piece? Please share with your friends and colleagues:
International Money Transfer? Ask our resident FX expert a money transfer question or try John’s new, free, no-obligation personal service! ,where he helps every step of the way,
ensuring you get the best exchange rates on your currency requirements.
The Japanese yen was largely unchanged on Monday morning as investors reacted to last week’s intervention by the Bank of Japan (BoJ). The USD/JPY exchange rate was trading at 158 on Monday, down from last week’s high of 160.
Bank of Japan intervention
The USD/JPY exchange rate is in the spotlight this week as investors react to last week’s intervention, in which the Bank of Japan spent as much as $35 billion in yen buying.
This purchasing happened after the pair rose to the important resistance level at 160 for the first time in months. Yen buying is a situation where the central bank removes the currency from the market, a move meant to boost its demand. The last major intervention happened in 2024 as the currency plunged.
A weaker Japanese yen has a major impact on the economy. On the positive side, it helps to boost exporters like Mitsubishi, Toyota, and Komatsu, especially in the era of higher tariffs from the United States.
However, it hurts importers who now have to pay more money for their products. These importers have been hurt now that the US-Iran war has pushed commodity prices to the highest point in years.
The main risk for interventions is that the impact tends to be short-term. A good example of this is what happened in 2024 when the bank intervened. The USD/JPY pair has been in a strong uptrend since then.
The next main catalyst for the USD/JPY pair is the new statements by Donald Trump on the ongoing Iran war. In a statement, he said that the two sides were still negotiating, with the US responding to Iranian demands. This explains why the price of crude oil has slumped and why global stocks are rising.
The next important catalyst for the stock pair will be the upcoming US non-farm payrolls data on Friday this week.
These numbers will provide more information about the health of the American economy. Analysts expect the report to show that the economy created 78k jobs in April, much lower than the 153k it created in the previous month.
These numbers will not include the thousands of people laid off when Spirit Airlines filed for bankruptcy after the government funding failed. They will come a week after the Federal Reserve left interest rates unchanged.
USD/JPY technical analysis
USDJPY chart | Source: TradingView
The daily timeframe chart shows that the USD to JPY exchange rate has pulled back in the past few days. This retreat started after the pair found substantial resistance at 160, where it formed a double-top pattern.
The pair has moved below all moving averages, while the Supertrend indicator has turned from green to red. Also, it is slowly forming a bearish flag pattern, which leads to more downside.
Therefore, the pair will likely continue falling, potentially to the next key support level at 155. A move below that level will point to more downside, potentially to 152, the lowest level in January.
Copper price didn’t move anything by its confinement between $6.0500 level, while $5.8100 forms a key support against the attempt of resuming the bearish corrective trend, to fluctuate near $5.9100 level.
Providing positive momentum by the main indicators might increase the chances of surpassing the barrier, which opens the way for renewing the bullish attempts, to target several positive stations that might begin at $6.1200 and $6.2500, while breaking the support will force it to suffer extra losses by reaching $5.700 and $5.5900.
The expected trading range for today is between $5.8100 and $6.0500
The Euro to Pound Sterling (EUR/GBP) exchange rate held steady at 0.8637, with the pair consolidating as markets digest central bank signals from both the European Central Bank and Bank of England.
MUFG notes that, barring a sharp fall in energy prices, both the ECB and BoE are set to raise interest rates in the coming months, with tightening expectations now largely priced into markets.
“Without a dramatic reversal in energy prices… both the BoE and the ECB will be hiking rates.”
The bank highlights that UK rate expectations have shifted significantly, with markets now pricing between two and three hikes this year, while ECB guidance has been more explicit regarding a near-term move.
MUFG expects limited divergence between the two central banks, suggesting that EUR/GBP is likely to remain rangebound in the near term.
However, the bank sees a modest upside risk for the pair, reflecting slightly stronger signalling from the ECB.
“There was little yesterday to suggest much in the way of policy divergence… and hence, EUR/GBP range trading looks set to continue.”
MUFG expects the Euro to Pound Sterling exchange rate (EUR/GBP) to trade in a narrow range near current levels in the near term, with a modest upside bias towards higher levels, supported by clearer ECB rate hike signals.
EUR/GBP — Key Rate Highlights:
Current Rate: 0.863736 (04 May 2026, 08:00 UTC)
Daily Move: +0.04% (+0.000355)
Latest Close: 0.863737 (01 May)
May Range: 0.861981 – 0.863890
May Performance: +0.17%
12-Month Range: 0.840670 – 0.886524
Recent Trend: EUR/GBP edging higher in early May, following a broader downtrend seen through April
Disclaimer: For information only, not investment advice. This EUR to GBP forecast summarises and interprets third-party research; views expressed are those of the original source and may not fully reflect the source’s complete analysis. Neither the source nor we accept liability for reliance on this interpretation.
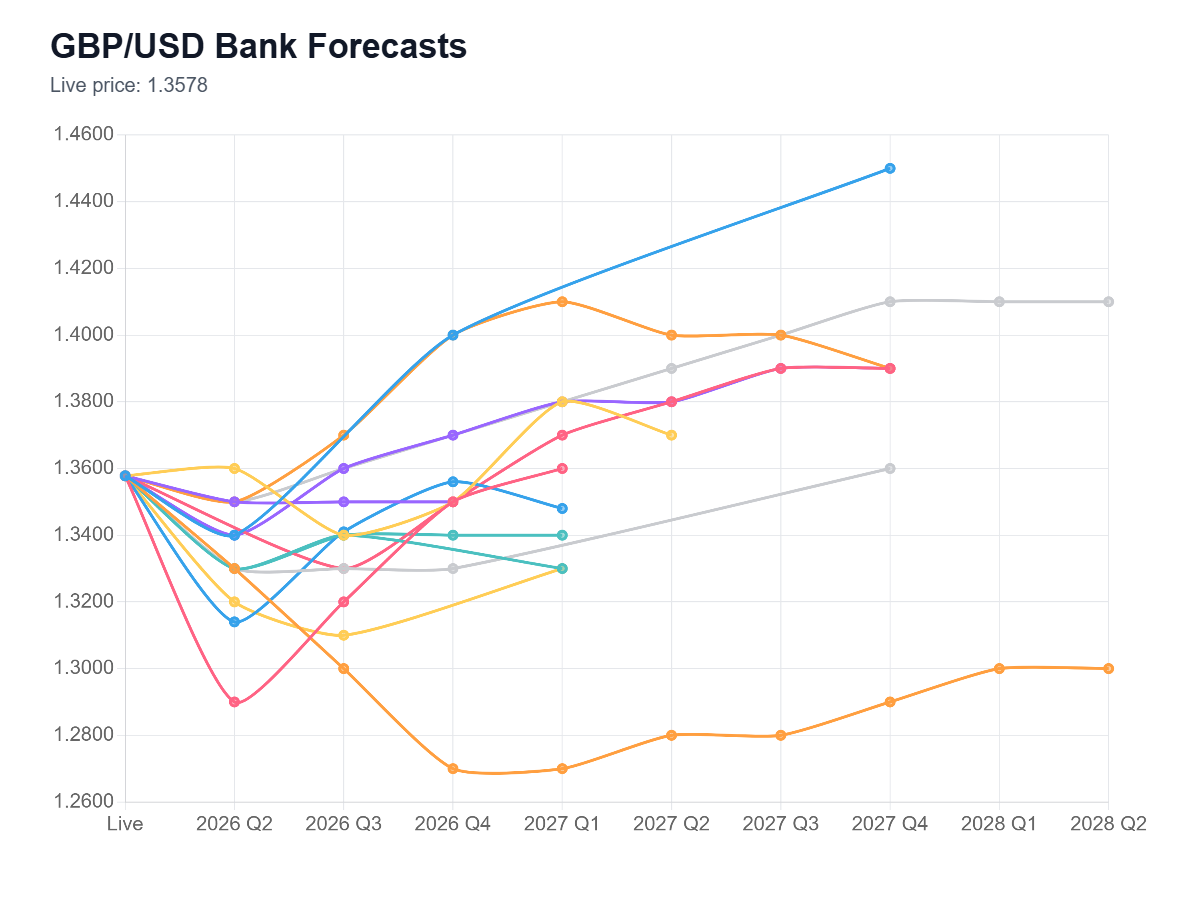
Exchange Rates UK Research’s latest April-May 2026 poll of major investment banks shows the pound-to-dollar exchange rate is expected to average around 1.33–1.34 in Q2 this year, below the current spot near 1.3576, with forecasts ranging widely from 1.27 on the downside to 1.40–1.45 on the upside over the longer term.
The data highlights a market where the central view points to limited near-term upside, but with a growing divergence in expectations beyond that.
Image: GBP/USD exchange rate forecasts chart- survey results May 2026
Consensus suggests GBP/USD close to fair value after April rally
The clustering of pound sterling forecasts in the low-to-mid 1.30s suggests most banks believe GBP/USD is already trading near the upper end of its near-term range.
This follows a strong April performance, with the pair rising over 2% and briefly testing the mid-1.36s before losing momentum into early May.
Many institutions, including Goldman Sachs, ING and SEB, anchor their projections around these levels, reinforcing the idea of a broadly rangebound market.
Near-term expectations therefore point to sideways movement or a modest drift lower, rather than a sustained breakout higher.
Forecast split reflects rising macro uncertainty
While the average forecast is relatively stable, the range of projections is notably wide.
On the upside, banks such as RBC, Westpac and ABN AMRO see GBP/USD climbing back towards 1.40 and beyond over time.
On the downside, Citi and CIBC expect a move towards the high-1.20s, reflecting concerns about the UK outlook.
This divergence reflects an increasingly uncertain macro backdrop.
Geopolitical tensions, particularly the Iran conflict, have been a key driver, with shifts in oil prices and risk sentiment influencing demand for the US dollar as a safe haven.
At the same time, the Bank of England is balancing persistent inflation pressures against slowing growth, leaving policy finely poised and adding to currency volatility.
UK-specific risks are also building, with rising energy costs and weaker growth expectations weighing on sentiment towards sterling.
GBP/USD Outlook: stable average, but growing risk of a larger move
The latest Exchange Rates UK Research poll suggests GBP/USD is likely to remain anchored around the mid-1.30s in the near term.
However, the widening spread of forecasts indicates that this stability may not last.
With central bank policy, inflation dynamics and geopolitical risks all in flux, future moves are increasingly likely to be driven by external shocks.
For now, the consensus points to a steady range.
But the breadth of forecasts suggests the next decisive move, higher or lower, could be more significant than the average implies.
The BOJ must now determine whether it should defend the growth or the price stability. The pressure has been increasing as Japanese government bond yields are highest in decades.
The currency intervention in Japan also demonstrates the severity of the situation. The authority reportedly intervened and purchased the yen when USDJPY hit 160. According to BOJ data, it was possible that the authorities used as much as 5.48 trillion yen, or approximately $35 billion in the process. However, intervention may not be sufficient. The effect can be short-lived without raising the rates or concerted policy intervention.
USDJPY Forecast: Yen Intervention May Slow the Rally Despite Rate Gaps
The weakness of the yen is due to the fact that U.S. rates are significantly higher than Japanese rates. After the intervention, the pair returned to the area around 155. This is an indication that the policy differences between the Fed and the BOJ are wide in the market.
The threat of a second intervention is extremely high in case USDJPY returns to 160. Japan has intervened in holidays in the past, such as Golden Week in 2024. Traders are wary of history. But the intervention can only cause short term pullbacks unless the BOJ proceeds with a rate hike.
The primary trend is now based on two forces. A hike in BOJ would favor the yen and drive USDJPY down. However, a hawkish Fed may limit this move. If U.S. inflation remains strong and the oil prices are high, the USDJPY can continue to move rather than initiate a downward trend.
The daily chart for USDJPY shows constructive bullish price action during the past two years. However, the pair rejected the strong resistance at the 160 level due to intervention.
Despite this failure at 160, the pair only dropped to 155.50, which keeps the bullish trend active. As long as the pair remains above the 150 level, the overall price structure will still remain positive.
The pair can drop further during the next week, but the immediate support remains at the 154 level at the 200-day SMA. However, a recovery above 162 will indicate a strong rally in the pair, with further weakness in the Japanese yen.
The Australian dollar has broken to a fresh new high against the Japanese yen during the early part of Monday, and this is one of my favorite yen-denominated pairs, as the Australian dollar has been so healthy, and the carry is pretty strong with this one. You get paid fairly well at the end of every day. I think short-term pullbacks offer buying opportunities. I don’t see why this thing doesn’t go to the 116 Yen level unless we get some type of massive shock to the system, which could happen in the Middle East. It doesn’t seem to be going that great, but as things stand right now, I like buying and holding this. I think the Aussie has some distance to cover against the Japanese yen soon.