The main tag of Forex News Today Articles.
You can use the search box below to find what you need.
[wd_asp id=1]
27
05, 2026
The main tag of Forex News Today Articles.
You can use the search box below to find what you need.
[wd_asp id=1]
– Written by
David Woodsmith
STORY LINK GBP/USD Forecast: US Dollar Strengthens after Fresh US Action in Iran
The Pound to US Dollar (GBP/USD) exchange rate edged lower on Tuesday as renewed instability in the Middle East encouraged investors to seek shelter in safer assets.
The GBP/USD exchange rate traded around $1.3480 at the time of writing, down roughly 0.2% from the start of the session as market caution intensified.
The US Dollar (USD) firmed on Tuesday after reports emerged of fresh US military action targeting sites in southern Iran, adding renewed strain to already fragile ceasefire negotiations between Washington and Tehran.
The ‘Greenback’ attracted safe-haven demand after American forces reportedly struck missile facilities and suspected mine-laying operations near the Strait of Hormuz. US officials described the attacks as defensive measures intended to safeguard shipping routes and allied naval operations in the region.
Markets were also concerned that the strikes could derail hopes for a broader diplomatic breakthrough. Although US President Donald Trump claimed earlier in the week that a peace agreement was ‘largely negotiated’, investors remain sceptical about the prospects for lasting stability.
The Pound (GBP) struggled to attract strong demand amid the deterioration in market sentiment, although falling UK borrowing costs helped to cushion Sterling’s downside.
Sterling remained under pressure as investors assessed the potential economic consequences of renewed Middle East uncertainty, particularly the risks posed by elevated energy prices to the UK economy.
Get better rates and lower fees on your next international money transfer.
Compare TorFX with top UK banks in seconds and see how much you could save.
At the same time, Sterling found some support as UK gilt yields continued to retreat from the multi-decade highs struck earlier in the month, with borrowing costs easing to their lowest levels since mid-April.
The Pound to US Dollar exchange rate is likely to remain highly reactive to geopolitical developments through the remainder of the week.
GBP/USD may remain under pressure if fears surrounding the US-Iran conflict continue to intensify, with investors likely to favour the safe-haven ‘Greenback’ in periods of heightened uncertainty.
However, the US Dollar’s upside potential may be tempered later in the week ahead of the release of the Federal Reserve’s preferred inflation gauge, the core PCE price index.
Meanwhile, in the absence of major UK economic releases, Sterling is likely to remain driven primarily by broader market sentiment and developments in global bond markets.

International Money Transfer? Ask our resident FX expert a money transfer question or try John’s new, free, no-obligation personal service! ,where he helps every step of the way,
ensuring you get the best exchange rates on your currency requirements.
TAGS: Pound Dollar Forecasts
The USD/JPY pair recovers some ground on Tuesday, rising over 0.25% as buyers ignore the intervention zone, clearing 159.00 and aiming to challenge the 159.50 area. At the time of writing, the pair trades at 159.38.
Price action shows USD/JPY is poised to consolidate further within the 159.00-160.00 area, with further upside expected after the pair bounced off the 50-day Simple Moving Average (SMA) at 158.79, extending its gains past 159.00.
Momentum, although bullish with the Relative Strength Index (RSI) above its 50-neutral level, remains capped by fears for a possible intervention by Japanese authorities in the FX markets.
On the downside, if USD/JPY moves below 159.00, traders could eye the 50-day SMA at 158.78. Below this level lies the 100-day SMA at 157.62, ahead of the May 6 low of 155.04.
The table below shows the percentage change of Japanese Yen (JPY) against listed major currencies today. Japanese Yen was the strongest against the New Zealand Dollar.
| USD | EUR | GBP | JPY | CAD | AUD | NZD | CHF | |
|---|---|---|---|---|---|---|---|---|
| USD | 0.13% | 0.43% | 0.25% | 0.07% | 0.06% | 0.61% | 0.36% | |
| EUR | -0.13% | 0.34% | 0.15% | -0.02% | -0.03% | 0.51% | 0.24% | |
| GBP | -0.43% | -0.34% | -0.17% | -0.36% | -0.36% | 0.17% | -0.08% | |
| JPY | -0.25% | -0.15% | 0.17% | -0.17% | -0.17% | 0.34% | 0.13% | |
| CAD | -0.07% | 0.02% | 0.36% | 0.17% | 0.01% | 0.54% | 0.29% | |
| AUD | -0.06% | 0.03% | 0.36% | 0.17% | -0.01% | 0.53% | 0.29% | |
| NZD | -0.61% | -0.51% | -0.17% | -0.34% | -0.54% | -0.53% | -0.25% | |
| CHF | -0.36% | -0.24% | 0.08% | -0.13% | -0.29% | -0.29% | 0.25% |
The heat map shows percentage changes of major currencies against each other. The base currency is picked from the left column, while the quote currency is picked from the top row. For example, if you pick the Japanese Yen from the left column and move along the horizontal line to the US Dollar, the percentage change displayed in the box will represent JPY (base)/USD (quote).
The Euro gapped higher to kick off the trading week on Monday as we are starting to see signs that maybe there’s some progress being made in talks between the Americans and the Iranians.
That being said, it will drive down rates, and I think that will have a generally positive effect on the Euro as US interest rates have been extraordinarily strong.
That being said, this is probably a temporary thing because quite frankly this is a situation where traders are going to continue to look at the range and try to trade back and forth. I think a situation exists where we look for signs of exhaustion after short-term rallies to get short again because I do think that there is a very high probability of something spooking the market coming out of the Middle East.
I’m kind of surprised that traders have gotten this excited, and maybe they haven’t, maybe it’s just because it’s a holiday session and its very thin liquidity. But we’ve seen good news coming out of the Middle East more than once only to see it turn around completely. Until that changes and we get some type of actual agreement, I just don’t see how you can expect a major breakout.

I believe somewhere near the 1.1750 level the EUR/USD pair will start to see selling pressure extending all the way to the 1.1850 level. I would like to see a bounce towards that area, signs of exhaustion that I can start shorting.
In the meantime, would I be a buyer of the Euro? Probably not. I actually prefer the British pound, but we could see a little bit of a drift. In short, basically I think the gap probably isn’t that big of a deal.
Ready to trade our EUR/USD daily forecast? Here’s a list of some of the top forex brokers in Europe to check out.
Christopher Lewis has been trading Forex and has over 20 years experience in financial markets. Chris has been a regular contributor to Daily Forex since the early days of the site. He writes about Forex for several online publications, including FX Empire, Investing.com, and his own site, aptly named The Trader Guy. Chris favours technical analysis methods to identify his trades and likes to trade equity indices and commodities as well as Forex. He favours a longer-term trading style, and his trades often last for days or weeks.
As seen on: Pairs Of Aces Podcast,The Trader Guy, FXEmpire
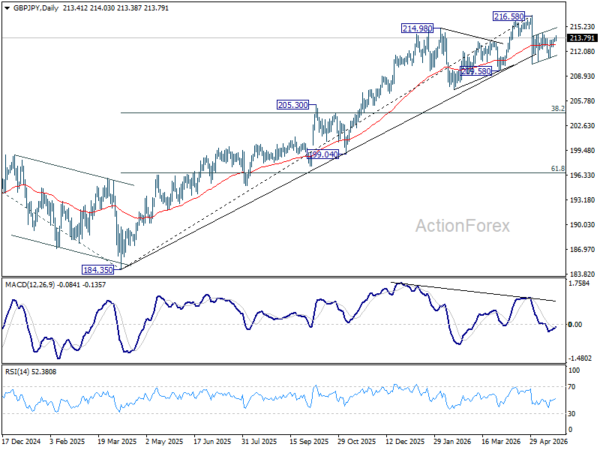
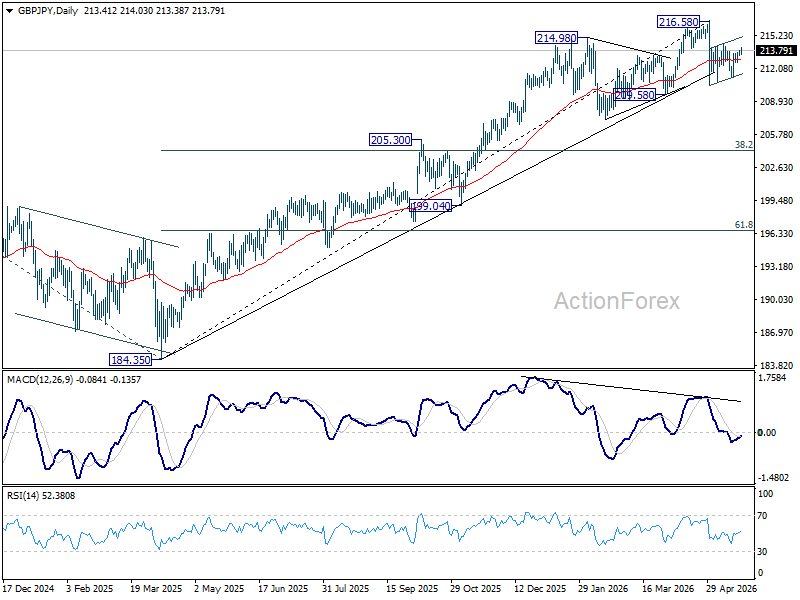
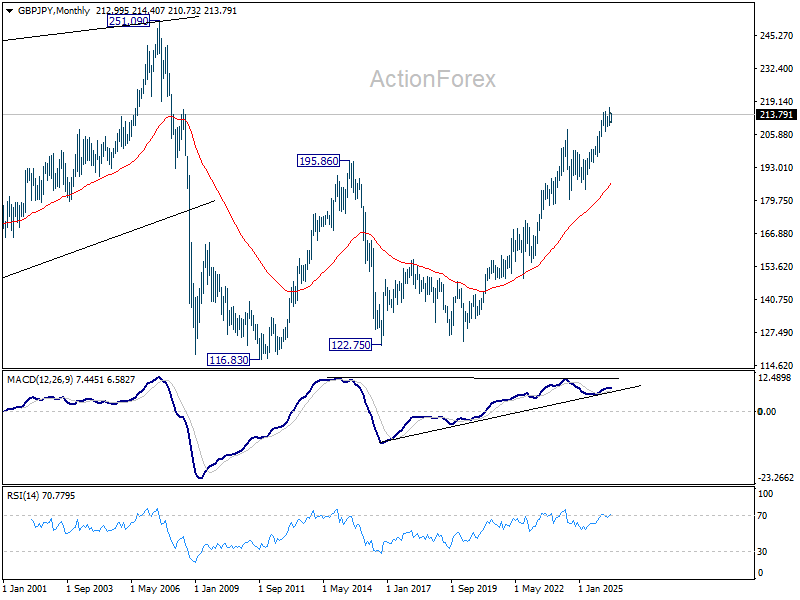
Range trading continued in GBP/JPY last week and outlook is unchanged. Corrective pattern from 216.58 is still extending. Above 214.40 will extend the rebound from 210.43 to retest 216.58. On the downside, break of 211.23 will bring deeper fall through 210.43 instead.
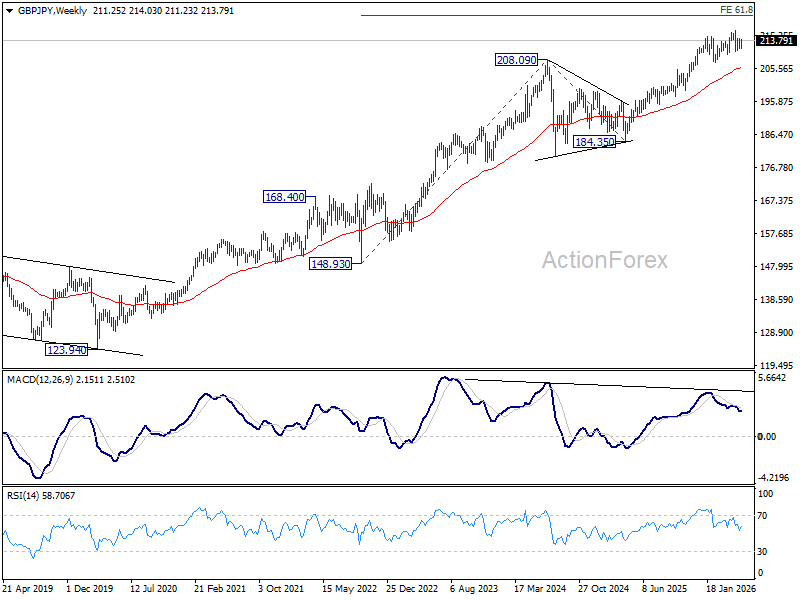
In the bigger picture, while the fall from 216.58 is steep, there is no clear sign of trend reversal yet. The long term up trend could still extend to 61.8% projection of 148.93 (2022 low) to 208.09 (2024 high) from 184.35 at 220.90 on resumption. However, sustained break of 55 W EMA (now at 205.91) will argue that it’s already in medium term down trend for 184.35 support.
In the long term picture, up trend from 116.83 (2011 low) is in progress. Next target is 251.09 (2007 high). This will remain the favored case as long as 55 M EMA (now at 186.82) holds.
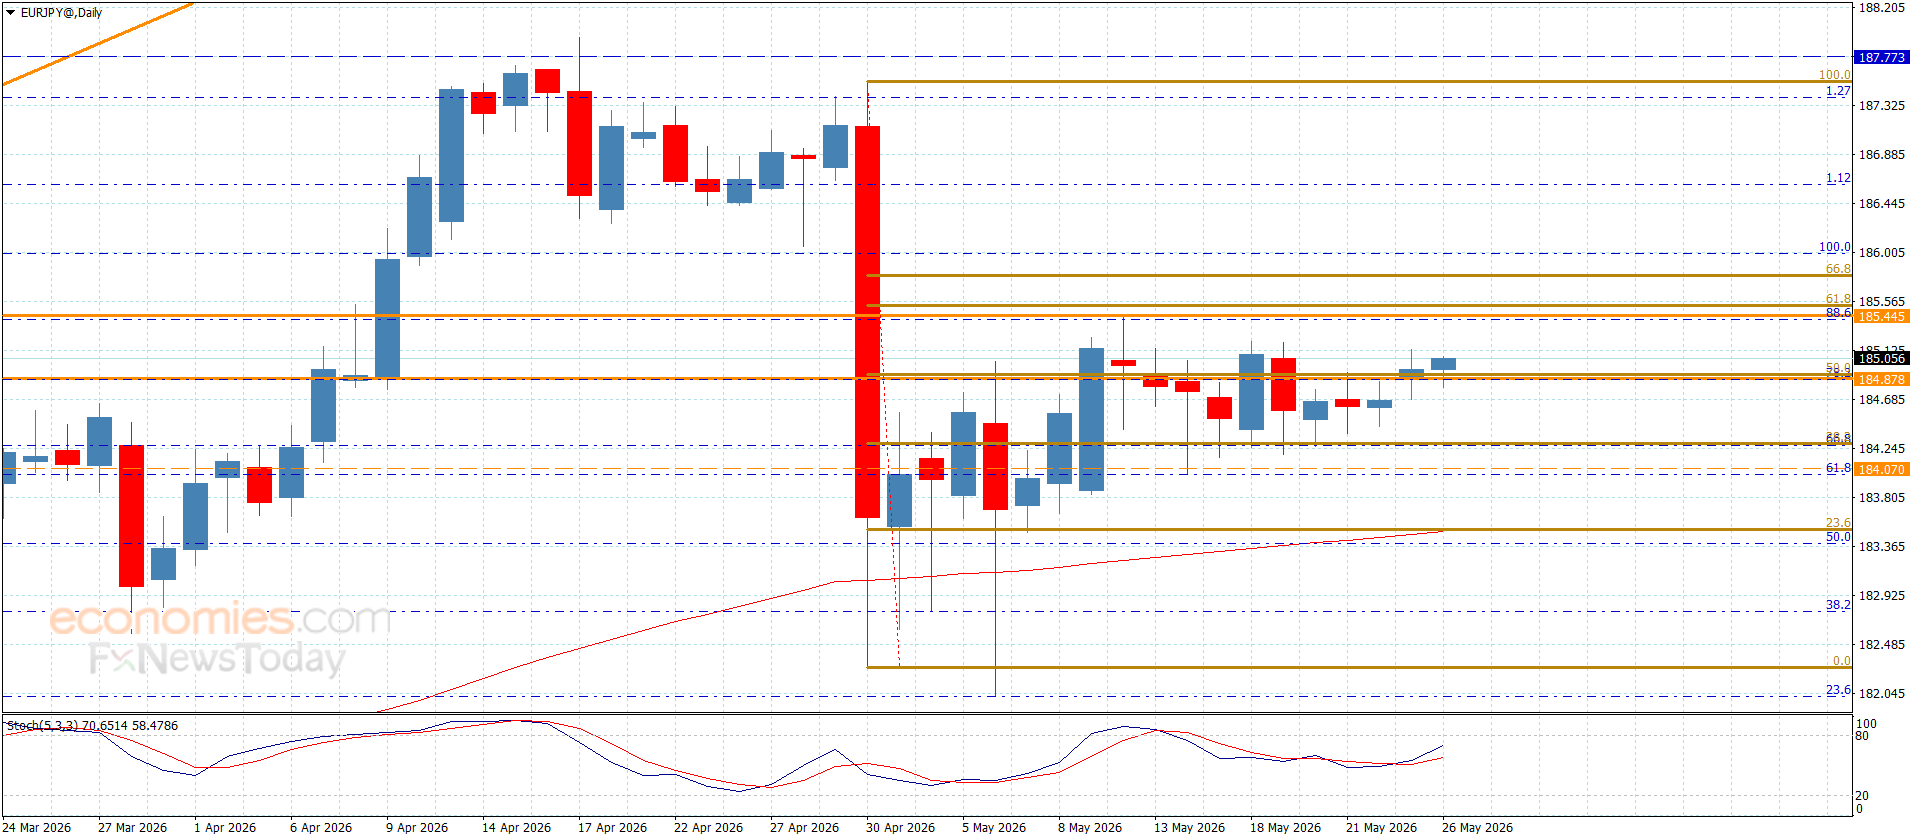
The EURJPY pair surrendered to the positivity of the main indicators, specifically, stochastic approach from 80 level, to force it delay the bearish corrective attempts and form some positive waves to settle near 185.10.
The current bullish rally will not form any threaten on the negative scenario, depending on the continuation of forming main barrier at 185.80, which makes us wait for gathering negative momentum again, to attack the obstacle near 184.30, where breaking it will extend the trading towards 183.50 reaching the main target at 182.75.
The expected trading range for today is between 184.30 and 185.40
Trend forecast: Bearish
– Written by
James Fuller
STORY LINK Pound to Dollar Week Ahead Forecast: Fed Expectations and UK Risks Weigh on GBP
The Pound to Dollar exchange rate (GBP/USD) remained under pressure as investors favoured the US Dollar amid resilient American economic data, elevated Treasury yields and fading expectations for Federal Reserve interest-rate cuts. With UK political uncertainty and questions over the Bank of England’s next move lingering in the background, Sterling faces a challenging near-term environment despite pockets of resilience.
Danske Bank forecasts that the Pound to Dollar (GBP/USD) exchange rate will slide to 1.26 on a 12-month view as the dollar makes net gains and the Pound remains fragile.
CIBC, in contrast, sees scope for limited GBP/USD gains to 1.37 by the end of this year.
Danske Bank has changed its dollar view; “In May, the underlying macro momentum has started to increasingly favour the US. High-frequency labour market data has improved, and underlying inflation seems to accelerate beyond the first-order energy effects. Significant AI-related investment demand is lifting both real growth and imported inflation in the US.”
CIBC remains less confident over the dollar; “The near term risk for the USD in our view, is that lagged impact of the shock begins to weigh on the growth data, which could lead to a further tactical USD bid. It is in the second half of the year, when we expect the USD to resume a trend weakening.”
Bank of England (BoE) policy will be a key element. Difficulties faced by the BoE was illustrated by the latest PMI business confidence data.
Get better rates and lower fees on your next international money transfer.
Compare TorFX with top UK banks in seconds and see how much you could save.
There was the weakest reading for services-sector index for five years, but strong upward pressure on costs continued with output charges increasing at the fastest rate for four years.
Headline inflation dipped to 2.8% from 3.3%, but the rate will increase again over the next few months while labour-market data was weak.
BoE members at the Treasury Select Committee pointed to a high degree of uncertainty, but with some reluctance to make a quick decision.
CIBC discussed the BoE outlook; “Tightening financial conditions and or a central bank which is already moderately restrictive leaves us anticipating a less aggressive reaction function than that discounted by the market, namely 2026 inertia. Given the importance of policy to consumer sentiment and spending such an outcome should prove supportive for activity and by definition eventually the currency.”
Danske Bank is not backing the market view; “With neither wage data nor food prices indicating any concern on spillover effects, the BoE can afford to wait for more data. We think they are satisfied with the tighter financial conditions and are most likely to keep the Bank Rate at the current level throughout 2026 and 2027.”
UK political developments will also be watched closely.
ING commented; “The Labour Party looks like it wants a new leader, but PM Starmer is vowing to fight on. This psychodrama could take two to three months to unfold if Andy Burnham – seen as the most negative sterling candidate – enters the race to replace Starmer.”
The bank added; “Status quo looks the best outcome for GBP if Starmer stays, or Wes Streeting is elected with a sensible Chancellor. Most other options are GBP negative as Labour policy is pulled leftwards.”
International Money Transfer? Ask our resident FX expert a money transfer question or try John’s new, free, no-obligation personal service! ,where he helps every step of the way,
ensuring you get the best exchange rates on your currency requirements.
TAGS: Pound Dollar Forecasts
USD/JPY edges lower during the North American session on Monday, sponsored by geopolitical headlines that weighed on the US Dollar (USD). In the meantime, fears of a possible intervention of Japanese authorities in the FX markets underpinned the Japanese Yen (JPY). At the time of writing, the pair trades at 158.91, down 0.19%.
From a technical perspective, USD/JPY is consolidating above the 50-day Simple Moving Average (SMA) at 158.78, with buyers pushing the exchange rate towards the intervention zone around 159.00-160.00.
If that area is hurdled, the next area of interest would be the year-to-date (YTD) high at 160.73, followed by the 161.00 figure.
Although momentum remains bullish, as indicated by the Relative Strength Index (RSI), further downside is expected as the slope approaches the 50-neutral level, an indication that sellers are gaining steam.
Downwards, the USD/JPY first support would be the 50-day SMA at 158.78, followed by the 20-day SMA at 158.14. A breach of the latter will expose the 100-day SMA at 157.59, followed by the May 14 daily low of 157.31. Below this area, look for the 157.00 mark.
The table below shows the percentage change of Japanese Yen (JPY) against listed major currencies today. Japanese Yen was the strongest against the US Dollar.
| USD | EUR | GBP | JPY | CAD | AUD | NZD | CHF | |
|---|---|---|---|---|---|---|---|---|
| USD | -0.35% | -0.55% | -0.19% | -0.14% | -0.67% | -0.40% | -0.27% | |
| EUR | 0.35% | -0.22% | 0.15% | 0.18% | -0.34% | -0.03% | 0.07% | |
| GBP | 0.55% | 0.22% | 0.39% | 0.41% | -0.13% | 0.19% | 0.27% | |
| JPY | 0.19% | -0.15% | -0.39% | 0.04% | -0.52% | -0.24% | -0.14% | |
| CAD | 0.14% | -0.18% | -0.41% | -0.04% | -0.54% | -0.26% | -0.16% | |
| AUD | 0.67% | 0.34% | 0.13% | 0.52% | 0.54% | 0.29% | 0.39% | |
| NZD | 0.40% | 0.03% | -0.19% | 0.24% | 0.26% | -0.29% | 0.10% | |
| CHF | 0.27% | -0.07% | -0.27% | 0.14% | 0.16% | -0.39% | -0.10% |
The heat map shows percentage changes of major currencies against each other. The base currency is picked from the left column, while the quote currency is picked from the top row. For example, if you pick the Japanese Yen from the left column and move along the horizontal line to the US Dollar, the percentage change displayed in the box will represent JPY (base)/USD (quote).
GBP/JPY trades with a positive bias on Monday as the British Pound (GBP) outperforms the Japanese Yen (JPY) amid improving market sentiment surrounding a potential US-Iran deal. At the time of writing, the cross is trading around 214.52, up 0.30% on the day.
Optimism over a possible breakthrough in negotiations between the United States (US) and Iran improved risk appetite after reports suggested both sides were making progress toward a temporary agreement that could eventually reopen the Strait of Hormuz.
However, a report from The Wall Street Journal on Monday suggested negotiations continue to face hurdles over disagreements tied to Iran’s nuclear program and sanctions relief. While key issues remain unresolved, ongoing diplomatic efforts continue to support cautious optimism in markets.
The latest headlines drag Oil prices lower, easing fears of an Oil-driven inflation shock. Still, prices remain well above pre-war levels, leaving the Japanese Yen under pressure as elevated Energy costs continue to pose a key challenge for Japan’s import-dependent economy.
On the daily chart, GBP/JPY holds a constructive bullish bias as it grinds against the horizontal resistance at 214.50. The pair remains well above both the 100-day and 200-day Simple Moving Averages (SMAs) at 212.36 and 207.94, which suggests the broader uptrend stays intact, while a mildly positive Relative Strength Index (RSI) around 56 and a slightly positive Moving Average Convergence Divergence (MACD) reading hint at recovering upside momentum.
On the topside, immediate resistance is located at 214.50, and a sustained break above this barrier would open the way for further gains in the near term.
On the downside, initial support is seen at the 100-day SMA around 212.36, followed by the horizontal floor near 210.00, with the 200-day SMA at 207.94 reinforcing the broader bullish structure on deeper pullbacks.
(The technical analysis of this story was written with the help of an AI tool.)
The table below shows the percentage change of British Pound (GBP) against listed major currencies today. British Pound was the strongest against the US Dollar.
| USD | EUR | GBP | JPY | CAD | AUD | NZD | CHF | |
|---|---|---|---|---|---|---|---|---|
| USD | -0.33% | -0.48% | -0.17% | -0.13% | -0.67% | -0.41% | -0.18% | |
| EUR | 0.33% | -0.16% | 0.15% | 0.18% | -0.36% | -0.08% | 0.13% | |
| GBP | 0.48% | 0.16% | 0.30% | 0.34% | -0.20% | 0.08% | 0.28% | |
| JPY | 0.17% | -0.15% | -0.30% | 0.04% | -0.53% | -0.27% | -0.06% | |
| CAD | 0.13% | -0.18% | -0.34% | -0.04% | -0.55% | -0.29% | -0.09% | |
| AUD | 0.67% | 0.36% | 0.20% | 0.53% | 0.55% | 0.27% | 0.48% | |
| NZD | 0.41% | 0.08% | -0.08% | 0.27% | 0.29% | -0.27% | 0.19% | |
| CHF | 0.18% | -0.13% | -0.28% | 0.06% | 0.09% | -0.48% | -0.19% |
The heat map shows percentage changes of major currencies against each other. The base currency is picked from the left column, while the quote currency is picked from the top row. For example, if you pick the British Pound from the left column and move along the horizontal line to the US Dollar, the percentage change displayed in the box will represent GBP (base)/USD (quote).
The New Zealand dollar initially pulled back a little bit during the trading session, but it has turned right back around to show signs of life. With that being the case, this is a market that I think will try to look for a move to the 0.5950 level. But again, it comes down to whether or not we can actually get real peace, I think, in the Middle East. We keep getting kind of jerked around by the headlines and the words that maybe something is coming, but then it doesn’t. So right now, I think we’re leaning to the upside, but I would not get married to the long here.