The main tag of Forex News Today Articles.
You can use the search box below to find what you need.
[wd_asp id=1]

15 04, 2026

Japan’s Verbal Intervention Supports Yen. Forecast as of 14.04.2026

By |2026-04-15T05:34:09+02:00April 15, 2026|Forex News, News|0 Comments

Japan had no need to intervene in currency markets to force USD/JPY bulls to retreat. Verbal interventions were enough. The government bought itself some time and is now reaping the benefits of the US dollar’s weakness. Let’s discuss this topic and make a trading plan.

The article covers the following subjects:

Major Takeaways

  • USD/JPY quotes decline due to a weaker dollar.
  • The Bank of Japan does not plan to raise interest rates in April.
  • The yen is not being used as a funding currency.
  • Short trades can be considered as long as the USD/JPY pair remains below 159.5.

Weekly Fundamental Forecast for Yen

Investors are increasingly driven by sentiment, reacting to reports of a potential new round of US–Iran negotiations. As a result, the greenback is facing some pressure as a safe-haven asset. On the other hand, oil prices remain high, which is hampering USD/JPY bears. Japan is heavily dependent on energy exports, and its economy will suffer more from geopolitical tensions than the US economy.

The bullish oil market has prompted Japanese analysts to lower earnings forecasts for 113 TOPIX-listed companies. The outlook for US companies looks much better, and capital flows from Asia to the US could become a key driver of the USDJPY rally.

Performance of Carry Trade Strategy

Source: Bloomberg.

Meanwhile, the yen is no longer being used as a funding currency in carry trades. Japanese bond yields are at high levels amid expectations of tighter monetary policy. However, carry trades require low volatility to generate profits properly. Volatility, on the other hand, remains high due to geopolitical tensions.

At the same time, Kazuo Ueda’s dovish rhetoric has disappointed USD/JPY bears. The Bank of Japan governor stated that the regulator would closely monitor developments in the Middle East. However, he did not signal an overnight rate hike at the upcoming BoJ meeting, despite having previously hinted at a tightening of monetary policy. Markets interpreted this as a setback to tightening expectations, with the perceived probability of an April rate hike falling from 55% to 32%.

Probability of Monetary Tightening by BoJ in April

Source: Bloomberg.

Kazuo Ueda has chosen the right moment for his remarks. The US dollar is weakening amid hopes for a resumption of talks between Washington and Tehran. With this in mind, bears could be deprived of an important advantage, and USD/JPY quotes will continue to fall.

The Bank of Japan’s reluctance to continue its cycle of monetary tightening is good news for the Japanese government. Prime Minister Sanae Takaichi criticized her staff for saying that lower import prices could be achieved by tightening monetary policy.

The authorities got what they wanted. Through verbal interventions, they tempered USD/JPY bulls without spending a single penny. The government bought time and is now reaping the benefits of the US dollar’s weakness amid the de-escalation of the conflict in the Middle East and the resulting decline in demand for the greenback as a safe-haven asset. Another issue is that oil prices remain elevated, which will slow down the Japanese economy.

Weekly USDJPY Trading Plan

The USD/JPY pair is likely to consolidate within the 158.5–160 range. Only a breakout above or below this range will allow the pair to define its further direction. As long as quotes remain below 159.5, short trades can be opened.


This forecast is based on the analysis of fundamental factors, including official statements from financial institutions and regulators, various geopolitical and economic developments, and statistical data. Historical market data are also considered.

Price chart of USDJPY in real time mode

The content of this article reflects the author’s opinion and does not necessarily reflect the official position of LiteFinance broker. The material published on this page is provided for informational purposes only and should not be considered as the provision of investment advice for the purposes of Directive 2014/65/EU.


According to copyright law, this article is considered intellectual property, which includes a prohibition on copying and distributing it without consent.

Rate this article:

{{value}} ( {{count}} {{title}} )


Source link

15 04, 2026

Credit Agricole Euro To Dollar Forecast 2026: EUR/USD To Slide To 1.13 By 2027

By |2026-04-15T01:32:58+02:00April 15, 2026|Forex News, News|0 Comments

The Euro to Dollar (EUR/USD) exchange rate strengthened to 5-week highs at 1.1740 last week before dipping back below the 1.17 level as Middle East developments dominated.

Brent crude dipped sharply after the US and Iran announced a cease-fire, but there was renewed upward pressure on prices on Monday as peace talks failed to secure a breakthrough.

Credit Agricole still sees downward risks for the Euro due to energy stresses and has an end-2026 EUR/USD forecast of 1.13.

Events surrounding the Iran conflict will remain a key short-term market influence. The bank still considers that the Euro will remain vulnerable in the short term amid risks of fresh escalation surrounding the Iran conflict. Crucially, the bank notes that the Euro-Zone economy remains vulnerable from an energy shock, especially if prices increase further.

From a longer-term perspective, Credit Agricole calculates that fair value for EUR/USD based on underlying fundamentals is currently around 1.11 which will tend to act as a barrier to Euro gains.

Even with an element of unease surrounding investor appetite for US assets, Credit Agricole still expects that the dollar will remain the dominant reserve currency.

foreign exchange rates

Source link

14 04, 2026

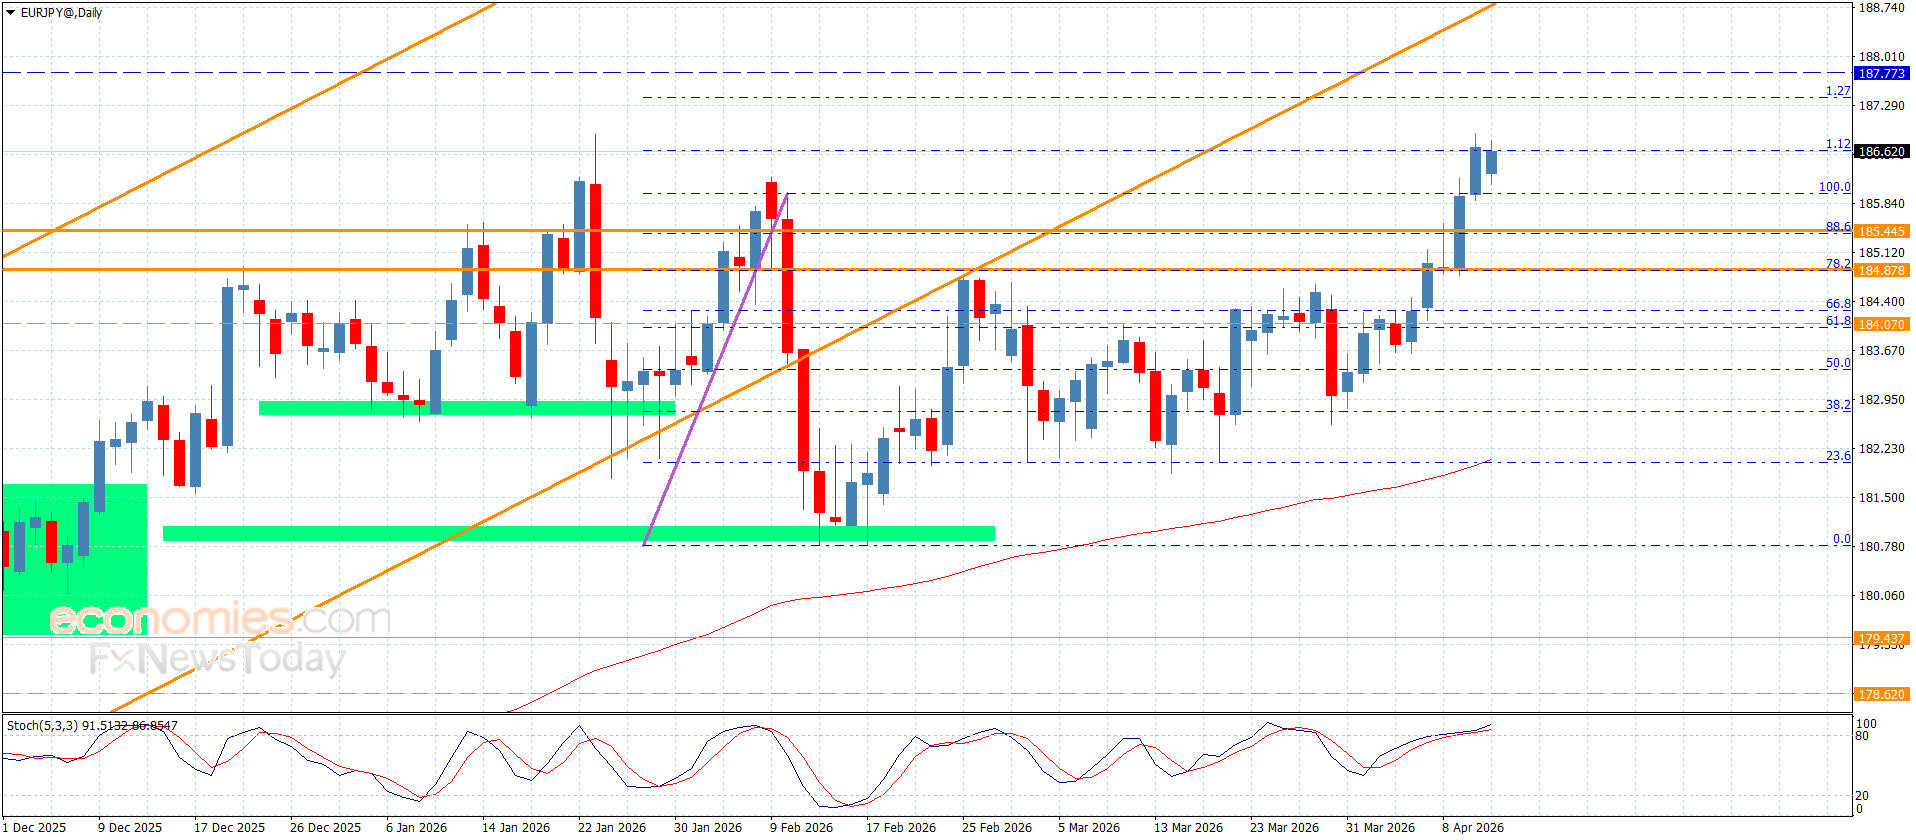
The EURJPY keeps rising– Forecast today – 14-4-2026

By |2026-04-14T21:31:44+02:00April 14, 2026|Forex News, News|0 Comments

Copper price resumed the bullish trend, taking advantage of the continuation of providing positive momentum by the main indicators, to reach $5.9700 barrier, followed by recording the suggested target in the previous report.


The price attempt to support this barrier supports the chances of targeting new positive stations confirms the importance of waiting for confirming the breach, to avoid any unexpected corrective rebound, while the extra positive stations that are located at $6.0850 reaching $6.2300 level.


The expected trading range for today is between $5.8800 and $6.0850


Trend forecast: Bullish


Source link

14 04, 2026

EUR/JPY Price Forecast: Remains close to near 187.50, fresh record highs

By |2026-04-14T17:30:10+02:00April 14, 2026|Forex News, News|0 Comments

EUR/JPY halts its three-day winning streak, inching lower after reaching all-time highs and trading around 187.40 during the European hours on Tuesday. The technical analysis of the daily chart indicates the currency cross is trending higher within an ascending channel, signaling a persistent bullish bias.

The EUR/JPY cross maintains a bullish near-term bias as it holds above both the nine-day and 50-day Exponential Moving Averages (EMAs). The alignment of the short-term above the long-term EMA suggests persistent upward pressure.

The Relative Strength Index (14) at 70.10 shows overbought conditions, hinting that upside momentum is strong but vulnerable to a corrective pause.

The EUR/JPY cross may target the immediate resistance at the all-time high of 187.54, recorded on April 14, followed by the upper boundary of the ascending channel around 187.80.

On the downside, the primary support lies at the nine-day EMA of 185.92. A move below this level could weaken the short-term price momentum, exposing the lower ascending channel boundary around 185.00, followed by the 50-day EMA at 184.07.

EUR/JPY: Daily Chart

(The technical analysis of this story was written with the help of an AI tool.)

Euro Price Today

The table below shows the percentage change of Euro (EUR) against listed major currencies today. Euro was the weakest against the New Zealand Dollar.

USD EUR GBP JPY CAD AUD NZD CHF
USD -0.15% -0.17% -0.21% -0.15% -0.04% -0.35% -0.28%
EUR 0.15% -0.02% -0.04% 0.00% 0.11% -0.21% -0.14%
GBP 0.17% 0.02% -0.02% 0.06% 0.12% -0.18% -0.13%
JPY 0.21% 0.04% 0.02% 0.06% 0.17% -0.14% -0.09%
CAD 0.15% -0.00% -0.06% -0.06% 0.11% -0.18% -0.14%
AUD 0.04% -0.11% -0.12% -0.17% -0.11% -0.30% -0.26%
NZD 0.35% 0.21% 0.18% 0.14% 0.18% 0.30% 0.05%
CHF 0.28% 0.14% 0.13% 0.09% 0.14% 0.26% -0.05%

The heat map shows percentage changes of major currencies against each other. The base currency is picked from the left column, while the quote currency is picked from the top row. For example, if you pick the Euro from the left column and move along the horizontal line to the US Dollar, the percentage change displayed in the box will represent EUR (base)/USD (quote).

Source link

14 04, 2026

GBP/USD Forecast: Seems poised to climb amid US-Iran optimism

By |2026-04-14T13:29:04+02:00April 14, 2026|Forex News, News|1 Comment

The GBP/USD pair is seen building on the previous day’s strong move up of around 125-pips and gaining some follow-through traction on Tuesday. This marks the seventh straight day of a positive move and lifts spot prices to the 1.3535-1.3540 region, or the highest since February 26, during the first half of the European session. Despite failed US-Iran peace talks over the weekend, investors continue to move towards riskier assets amid hopes that the door for diplomacy remains open and that negotiations would continue. This, in turn, undermines the safe-haven US Dollar (USD) and acts as a tailwind for the currency pair.

US Vice President JD Vance struck a cautiously optimistic tone on negotiations with Iran and suggested during an interview on Fox News that meaningful progress has been made even as talks have yet to deliver a breakthrough. Vance further added that the framework for a comprehensive agreement is achievable if Iran is willing to take the next step. Moreover, Reuters reported that negotiating teams from the US and Iran could return to Islamabad for another round of peace talks this week. The optimism, along with the uncertainty over future interest rate moves by the US Federal Reserve (Fed), drag the USD to its lowest level since early March and remains supportive of the bid tone surrounding the GBP/USD pair.

Signs of de-escalation of tensions in the Middle East keep Crude Oil prices depressed, easing inflationary fears and reviving bets for a potential interest rate cut by the Fed this year. Investors, however, remain worried about external energy shocks stemming from the instability in the Strait of Hormuz. In fact, US President Donald Trump said that the US Navy blockade on the strategic waterway has officially started, while Iran responded with threats on all ports in the Persian Gulf and the Gulf of Oman. This limits the downside for the black liquid, fueling worries about a possible spike in inflation. This, in turn, keeps the USD bulls on the sidelines and backs the case for a further appreciating move for the GBP/USD pair.

Meanwhile, market participants have ramped up bets on the Bank of England (BoE) tightening and are pricing in roughly three 25 basis points (bps) rate hikes in 2026, potentially starting in April, amid renewed inflation concerns. This marks a significant divergence in comparison to Fed expectations and validates the near-term positive outlook for the GBP/USD pair. Traders now look forward to the release of the US Producer Price Index (PPI), which, along with speeches from a slew of influential FOMC members, will drive the USD demand and provide some impetus to the currency pair. Nevertheless, the fundamental backdrop seems tilted in favor of bulls, suggesting that any corrective slide is likely to be bought into.

GBP/USD 4-hour chart

Technical Analysis:

The overnight move beyond the 1.3500 psychological mark comes on top of the recent breakout through the 200-period Simple Moving Average (SMA) on the 4-hour chart and favors the GBP/USD bulls. Adding to this, a positive Moving Average Convergence Divergence (MACD) reading suggests firm upside momentum. However, the Relative Strength Index (RSI) near 70 indicates that conditions are edging toward overbought, which could slow the advance rather than immediately reverse it.

On the topside, initial resistance is aligned with the 61.8% Fibonacci retracement level of the January-March fall, at 1.3867. On the downside, immediate support is seen at the 50% retracement at 1.3512, followed by the 38.2% level at 1.3429, while the 200-period SMA is near 1.3351 and the 23.6% Fibo. retracement at 1.3325 underpins the broader bullish structure ahead of stronger backing at 1.3158.

(The technical analysis of this story was written with the help of an AI tool.)

Source link

14 04, 2026

EUR/USD, GBP/USD and USD/JPY Forecasts – US Dollar Jumps on Risk Aversion

By |2026-04-14T09:28:03+02:00April 14, 2026|Forex News, News|0 Comments

The US dollar has jumped against the Japanese yen yet again during the trading session here on Monday as we are threatening the 160-yen level. I do believe it is probably only a matter of time before we do breakout, and this breakout is going to be a big deal.

It will have traders looking at the market through the prism of a breakout that goes all the way back to 1990. This could lead to a multi-year move. In the short term, though, it is probably more likely than not that we would see a little bit of a pullback. That pullback for me opens up a lot of value, especially if we see a drop and a bounce near the 158-yen level.

Source link

14 04, 2026

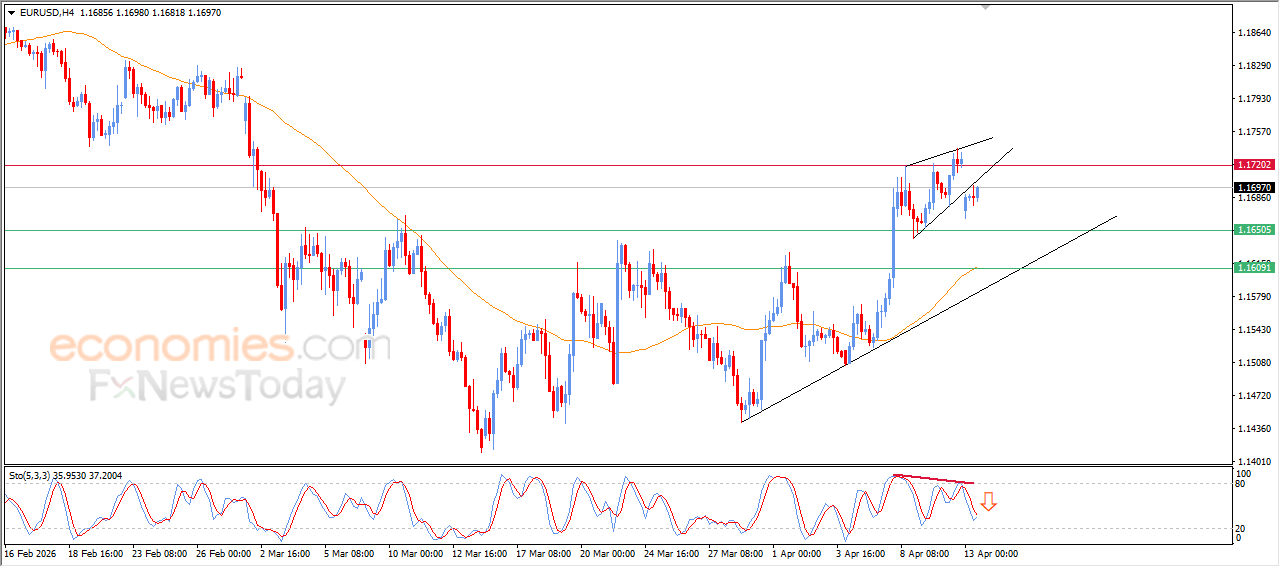
Forecast update for EURUSD -13-04-2026.

By |2026-04-14T05:27:04+02:00April 14, 2026|Forex News, News|0 Comments

No change for GBPJPY pair’s bullish track, due to its stability above 213.30 level, keeping its stability within the minor bullish channel levels, to notice recording 214.55 level on Friday, which forces it to provide mixed trading to reinforce the chances of gathering extra positive momentum.


Stochastic stability within the overbought level will reinforce the chances of targeting extra positive stations, to reach 215.00 to attempt to reach the next main target near 215.72, while the decline below 213.30 and providing negative close will force it to provide bearish corrective trading by reaching 212.60 and 212.05. 


The expected trading range for today is between 213.50 and 215.00


Trend forecast: Bullish


Source link

14 04, 2026

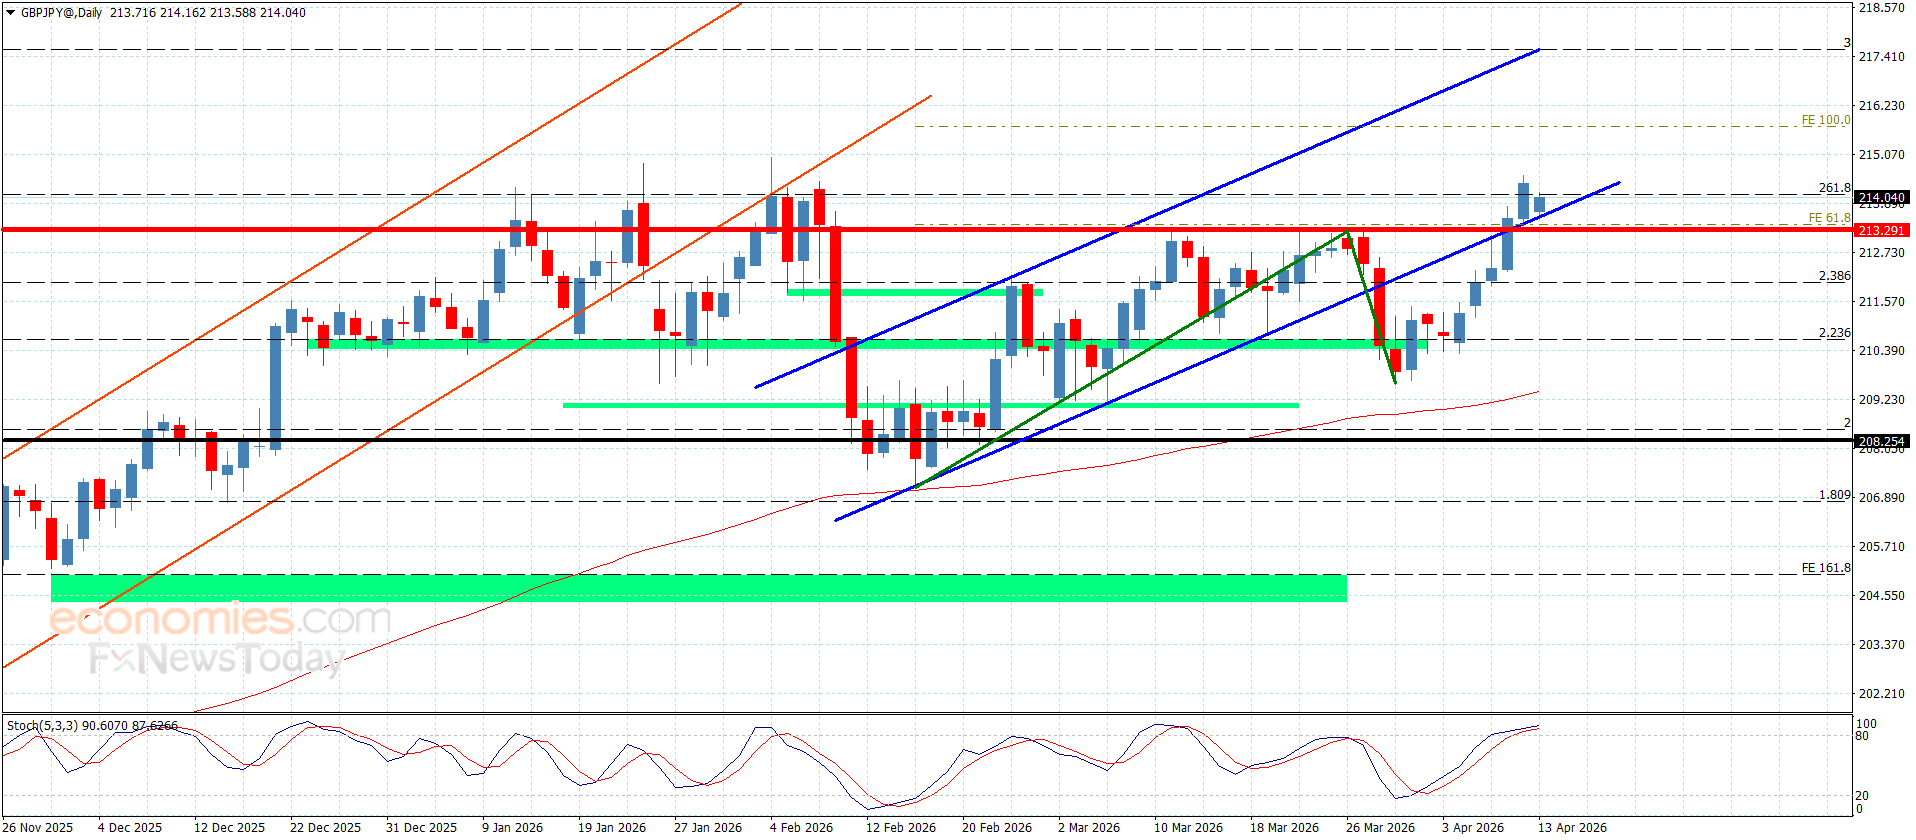
The GBPJPY repeats the positive closes– Forecast today – 13-4-2026

By |2026-04-14T01:26:03+02:00April 14, 2026|Forex News, News|0 Comments

No change for GBPJPY pair’s bullish track, due to its stability above 213.30 level, keeping its stability within the minor bullish channel levels, to notice recording 214.55 level on Friday, which forces it to provide mixed trading to reinforce the chances of gathering extra positive momentum.


Stochastic stability within the overbought level will reinforce the chances of targeting extra positive stations, to reach 215.00 to attempt to reach the next main target near 215.72, while the decline below 213.30 and providing negative close will force it to provide bearish corrective trading by reaching 212.60 and 212.05. 


The expected trading range for today is between 213.50 and 215.00


Trend forecast: Bullish


Source link

13 04, 2026

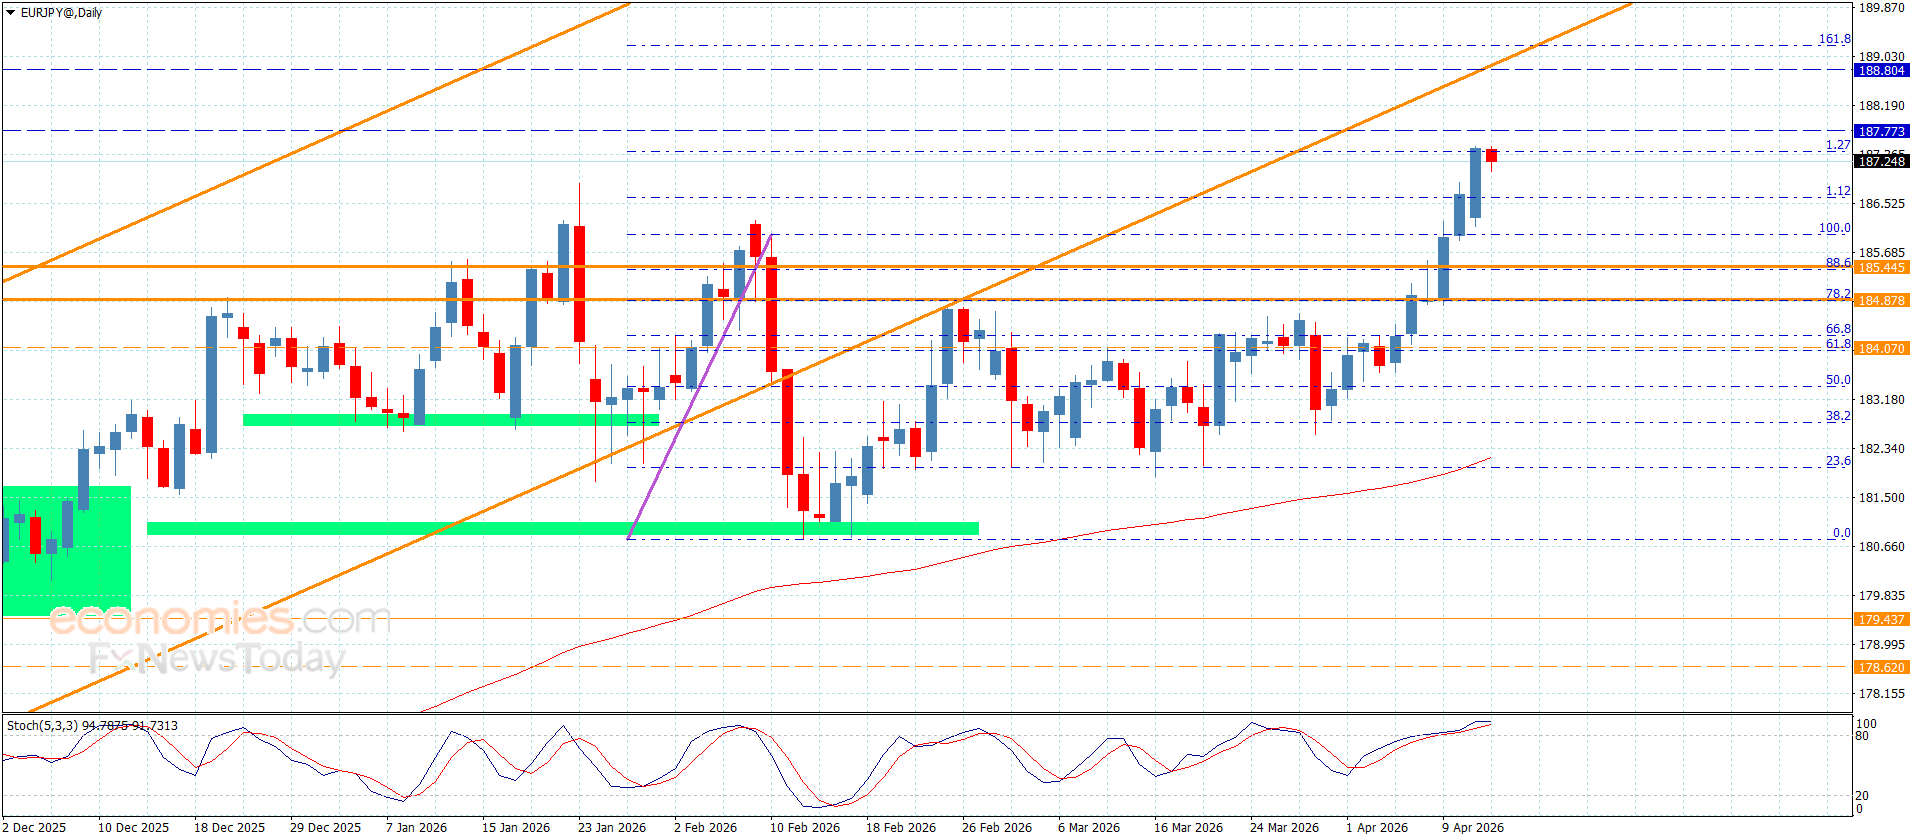
The EURJPY achieves the extra target– Forecast today – 13-4-2026

By |2026-04-13T21:24:59+02:00April 13, 2026|Forex News, News|0 Comments

No change for GBPJPY pair’s bullish track, due to its stability above 213.30 level, keeping its stability within the minor bullish channel levels, to notice recording 214.55 level on Friday, which forces it to provide mixed trading to reinforce the chances of gathering extra positive momentum.


Stochastic stability within the overbought level will reinforce the chances of targeting extra positive stations, to reach 215.00 to attempt to reach the next main target near 215.72, while the decline below 213.30 and providing negative close will force it to provide bearish corrective trading by reaching 212.60 and 212.05. 


The expected trading range for today is between 213.50 and 215.00


Trend forecast: Bullish


Source link

13 04, 2026

EUR/GBP Forecast: Euro’s Critical Hesitation at 0.8700 Signals Market Caution

By |2026-04-13T17:24:20+02:00April 13, 2026|Forex News, News|0 Comments

BitcoinWorld

EUR/GBP Forecast: Euro’s Critical Hesitation at 0.8700 Signals Market Caution

LONDON, March 2025 – The EUR/GBP currency pair demonstrates significant hesitation around the pivotal 0.8700 psychological level, reflecting deepening caution across global financial markets. This stall in momentum presents a critical juncture for forex traders and analysts, who now scrutinize a complex interplay of technical signals and fundamental economic pressures. Consequently, market participants await clearer directional cues from both the Eurozone and the United Kingdom, as monetary policy divergence and geopolitical uncertainties inject volatility into the cross. Therefore, understanding the dynamics at this key level is essential for navigating the near-term forex landscape.

EUR/GBP Forecast: Decoding the Technical Stalemate

The EUR/GBP’s consolidation near 0.8700 forms a compelling technical narrative. On daily charts, the pair has repeatedly tested this zone, establishing it as a formidable battleground between bullish and bearish forces. Specifically, the 50-day and 200-day simple moving averages converge nearby, often amplifying price sensitivity. Meanwhile, trading volume has contracted notably during this period, a classic sign of indecision before a potential breakout. Analysts frequently reference this pattern as a “coiling” or compression phase, where volatility typically expands following the period of tight range-bound action.

Key technical levels now frame the immediate forecast. Firstly, immediate resistance is observed between 0.8720 and 0.8740, a zone fortified by recent swing highs. Conversely, robust support resides near 0.8650, aligning with a prior consolidation area and the 38.2% Fibonacci retracement level from the late-2024 rally. A decisive close above or below these parameters will likely dictate the short-term trajectory. Furthermore, oscillators like the Relative Strength Index (RSI) hover near neutral territory, neither confirming overbought nor oversold conditions and thus offering little directional bias.

Chart Pattern Analysis and Historical Context

Historical price action provides crucial context for the current EUR/GBP forecast. The 0.8700 level has served as a significant pivot point multiple times over the past 18 months. For instance, a sustained break above this level in Q4 2024 preceded a 2.5% rally. Similarly, rejection from this zone in early 2025 led to a swift decline towards 0.8550. This repeated interaction reinforces its psychological and technical importance. Currently, the price action is carving a potential symmetrical triangle pattern, suggesting a period of equilibrium before a resolution. The measured move target from such a pattern typically projects a move of 150-200 pips following a confirmed breakout.

Fundamental Drivers Behind the Market Caution

The hesitation in the EUR/GBP pair is not merely a technical phenomenon; it is fundamentally rooted in a cautious macroeconomic landscape. Primarily, divergent central bank outlooks between the European Central Bank (ECB) and the Bank of England (BoE) create a complex backdrop. The ECB maintains a data-dependent stance, with recent inflation prints showing stubborn core components. Simultaneously, the BoE faces the dual mandate of controlling inflation while supporting fragile economic growth indicators. This policy uncertainty compels traders to adopt a wait-and-see approach, thereby suppressing sustained directional moves.

Several specific factors contribute to the prevailing market caution:

  • Inflation Data Disparity: Eurozone HICP inflation remains above target, while UK CPI shows signs of moderating, albeit unevenly across services and goods.
  • Growth Projections: Revised GDP forecasts from the IMF and OECD point to subdued growth in both regions, limiting aggressive central bank action.
  • Political Risk Premium: Upcoming electoral cycles in key EU member states and policy uncertainty in the UK post-Brexit adjustments add a layer of geopolitical risk.
  • Global Risk Sentiment: Broader market volatility, influenced by commodity prices and geopolitical tensions, flows through to major currency pairs like EUR/GBP.

Consequently, institutional flow data indicates a reduction in speculative positioning, with asset managers and hedge funds preferring to hold neutral or reduced exposure until these fundamental clouds clear. This reduction in participation naturally contributes to the pair’s hesitant price action around key technical levels.

Expert Analysis and Institutional EUR/GBP Forecasts

Leading financial institutions offer nuanced perspectives on the EUR/GBP forecast amidst the current stalemate. For example, analysis from major bank research desks often highlights the cross’s sensitivity to interest rate differentials, which have recently narrowed. “The market is effectively pricing in a delayed but parallel tightening path from both the ECB and BoE,” notes a senior currency strategist at a European investment bank. “This removes a primary directional driver, leaving the pair susceptible to secondary data shocks and technical flows.”

A survey of recent analyst reports reveals a consensus leaning towards continued range-bound trading in the immediate term, with a bias for a breakout contingent on a clear fundamental catalyst. The table below summarizes key institutional year-end targets for EUR/GBP:

Institution Q2 2025 Forecast Primary Rationale
Bank A Research 0.8750 Gradual ECB policy normalization outpacing BoE
Investment Firm B 0.8600 Stronger UK productivity data and fiscal support
Strategy Group C 0.8700 (Neutral) Balanced risks; view range-bound 0.8650-0.8800

This divergence in expert opinion itself underscores the high degree of uncertainty and the balanced risk profile currently associated with the currency pair. Moreover, options market pricing shows a slight skew towards puts (bearish bets) for longer-dated expiries, indicating a underlying, though not overwhelming, concern for euro weakness.

Impact on Traders and the Broader Financial Ecosystem

The EUR/GBP’s hesitation at 0.8700 has tangible implications. For retail and algorithmic traders, reduced volatility and directional clarity compress potential returns from trend-following strategies, shifting focus towards range-trading or volatility-breakout models. Meanwhile, corporate treasuries with exposure to Euro and Pound cash flows face challenges in hedging decisions, as the cost of options protection increases during periods of unresolved tension. Furthermore, the cross’s behavior often spills over into related asset classes, influencing UK and Eurozone equity flows, particularly for export-heavy sectors.

From a broader perspective, the pair’s stability—or lack thereof—acts as a barometer for European financial integration and relative economic health. A sustained break above 0.8700 could signal stronger confidence in the Eurozone’s economic convergence, whereas a failure might highlight persistent structural concerns or a relative UK recovery narrative. Therefore, market participants across the spectrum monitor this level not just for trading signals, but for deeper macroeconomic insights.

Conclusion

The EUR/GBP forecast remains tightly focused on the 0.8700 level, a nexus of technical significance and fundamental indecision. The pair’s current hesitation reflects a market in equilibrium, weighing divergent central bank policies, uneven economic data, and embedded geopolitical risks. Ultimately, a catalyst from upcoming inflation reports, central bank communications, or a shift in global risk appetite will likely be required to spark a sustained directional move. Until then, the prevailing market caution suggests continued range-bound trading, with vigilance for a breakout that could define the medium-term trend for this major European currency cross.

FAQs

Q1: Why is the 0.8700 level so important for EUR/GBP?
The 0.8700 level is a major psychological and technical pivot point. It has acted as both strong support and resistance multiple times in recent history, and it currently aligns with key moving averages, making it a focal point for trader decision-making and order placement.

Q2: What would cause the EUR/GBP to break decisively above 0.8700?
A sustained break above would likely require a fundamental shift, such as the ECB signaling a more hawkish policy path relative to the BoE, a significant upside surprise in Eurozone economic data, or a deterioration in UK-specific economic or political stability.

Q3: How does global risk sentiment affect EUR/GBP?
EUR/GBP can function as a European risk proxy. In ‘risk-off’ environments, traders may favor the Pound’s historical safe-haven attributes within Europe, potentially weighing on the cross. Conversely, ‘risk-on’ sentiment might benefit the euro if it fuels capital flows into Eurozone assets.

Q4: What are the key economic indicators to watch for the EUR/GBP forecast?
Critical indicators include CPI inflation prints and core inflation from both the Eurozone and UK, PMI (Purchasing Managers’ Index) data for services and manufacturing, quarterly GDP reports, and most importantly, the policy statements and meeting minutes from the ECB and Bank of England.

Q5: Is the current hesitation a sign of an impending large move?
While prolonged consolidation often precedes a significant volatility expansion, it is not a guaranteed predictor of direction. The subsequent move’s size and direction depend entirely on the nature of the fundamental catalyst that eventually breaks the equilibrium.

This post EUR/GBP Forecast: Euro’s Critical Hesitation at 0.8700 Signals Market Caution first appeared on BitcoinWorld.


Source link

Go to Top