The main tag of Forex News Today Articles.
You can use the search box below to find what you need.
[wd_asp id=1]

5 04, 2026

Weekly Forex Forecast 5th to 10th April 2026 (Charts)

By |2026-04-05T20:36:25+02:00April 5, 2026|Forex News, News|0 Comments

The gold market rallied a bit during the course of the trading week as we find ourselves above the $4,600 level again. Friday was of course Good Friday, so we had only a 4-day week, but ultimately this is a situation where traders are looking at this through the prism of risk appetite and of course rates.

The interest rates out there continue to be a bit of an issue for gold, and I think that could continue to be the case, but it does look like we are trying to turn things around. The market forming a perfect hammer during the previous week from the 50-week EMA is a technically beautiful buy signal.

But we need help from interest rates, and we need them to drop. I am personally keeping an eye on the 10-year yield; if it is below the 4.30 level, I believe at that point gold should do fairly well.

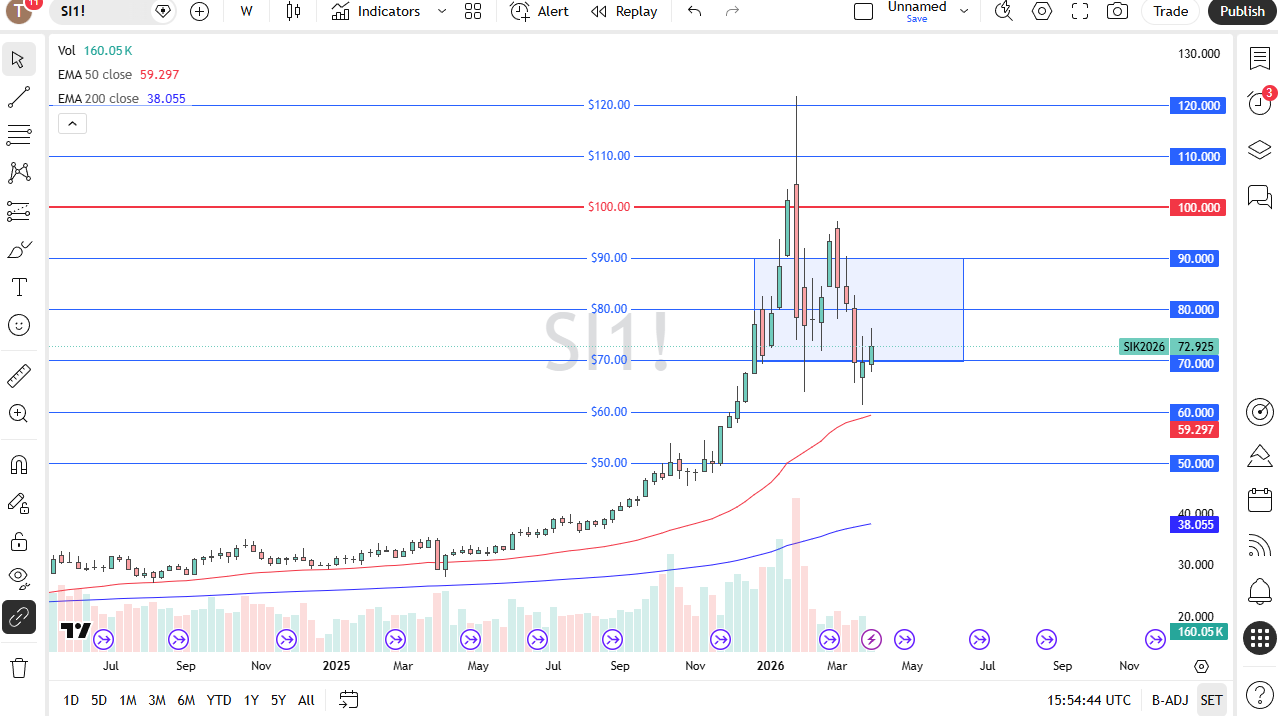
Silver is very much in the same boat here as we are above the $70 level, but it too is very sensitive to interest rates and what they are doing. The 10-year yield again is what I am watching here, with the 4.30% level being one that I am watching very closely and waiting to see whether or not we can get below there and sustain below there.

Weekly Forex Forecast 5th to 10th April 2026 (Charts)

At that point, I suspect that silver will really start to shine and have its day. Short-term pullbacks should continue to be buying opportunities, and the $70 level is an area that I am watching very closely at as support.

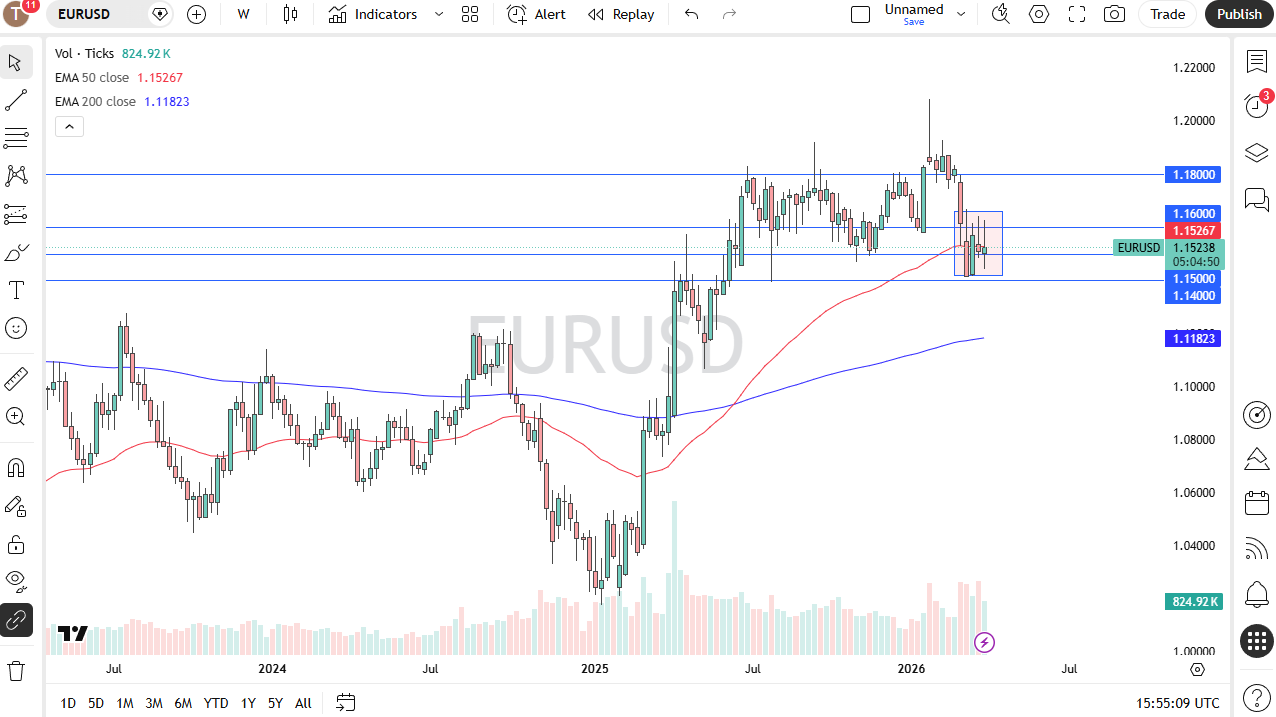
The euro has gone back and forth during the trading week, and we essentially have found ourselves hanging around the middle of the overall range. If the market were to break down from here, the 1.14 level should be supported, with the 1.1650 level above being resistant.

Weekly Forex Forecast 5th to 10th April 2026 (Charts)

Ultimately, I think this is a scenario where traders will continue to be very cognizant of what the interest rate differential is between the United States and particularly Germany, but the EU on the whole, and of course what the situation is in the Middle East. If the Middle East calms down, that should help the euro and vice versa.

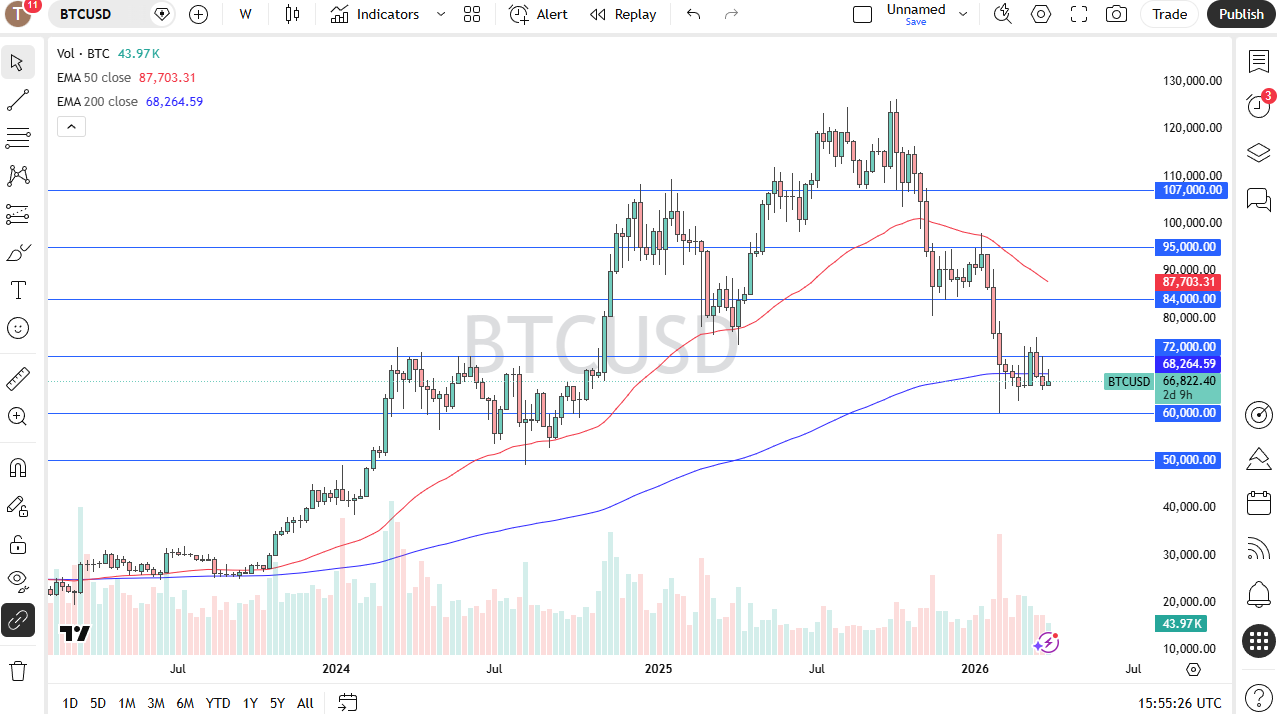
The Bitcoin market has been slightly positive for the week, but we continue to see a lot of noise at the moment, and I think you have to look at this through the prism of a market that is still doing everything it can to build up some type of base.

Weekly Forex Forecast 5th to 10th April 2026 (Charts)

I also recognize that it is a market that you are going to have to be very patient with. If we can break above the $72,000 level, that would be a very good sign.

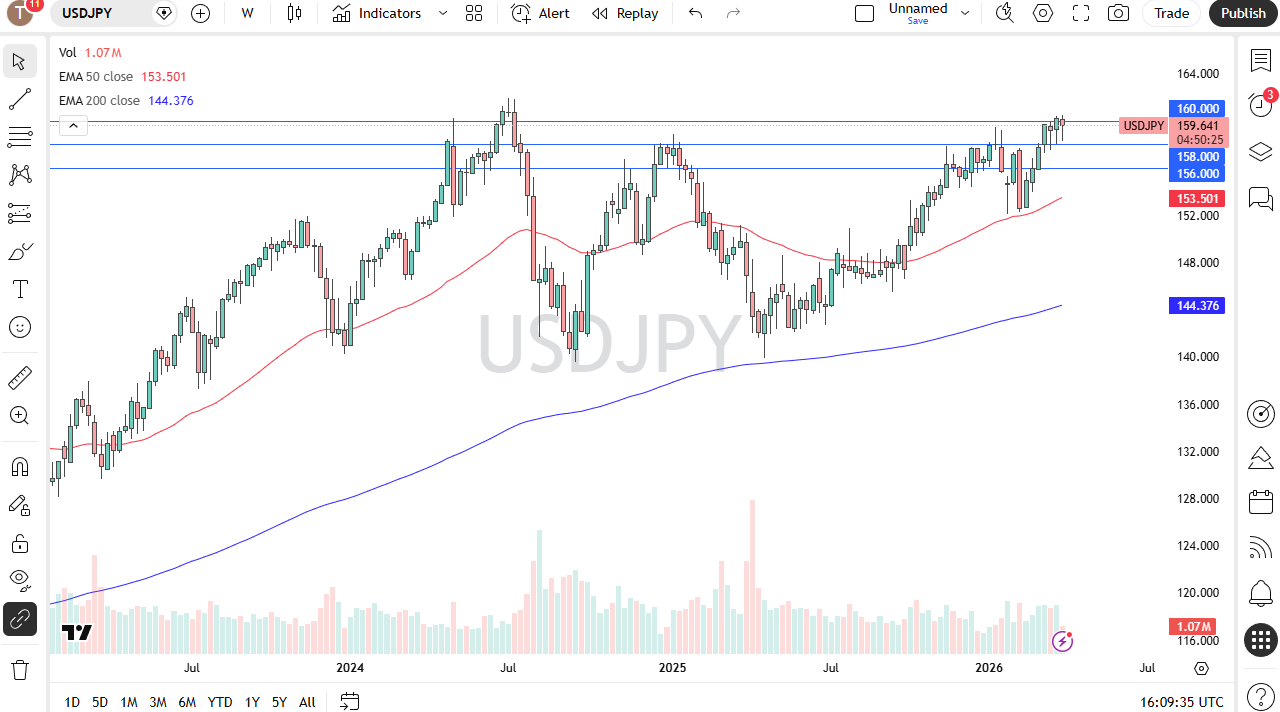
The US dollar initially fell against the Japanese yen for the trading week but found a bit of support as we continue to see the interest rate differential continue to be a major driver in this pair. The market initially pulled back just a bit over the last couple of weeks only to find plenty of buyers.

Weekly Forex Forecast 5th to 10th April 2026 (Charts)

The fact that we have formed 3 hammers in a row suggests that the US dollar is in fact squeezing the Japanese yen to the upside.

The 160¥ level continues to be an area of rather important resistance that I think extends to the 160.40 level. Breaking above there frees this market to go much higher.

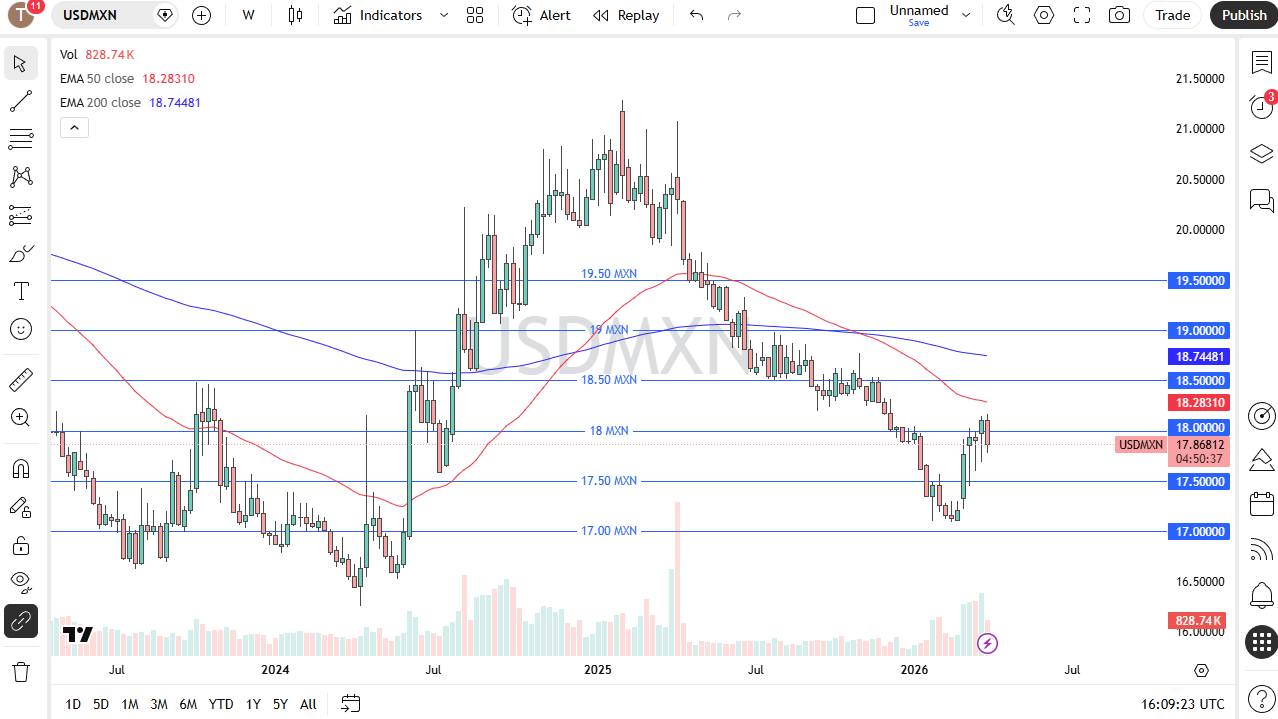
The US dollar pulled back against the Mexican peso, but it is still grinding along its path. The question is now that we have a bit of a pullback, will the buyers return or will this thing break down?

Weekly Forex Forecast 5th to 10th April 2026 (Charts)

I lay this solely at the feet of interest rates and how interest rates behave in the United States, so we will see how that plays out. But I do prefer shorting this pair over buying it.

If we get more of a risk-on type of move, then we have the possibility of a drift towards the 17.50 level. If we break to the upside, we could go as high as 18.50.

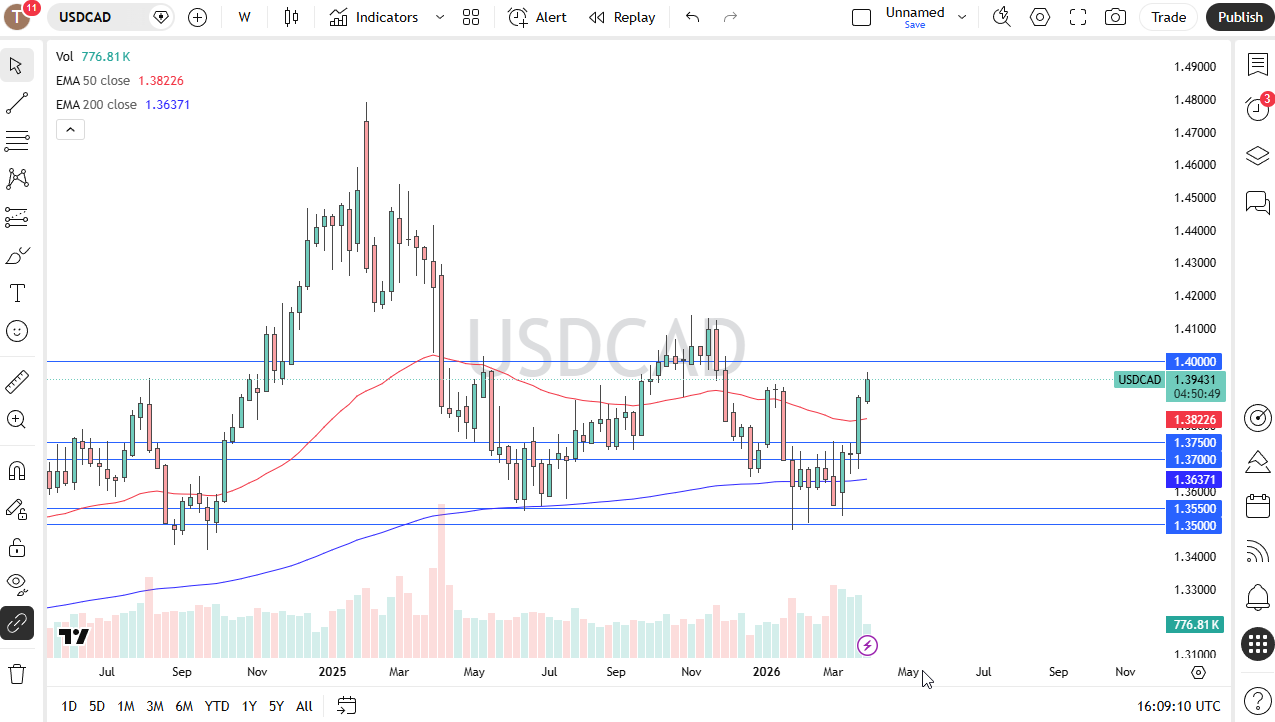
The US dollar rallied against the Canadian dollar again on the past week and it looks like we are trying to get to the 1.40 level. That being said, there is a lot of resistance in this area, so I am a little hesitant to get overly aggressive here.

Weekly Forex Forecast 5th to 10th April 2026 (Charts)

I believe that pullbacks continue to offer buying opportunities as the interest rate differential must certainly favor the US dollar.

It is a little overdone, so a red week might actually be good news.

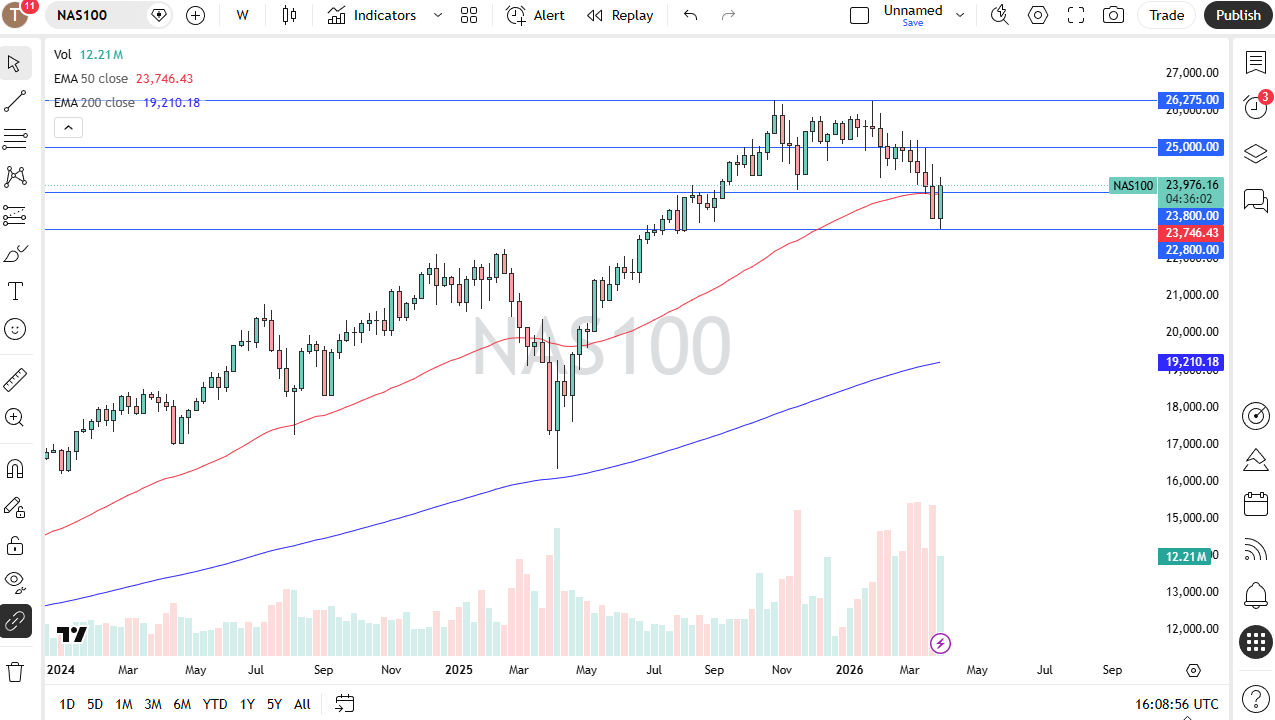
The Nasdaq 100 has formed a rather bullish candlestick over the last 4 days. Remember, Friday was Good Friday, so therefore the market was closed. If things are relatively calm over the weekend, we could see a situation where Nasdaq continues to recover.

Weekly Forex Forecast 5th to 10th April 2026 (Charts)

I certainly think there is a lot of interest there and there are a lot of people looking to buy stocks. The question now is whether or not the momentum will keep up.

I am bullish of this market; short-term pullbacks should be buying opportunities as, even though it sold off, considering that the United States is at war with Iran, it’s held up quite well.

Source link

5 04, 2026

US Dollar Soars on Risk Aversion and Critical PMI Data

By |2026-04-05T16:35:01+02:00April 5, 2026|Forex News, News|0 Comments

BitcoinWorld
BitcoinWorld
USD/JPY Gains Momentum: US Dollar Soars on Risk Aversion and Critical PMI Data

NEW YORK, March 2025 – The USD/JPY currency pair recorded significant gains in recent trading sessions, primarily driven by a stronger US Dollar benefiting from heightened global risk aversion and the latest Purchasing Managers’ Index (PMI) data. Consequently, traders witnessed a notable shift in forex market dynamics, reflecting broader economic uncertainties. This movement underscores the intricate relationship between macroeconomic indicators and currency valuations.

USD/JPY Gains Driven by Dual Market Forces

The recent appreciation of the USD/JPY pair stems from two concurrent factors. Firstly, a flight to safety among global investors bolstered demand for the US Dollar. Secondly, newly released PMI figures provided fundamental support for the greenback. Market analysts consistently monitor this currency pair as a key barometer for risk sentiment in the Asia-Pacific region and broader forex markets. Furthermore, the Bank of Japan’s persistent accommodative monetary policy continues to create a yield differential that favors the US Dollar.

Historical data reveals that the USD/JPY pair often exhibits heightened volatility during periods of economic uncertainty. For instance, the pair reacted sharply during previous geopolitical tensions and central bank policy shifts. The current rally aligns with patterns observed when traditional safe-haven assets, like US Treasuries, attract capital flows. Therefore, this movement is not an isolated event but part of a recognizable market behavior.

Deciphering the Impact of PMI Data on Forex

The Purchasing Managers’ Index serves as a crucial leading indicator for economic health. Stronger-than-expected US PMI data, particularly from the manufacturing and services sectors, signals robust economic activity. This strength directly supports the case for a resilient US Dollar. Conversely, weaker data from other major economies, including Japan, exacerbates the currency divergence.

Economists emphasize the data’s forward-looking nature. A PMI reading above 50 indicates expansion, while a reading below 50 suggests contraction. The latest US data surpassed expectations, reinforcing investor confidence in the underlying economy. This confidence translates into currency strength. Meanwhile, Japan’s latest figures presented a more mixed picture, failing to provide similar support for the Yen.

Expert Analysis on Risk Sentiment and Currency Flows

Financial strategists point to specific catalysts for the recent risk-off mood. Escalating tensions in key geopolitical regions and concerns over global growth projections have prompted investors to seek refuge. “The US Dollar’s role as the world’s primary reserve currency makes it a default destination during market stress,” explains a senior market analyst from a major investment bank. “When you combine this structural demand with positive domestic economic signals from PMIs, the upward pressure on USD/JPY becomes very clear.”

This analysis is supported by fund flow data showing increased allocations to US Dollar-denominated assets. The correlation between equity market declines and USD/JPY gains has strengthened noticeably. The table below summarizes the key data points influencing the recent move:

Indicator US Data Japan Data Market Impact
Manufacturing PMI 52.4 (Expansion) 48.7 (Contraction) Bullish for USD
Services PMI 54.1 (Strong Expansion) 51.2 (Modest Expansion) Bullish for USD
Composite PMI 53.5 50.1 Bullish for USD

Additionally, interest rate differentials remain a powerful driver. The Federal Reserve’s current policy stance, compared to the Bank of Japan’s, continues to make holding US Dollars more attractive for yield-seeking investors. This dynamic is especially potent in a low-risk-appetite environment where capital preservation becomes paramount.

Technical and Fundamental Outlook for Traders

From a technical perspective, the USD/JPY pair has broken through several key resistance levels. Chart analysts note increased trading volume accompanying the rise, confirming the move’s strength. The next significant resistance zone is now in focus, while support levels have been recalibrated higher. Traders are advised to monitor:

  • Key Resistance Levels: Previous highs and psychological price points.
  • Moving Averages: The 50-day and 200-day averages for trend confirmation.
  • Volatility Indicators: Gauges like the Average True Range (ATR) for risk assessment.

Fundamentally, the outlook hinges on upcoming economic releases and central bank communications. Any shift in the Federal Reserve’s tone or a surprise change from the Bank of Japan could rapidly alter the trajectory. Moreover, a resolution in geopolitical tensions could unwind some of the safe-haven flows supporting the Dollar. Therefore, maintaining a data-dependent view is essential for market participants.

Conclusion

The recent USD/JPY gains illustrate a classic market response to intertwined forces of risk aversion and solid economic data. The US Dollar’s strength, fueled by its safe-haven status and positive PMI readings, presents a clear narrative for forex traders. Moving forward, vigilance on incoming data and central bank policy will be critical for anticipating the next major move in this pivotal currency pair. The interplay between global risk sentiment and domestic economic indicators will continue to dictate the path for USD/JPY.

FAQs

Q1: What does a rising USD/JPY pair indicate?
A rising USD/JPY indicates the US Dollar is strengthening against the Japanese Yen. This typically occurs when investors favor the Dollar due to positive US economic data, higher US interest rates, or a global ‘risk-off’ environment where the Dollar is seen as a safe haven.

Q2: How does PMI data directly affect currency values?
PMI data acts as a leading indicator of economic health. A strong PMI reading suggests expanding business activity, which can lead to expectations of higher interest rates and stronger economic growth. This attracts foreign investment into that currency, increasing its demand and value.

Q3: Why is the US Dollar considered a safe-haven currency?
The US Dollar is considered a safe haven due to the size and stability of the US economy, the depth and liquidity of its financial markets, and the Dollar’s role as the world’s primary reserve currency. During global uncertainty, investors flock to US Treasury bonds and Dollar assets for perceived safety.

Q4: What other factors could reverse the current USD/JPY trend?
The trend could reverse if geopolitical tensions ease (reducing safe-haven demand), if US economic data weakens significantly, if the Bank of Japan signals a policy shift away from ultra-low rates, or if the Federal Reserve adopts a more dovish monetary policy stance than currently expected.

Q5: How do traders use this information in their strategies?
Traders incorporate this analysis by aligning their positions with the dominant fundamental trend (e.g., long USD/JPY during risk-off periods with strong US data). They use technical analysis to identify precise entry and exit points, manage risk with stop-loss orders, and stay informed through economic calendars for upcoming data releases that could impact the pair.

This post USD/JPY Gains Momentum: US Dollar Soars on Risk Aversion and Critical PMI Data first appeared on BitcoinWorld.

Source link

5 04, 2026

GBP JPY Chart & Rate – GBP JPY Trading

By |2026-04-05T12:34:03+02:00April 5, 2026|Forex News, News|0 Comments

When you trade your FOREX.com account on TradingView.com, you benefit from sharing ideas and custom scripts with their community of over 60 million traders and investors*.

Their industry-leading charts and tools have seen TradingView receive a 4.7 rating for its mobile app with over 10M downloads**, making it one of the top financial platforms.

Whether you are new to trading or a seasoned investor, TradingView delivers on our joint mission to help anyone succeed in financial markets.

*Published by TradingView.

**Based on TradingView App review on Google Play.

Source link

4 04, 2026

Bullish Momentum Builds Toward 184.00 as Critical 100-Day EMA Provides Solid Foundation

By |2026-04-04T00:25:14+02:00April 4, 2026|Forex News, News|0 Comments

BitcoinWorld

EUR/JPY Forecast: Bullish Momentum Builds Toward 184.00 as Critical 100-Day EMA Provides Solid Foundation

The EUR/JPY currency pair demonstrates remarkable resilience in early 2025 trading sessions, gathering substantial momentum toward the psychologically significant 184.00 resistance level. Market analysts observe sustained buying pressure as the cross maintains its position firmly above the critical 100-day Exponential Moving Average, signaling continued bullish potential for the Euro against the Japanese Yen. This technical configuration emerges against a complex macroeconomic backdrop involving divergent central bank policies between the European Central Bank and the Bank of Japan.

EUR/JPY Technical Analysis and Current Market Structure

Technical examination reveals the EUR/JPY pair trading at approximately 183.65 during the London session on March 15, 2025. The price action shows consistent higher lows since February, establishing a clear upward trajectory. Furthermore, the 100-day Exponential Moving Average currently sits at 182.40, providing dynamic support that has contained three separate retracement attempts over the past month. Consequently, each test of this moving average has attracted fresh buying interest, reinforcing its technical significance.

Market structure analysis indicates several key resistance levels ahead of the 184.00 target. Specifically, immediate resistance appears at 183.85, corresponding to the February 28 high. A decisive break above this level would likely accelerate momentum toward the primary target. Meanwhile, trading volume patterns show increased activity on upward movements compared to downward corrections, suggesting institutional accumulation. The Relative Strength Index currently reads 62, positioned in bullish territory but not yet overbought, indicating room for additional appreciation.

Comparative Technical Indicator Analysis

The following table illustrates key technical indicators supporting the bullish bias:

Technical Indicator Current Reading Bullish/Bearish Signal
100-day EMA 182.40 Strong Support
50-day EMA 181.85 Support
200-day EMA 180.20 Major Support
Daily RSI (14) 62 Bullish Momentum
MACD (12,26,9) +0.45 Bullish Crossover

Fundamental Drivers Behind EUR/JPY Strength

Multiple fundamental factors contribute to the EUR/JPY’s current technical posture. Primarily, the monetary policy divergence between the European Central Bank and the Bank of Japan creates favorable conditions for Euro appreciation. The ECB maintains a relatively hawkish stance compared to its Japanese counterpart, with market participants anticipating potential rate differential expansion through 2025. Additionally, improving Eurozone economic data, particularly from Germany and France, supports Euro strength against most major currencies.

Conversely, the Bank of Japan continues its ultra-accommodative monetary policy framework despite recent inflation readings exceeding targets. Governor Kazuo Ueda’s cautious approach to policy normalization provides ongoing support for the carry trade dynamic benefiting EUR/JPY bulls. Moreover, Japan’s Ministry of Finance has shown limited appetite for aggressive currency intervention at current levels, reducing downside risks for the pair. Global risk sentiment also plays a crucial role, with improving equity markets typically supporting Euro crosses against the traditionally safe-haven Japanese Yen.

Key Economic Data Points Influencing the Pair

  • Eurozone Inflation: February 2025 CPI at 2.4% year-over-year, within ECB target range
  • Japanese Wage Growth: Spring wage negotiations showing 3.8% average increase, below BOJ expectations
  • Interest Rate Differentials: Current spread favors Euro by 325 basis points
  • Commodity Prices: Energy price stability reduces Eurozone import costs
  • Manufacturing PMIs: Eurozone at 48.7 vs. Japan at 47.2, showing relative strength

Historical Context and Price Action Patterns

The EUR/JPY pair exhibits interesting historical patterns around the 184.00 level. Previously, this area served as significant resistance in November 2024, where the pair reversed from 184.15 to 179.80 over three weeks. However, the current technical structure differs substantially from that period. Specifically, the 100-day EMA now provides support approximately 180 pips below current prices, whereas in November it converged with the price action, offering weaker support. This technical improvement suggests greater sustainability for any breakout above 184.00.

Seasonal analysis reveals that March typically shows positive performance for EUR/JPY, with an average gain of 1.8% over the past decade. This seasonal tendency aligns with the current technical setup, potentially amplifying bullish momentum. Furthermore, options market data indicates increased demand for call options with strikes at 184.00 and 185.00, reflecting institutional positioning for further upside. The risk reversal metric, measuring the premium of calls over puts, shows its most bullish reading since January 2024, confirming positive sentiment.

Risk Factors and Potential Scenarios

Despite the constructive technical picture, several risk factors warrant monitoring. First, unexpected hawkish rhetoric from Bank of Japan officials could trigger rapid Yen appreciation, potentially testing the 100-day EMA support. Second, geopolitical tensions affecting European energy security might pressure the Euro disproportionately. Third, a significant deterioration in global risk appetite could revive safe-haven flows into the Japanese Yen. Technical traders should watch for a daily close below the 100-day EMA at 182.40, which would invalidate the current bullish bias and suggest deeper correction potential toward 181.00.

Market participants identify three primary scenarios for EUR/JPY development:

  1. Bullish Scenario (60% probability): Break above 184.00 with follow-through to 185.50-186.00 zone
  2. Consolidation Scenario (30% probability): Range-bound trading between 182.40 and 184.00
  3. Bearish Scenario (10% probability): Breakdown below 100-day EMA targeting 180.00 support

Expert Analysis and Institutional Perspective

Leading financial institutions provide nuanced views on the EUR/JPY outlook. Goldman Sachs currency strategists note that “carry trade dynamics remain favorable for EUR/JPY, with the interest rate differential likely to widen further in 2025.” Meanwhile, Nomura analysts emphasize technical factors, stating that “the 100-day EMA has provided reliable support since December, with each test attracting increased buying interest.” Bloomberg’s market sentiment indicator shows 68% of surveyed traders maintain bullish EUR/JPY positions, though this represents a decrease from 75% two weeks ago, suggesting some profit-taking has occurred.

Trading Strategy Considerations

For traders considering EUR/JPY positions, several strategic approaches merit consideration. Position traders might establish long positions on dips toward the 100-day EMA, using a break below 182.00 as a stop-loss level. Alternatively, swing traders could await a confirmed breakout above 184.00 with volume confirmation before entering positions. Risk management remains paramount, with position sizing reflecting the pair’s average daily range of approximately 85 pips. Options strategies, including bull call spreads targeting 185.00, offer defined-risk alternatives to outright long positions.

Technical traders should monitor several key developments. First, watch for consolidation patterns near 183.80-184.00 resistance. Second, observe volume patterns on any retest of the 100-day EMA support. Third, track correlation with other Yen crosses, particularly USD/JPY, for confirmation of broader Yen weakness. Finally, monitor bond yield differentials between German Bunds and Japanese Government Bonds, as widening spreads typically support EUR/JPY appreciation.

Conclusion

The EUR/JPY forecast maintains a constructive outlook as the pair gathers strength toward the 184.00 resistance level. The sustained position above the critical 100-day Exponential Moving Average provides technical confirmation of the bullish bias, supported by fundamental monetary policy divergence between the Eurozone and Japan. While several risk factors require monitoring, the current technical structure suggests higher probability of upward resolution. Market participants should watch for a decisive break above 184.00 with accompanying volume, which could open the path toward the 185.50-186.00 resistance zone identified in the EUR/JPY technical analysis.

FAQs

Q1: What is the significance of the 100-day EMA for EUR/JPY?
The 100-day Exponential Moving Average represents a key dynamic support level that has contained multiple downside attempts since December 2024. A sustained position above this indicator typically signals medium-term bullish momentum, while a break below suggests potential trend reversal.

Q2: What fundamental factors support EUR/JPY strength?
Monetary policy divergence between the ECB and BOJ provides the primary fundamental support, with the Eurozone maintaining higher interest rates. Additionally, improving Eurozone economic data and stable global risk sentiment contribute to Euro strength against the Japanese Yen.

Q3: What are the key resistance levels above 184.00?
Beyond 184.00, technical analysis identifies resistance at 184.50 (November 2024 high), 185.50 (psychological level and Fibonacci extension), and 186.20 (2024 yearly high). Each level represents potential profit-taking zones for bullish positions.

Q4: How does the carry trade affect EUR/JPY?
The positive interest rate differential between Eurozone and Japanese rates creates a carry trade incentive where investors borrow in low-yielding Yen to invest in higher-yielding Euro assets. This dynamic typically supports EUR/JPY appreciation during stable market conditions.

Q5: What would invalidate the current bullish EUR/JPY forecast?
A daily close below the 100-day Exponential Moving Average (currently 182.40) would challenge the bullish structure. Additionally, aggressive Bank of Japan policy normalization or significant deterioration in Eurozone economic data could reverse the current technical bias.

This post EUR/JPY Forecast: Bullish Momentum Builds Toward 184.00 as Critical 100-Day EMA Provides Solid Foundation first appeared on BitcoinWorld.

Source link

3 04, 2026

EUR/JPY Forecast: Bullish Momentum Builds Toward 184.00 as Critical 100-Day EMA Provides Solid Foundation

By |2026-04-03T20:24:25+02:00April 3, 2026|Forex News, News|0 Comments

BitcoinWorld

EUR/JPY Forecast: Bullish Momentum Builds Toward 184.00 as Critical 100-Day EMA Provides Solid Foundation

The EUR/JPY currency pair demonstrates remarkable resilience in early 2025 trading sessions, gathering substantial momentum toward the psychologically significant 184.00 resistance level. Market analysts observe sustained buying pressure as the cross maintains its position firmly above the critical 100-day Exponential Moving Average, signaling continued bullish potential for the Euro against the Japanese Yen. This technical configuration emerges against a complex macroeconomic backdrop involving divergent central bank policies between the European Central Bank and the Bank of Japan.

EUR/JPY Technical Analysis and Current Market Structure

Technical examination reveals the EUR/JPY pair trading at approximately 183.65 during the London session on March 15, 2025. The price action shows consistent higher lows since February, establishing a clear upward trajectory. Furthermore, the 100-day Exponential Moving Average currently sits at 182.40, providing dynamic support that has contained three separate retracement attempts over the past month. Consequently, each test of this moving average has attracted fresh buying interest, reinforcing its technical significance.

Market structure analysis indicates several key resistance levels ahead of the 184.00 target. Specifically, immediate resistance appears at 183.85, corresponding to the February 28 high. A decisive break above this level would likely accelerate momentum toward the primary target. Meanwhile, trading volume patterns show increased activity on upward movements compared to downward corrections, suggesting institutional accumulation. The Relative Strength Index currently reads 62, positioned in bullish territory but not yet overbought, indicating room for additional appreciation.

Comparative Technical Indicator Analysis

The following table illustrates key technical indicators supporting the bullish bias:

Technical Indicator Current Reading Bullish/Bearish Signal
100-day EMA 182.40 Strong Support
50-day EMA 181.85 Support
200-day EMA 180.20 Major Support
Daily RSI (14) 62 Bullish Momentum
MACD (12,26,9) +0.45 Bullish Crossover

Fundamental Drivers Behind EUR/JPY Strength

Multiple fundamental factors contribute to the EUR/JPY’s current technical posture. Primarily, the monetary policy divergence between the European Central Bank and the Bank of Japan creates favorable conditions for Euro appreciation. The ECB maintains a relatively hawkish stance compared to its Japanese counterpart, with market participants anticipating potential rate differential expansion through 2025. Additionally, improving Eurozone economic data, particularly from Germany and France, supports Euro strength against most major currencies.

Conversely, the Bank of Japan continues its ultra-accommodative monetary policy framework despite recent inflation readings exceeding targets. Governor Kazuo Ueda’s cautious approach to policy normalization provides ongoing support for the carry trade dynamic benefiting EUR/JPY bulls. Moreover, Japan’s Ministry of Finance has shown limited appetite for aggressive currency intervention at current levels, reducing downside risks for the pair. Global risk sentiment also plays a crucial role, with improving equity markets typically supporting Euro crosses against the traditionally safe-haven Japanese Yen.

Key Economic Data Points Influencing the Pair

  • Eurozone Inflation: February 2025 CPI at 2.4% year-over-year, within ECB target range
  • Japanese Wage Growth: Spring wage negotiations showing 3.8% average increase, below BOJ expectations
  • Interest Rate Differentials: Current spread favors Euro by 325 basis points
  • Commodity Prices: Energy price stability reduces Eurozone import costs
  • Manufacturing PMIs: Eurozone at 48.7 vs. Japan at 47.2, showing relative strength

Historical Context and Price Action Patterns

The EUR/JPY pair exhibits interesting historical patterns around the 184.00 level. Previously, this area served as significant resistance in November 2024, where the pair reversed from 184.15 to 179.80 over three weeks. However, the current technical structure differs substantially from that period. Specifically, the 100-day EMA now provides support approximately 180 pips below current prices, whereas in November it converged with the price action, offering weaker support. This technical improvement suggests greater sustainability for any breakout above 184.00.

Seasonal analysis reveals that March typically shows positive performance for EUR/JPY, with an average gain of 1.8% over the past decade. This seasonal tendency aligns with the current technical setup, potentially amplifying bullish momentum. Furthermore, options market data indicates increased demand for call options with strikes at 184.00 and 185.00, reflecting institutional positioning for further upside. The risk reversal metric, measuring the premium of calls over puts, shows its most bullish reading since January 2024, confirming positive sentiment.

Risk Factors and Potential Scenarios

Despite the constructive technical picture, several risk factors warrant monitoring. First, unexpected hawkish rhetoric from Bank of Japan officials could trigger rapid Yen appreciation, potentially testing the 100-day EMA support. Second, geopolitical tensions affecting European energy security might pressure the Euro disproportionately. Third, a significant deterioration in global risk appetite could revive safe-haven flows into the Japanese Yen. Technical traders should watch for a daily close below the 100-day EMA at 182.40, which would invalidate the current bullish bias and suggest deeper correction potential toward 181.00.

Market participants identify three primary scenarios for EUR/JPY development:

  1. Bullish Scenario (60% probability): Break above 184.00 with follow-through to 185.50-186.00 zone
  2. Consolidation Scenario (30% probability): Range-bound trading between 182.40 and 184.00
  3. Bearish Scenario (10% probability): Breakdown below 100-day EMA targeting 180.00 support

Expert Analysis and Institutional Perspective

Leading financial institutions provide nuanced views on the EUR/JPY outlook. Goldman Sachs currency strategists note that “carry trade dynamics remain favorable for EUR/JPY, with the interest rate differential likely to widen further in 2025.” Meanwhile, Nomura analysts emphasize technical factors, stating that “the 100-day EMA has provided reliable support since December, with each test attracting increased buying interest.” Bloomberg’s market sentiment indicator shows 68% of surveyed traders maintain bullish EUR/JPY positions, though this represents a decrease from 75% two weeks ago, suggesting some profit-taking has occurred.

Trading Strategy Considerations

For traders considering EUR/JPY positions, several strategic approaches merit consideration. Position traders might establish long positions on dips toward the 100-day EMA, using a break below 182.00 as a stop-loss level. Alternatively, swing traders could await a confirmed breakout above 184.00 with volume confirmation before entering positions. Risk management remains paramount, with position sizing reflecting the pair’s average daily range of approximately 85 pips. Options strategies, including bull call spreads targeting 185.00, offer defined-risk alternatives to outright long positions.

Technical traders should monitor several key developments. First, watch for consolidation patterns near 183.80-184.00 resistance. Second, observe volume patterns on any retest of the 100-day EMA support. Third, track correlation with other Yen crosses, particularly USD/JPY, for confirmation of broader Yen weakness. Finally, monitor bond yield differentials between German Bunds and Japanese Government Bonds, as widening spreads typically support EUR/JPY appreciation.

Conclusion

The EUR/JPY forecast maintains a constructive outlook as the pair gathers strength toward the 184.00 resistance level. The sustained position above the critical 100-day Exponential Moving Average provides technical confirmation of the bullish bias, supported by fundamental monetary policy divergence between the Eurozone and Japan. While several risk factors require monitoring, the current technical structure suggests higher probability of upward resolution. Market participants should watch for a decisive break above 184.00 with accompanying volume, which could open the path toward the 185.50-186.00 resistance zone identified in the EUR/JPY technical analysis.

FAQs

Q1: What is the significance of the 100-day EMA for EUR/JPY?
The 100-day Exponential Moving Average represents a key dynamic support level that has contained multiple downside attempts since December 2024. A sustained position above this indicator typically signals medium-term bullish momentum, while a break below suggests potential trend reversal.

Q2: What fundamental factors support EUR/JPY strength?
Monetary policy divergence between the ECB and BOJ provides the primary fundamental support, with the Eurozone maintaining higher interest rates. Additionally, improving Eurozone economic data and stable global risk sentiment contribute to Euro strength against the Japanese Yen.

Q3: What are the key resistance levels above 184.00?
Beyond 184.00, technical analysis identifies resistance at 184.50 (November 2024 high), 185.50 (psychological level and Fibonacci extension), and 186.20 (2024 yearly high). Each level represents potential profit-taking zones for bullish positions.

Q4: How does the carry trade affect EUR/JPY?
The positive interest rate differential between Eurozone and Japanese rates creates a carry trade incentive where investors borrow in low-yielding Yen to invest in higher-yielding Euro assets. This dynamic typically supports EUR/JPY appreciation during stable market conditions.

Q5: What would invalidate the current bullish EUR/JPY forecast?
A daily close below the 100-day Exponential Moving Average (currently 182.40) would challenge the bullish structure. Additionally, aggressive Bank of Japan policy normalization or significant deterioration in Eurozone economic data could reverse the current technical bias.

This post EUR/JPY Forecast: Bullish Momentum Builds Toward 184.00 as Critical 100-Day EMA Provides Solid Foundation first appeared on BitcoinWorld.
Source link

3 04, 2026

Critical Test at Nine-Day EMA Support After Sharp Slide Below 184.00

By |2026-04-03T12:22:07+02:00April 3, 2026|Forex News, News|0 Comments

BitcoinWorld

EUR/JPY Forecast: Critical Test at Nine-Day EMA Support After Sharp Slide Below 184.00

LONDON, March 21, 2025 – The EUR/JPY currency pair faces a pivotal technical juncture, testing its nine-day Exponential Moving Average (EMA) for support after decisively easing below the psychologically significant 184.00 level. This movement sparks intense scrutiny among forex traders and analysts globally, as the pair’s behavior at this technical level could signal the next directional trend for the Euro against the Japanese Yen. Consequently, market participants are closely monitoring price action for confirmation of either a rebound or a deeper correction.

EUR/JPY Technical Analysis: Decoding the Current Price Action

The recent price decline below 184.00 marks a notable shift in short-term momentum for the EUR/JPY cross. Currently, the pair is probing the nine-day EMA, a widely watched short-term trend indicator. A sustained hold above this moving average often suggests the underlying uptrend remains intact. Conversely, a decisive break below could indicate accelerating selling pressure. Furthermore, traders are examining other key technical levels, including the 50-day Simple Moving Average (SMA) and recent swing lows, to gauge potential support zones. The Relative Strength Index (RSI), a momentum oscillator, is also being monitored for signs of being oversold, which might precede a technical bounce.

Market analysts highlight the importance of volume during this test. For instance, a rebound from the EMA on high volume would carry more conviction than a low-volume move. Additionally, the broader chart pattern, whether the pair is in a consolidation phase or a corrective pullback within a larger trend, provides essential context. This technical confluence makes the current price area a critical battleground between bullish and bearish forces in the forex market.

Fundamental Drivers Behind the Euro Yen Exchange Rate

Beyond the charts, fundamental forces exert significant pressure on the EUR/JPY pair. Primarily, the monetary policy divergence between the European Central Bank (ECB) and the Bank of Japan (BoJ) remains a core driver. The ECB’s path regarding interest rate cuts, inflation data from the Eurozone, and overall economic growth projections directly influence the Euro’s strength. Simultaneously, the BoJ’s ultra-accommodative stance, any subtle shifts in its Yield Curve Control (YCC) policy, and Japan’s own inflation and wage growth data impact the Yen’s valuation.

Global risk sentiment also plays a crucial role. Typically, the Japanese Yen acts as a traditional safe-haven currency. Therefore, during periods of market uncertainty or risk aversion, the Yen often strengthens, putting downward pressure on EUR/JPY. Conversely, a “risk-on” environment can see capital flow out of the Yen, potentially supporting the cross. Recent geopolitical developments and global equity market performance are, therefore, key factors in the pair’s daily fluctuations.

Expert Analysis and Market Impact

Financial institutions provide continuous analysis on major currency pairs. According to recent research notes from major banks, the focus is on whether the current pullback represents a healthy correction or the start of a more profound trend reversal. Some analysts point to resilient Eurozone economic data as a potential floor for the Euro. Others emphasize the BoJ’s potential to eventually normalize policy, which could provide structural support for the Yen. This expert debate underscores the complexity of forecasting forex movements, where technical signals and fundamental narratives must be weighed together.

The implications are significant for various market participants. For multinational corporations, volatility in EUR/JPY affects hedging costs and international revenue. For retail and institutional traders, clear breaks of key levels like the nine-day EMA often trigger automated trading systems and stop-loss orders, which can amplify short-term moves. Therefore, understanding the technical landscape is not just an academic exercise but a practical necessity for managing exposure and risk in the foreign exchange market.

Historical Context and Comparative Performance

Placing the current price action in historical context offers valuable perspective. The EUR/JPY pair has experienced considerable volatility over the past decade, influenced by events like the European debt crisis, Abenomics in Japan, and the global pandemic. Comparing the current test of the nine-day EMA to similar historical instances can reveal probabilistic outcomes. For example, data might show that following a break below a round number like 184.00, the pair finds support at the nine-day EMA approximately 60% of the time before resuming its prior trend.

It is also instructive to compare EUR/JPY’s performance to other Yen crosses, such as GBP/JPY or AUD/JPY. If the Yen is strengthening broadly across the board, the move in EUR/JPY is likely part of a wider Yen appreciation story. However, if EUR/JPY is underperforming its peers, the weakness may be more isolated to the Euro itself. This comparative analysis helps traders isolate the primary source of currency movement.

Conclusion

The EUR/JPY forecast hinges on the outcome of the current test at the nine-day EMA support following its decline below 184.00. This technical event sits at the intersection of significant fundamental forces, including central bank policy divergence and global risk sentiment. Traders should monitor for a confirmed bounce or breakdown from this level, supported by volume and momentum indicators, while keeping a close watch on upcoming economic data from both the Eurozone and Japan. The pair’s next sustained move will likely depend on which narrative—technical support or fundamental pressure—ultimately prevails in the forex market.

FAQs

Q1: What does testing the nine-day EMA mean for EUR/JPY?
The nine-day Exponential Moving Average is a short-term trend indicator. Testing it means the price is interacting with this dynamic support/resistance level. A hold suggests the recent trend may continue, while a break can signal a trend change.

Q2: Why is the 184.00 level psychologically significant?
Round numbers like 184.00 often act as psychological barriers in trading. They are easy reference points where many traders place orders, making them areas of concentrated liquidity and potential increased volatility.

Q3: What fundamental factors most affect the EUR/JPY exchange rate?
The primary drivers are the monetary policy difference between the ECB and BoJ, relative economic growth and inflation in the Eurozone versus Japan, and broader global market risk sentiment.

Q4: How does risk sentiment impact EUR/JPY?
The Japanese Yen is considered a safe-haven currency. In “risk-off” market environments, demand for the Yen typically increases, which can push EUR/JPY lower. In “risk-on” environments, the pair may rise as investors seek higher-yielding assets.

Q5: What should traders watch next after this EMA test?
Traders should watch for a confirmed close above or below the EMA, supported by technical indicators like volume and RSI. They should also monitor upcoming economic calendars for key data releases from both Europe and Japan that could impact central bank policy expectations.

This post EUR/JPY Forecast: Critical Test at Nine-Day EMA Support After Sharp Slide Below 184.00 first appeared on BitcoinWorld.
Source link

3 04, 2026

Critical Test At Nine-Day EMA Support After Sharp Slide Below 184.00

By |2026-04-03T08:19:53+02:00April 3, 2026|Forex News, News|0 Comments


EUR/JPY Forecast: Critical Test At Nine-Day EMA Support After Sharp Slide Below 184.00


Skip to content


Source link

3 04, 2026

Renewed Risk Aversion Causes Euro to Lose All Gains (Chart)

By |2026-04-03T04:17:46+02:00April 3, 2026|Forex News, News|0 Comments

EUR/USD Analysis Summary Today

EUR/USD Trading Signals:

Buy Scenario:

Sell Scenario:

Technical Analysis of EUR/USD Today

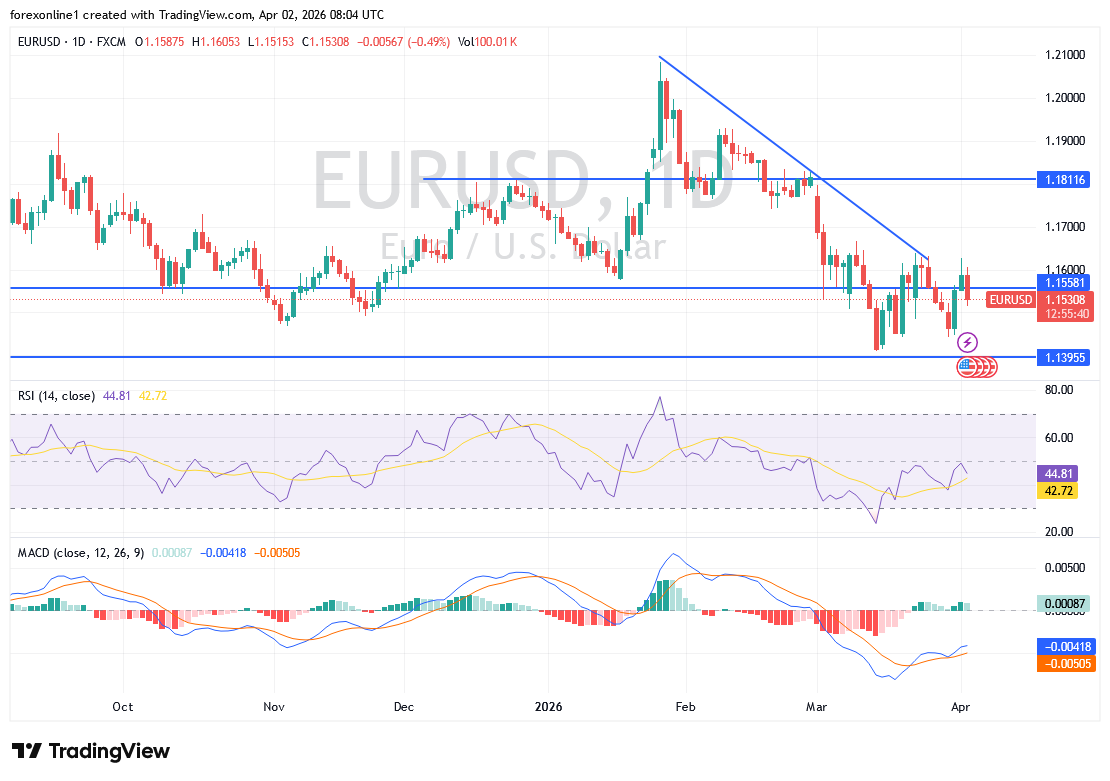
Renewed risk aversion, amid ambiguity regarding the resolution of the Middle East conflict after a period of relative market calm, has caused the EUR/USD pair to lose most of its recent upward rebound gains. This rebound peaked with a test of the 1.1626 resistance level before falling back to trade around the 1.1520 support level at the time of writing. I previously noted on the free trading recommendations page to sell EUR/USD from the 1.1660 resistance, and that recommendation remains valid.

Euro Path Depends on Improved Sentiment

According to recent currency market trading, investor sentiment improved following U.S. President Donald Trump’s statements mid-week, which suggested a possible withdrawal of U.S. forces from Iran within two to three weeks. He also hinted that a resolution might no longer depend on Iran reopening the Strait of Hormuz, boosting hopes for a return to normal maritime traffic once hostilities subside.

However, these hopes quickly faded. Yesterday, Trump stated that the U.S. operation is nearing its end but also pledged more decisive actions, including the possibility of strikes on power plants within the next two to three weeks. The absence of new justifications for the war has further dampened market confidence.

Amid ongoing uncertainty and rising inflation fears, markets are reconsidering their expectations for the European Central Bank’s (ECB) monetary policy path. In this regard, investors are now anticipating three interest rate hikes during 2026.

EUR/USD Technical Levels Today:

The bearish scenario for the Euro against the U.S. Dollar remains the most prominent on the daily chart. Stabilizing below the 1.1500 level supports this performance, confirmed by the 14-day Relative Strength Index (RSI) reading of 45, which is below the neutral 50 line—the dividing line between bear and bull control over the trend. Additionally, the 100-day Simple Moving Average (SMA) is below the 200-day SMA, supporting the continuation of the bearish correction for some time.

For a bullish scenario, the Euro must head toward the 1.1660 and 1.1800 resistance levels, respectively. The pair will continue to react to investor appetite for risk, the proximity of a resolution to the Middle East conflict, and the path of central bank policies in the coming months.

Currently, if optimism persists regarding the possibility of de-escalation, continued weakness in the US dollar could support the euro, given the inverse relationship between the two currencies. On the other hand, if peace hopes begin to fade and the US dollar strengthens, the euro could face renewed pressure.

Trading Advice:

Dear TradersUp trader, we still prefer selling the euro against the US dollar on any significant price rise.

Ready to trade our Forex daily analysis and predictions? Here are the top UK forex trading platforms to choose from.

Source link

3 04, 2026

Holds in a tight range between 50-day and 100-day SMAs

By |2026-04-03T00:17:08+02:00April 3, 2026|Forex News, News|0 Comments

GBP/JPY trades with a mild downside bias on Thursday, though it lacks strong follow-through selling and trims part of its intraday losses as markets remain volatile. Ongoing US-Israel war with Iran keeps sentiment fragile, weighing on the British Pound (GBP), while the Japanese Yen (JPY) holds firm across major peers except the US Dollar (USD) and Canadian Dollar (CAD).

At the time of writing, the cross is trading around 210.90, attempting a rebound after sliding to 210.35 during the Asian session.

From a technical perspective, the daily chart shows near-term consolidation, with prices trapped between the 100-day and 50-day Simple Moving Average (SMAs) at 210.21 and 211.27, respectively.

Momentum indicators suggest a mildly bearish undertone. The Relative Strength Index (RSI) hovers around 46, holding below the neutral 50 mark, indicating subdued buying interest.

Meanwhile, the Moving Average Convergence Divergence (MACD) shows early signs of weakening momentum, with the MACD line slipping below the signal line and the histogram turning slightly negative.

On the downside, a decisive break below the 100-day SMA could expose the 207.50 support zone, which marks the February swing low. A sustained move below this level would shift focus toward the 200-day SMA near 205.00.

On the upside, a recovery above the 50-day SMA would be needed to ease immediate downside pressure. A sustained break higher could open the door toward the 213.50 resistance area, marked by recent highs, followed by the February peak near 215.00.

Japanese Yen Price Today

The table below shows the percentage change of Japanese Yen (JPY) against listed major currencies today. Japanese Yen was the strongest against the British Pound.

USD EUR GBP JPY CAD AUD NZD CHF
USD 0.55% 0.71% 0.53% 0.31% 0.67% 0.70% 0.59%
EUR -0.55% 0.16% -0.07% -0.27% 0.13% 0.16% 0.02%
GBP -0.71% -0.16% -0.21% -0.40% -0.03% 0.01% -0.14%
JPY -0.53% 0.07% 0.21% -0.21% 0.15% 0.18% 0.06%
CAD -0.31% 0.27% 0.40% 0.21% 0.36% 0.38% 0.26%
AUD -0.67% -0.13% 0.03% -0.15% -0.36% 0.03% -0.13%
NZD -0.70% -0.16% -0.01% -0.18% -0.38% -0.03% -0.14%
CHF -0.59% -0.02% 0.14% -0.06% -0.26% 0.13% 0.14%

The heat map shows percentage changes of major currencies against each other. The base currency is picked from the left column, while the quote currency is picked from the top row. For example, if you pick the Japanese Yen from the left column and move along the horizontal line to the US Dollar, the percentage change displayed in the box will represent JPY (base)/USD (quote).

Source link

2 04, 2026

The EURJPY awaits the negative momentum– Forecast today – 2-4-2026

By |2026-04-02T20:16:08+02:00April 2, 2026|Forex News, News|0 Comments

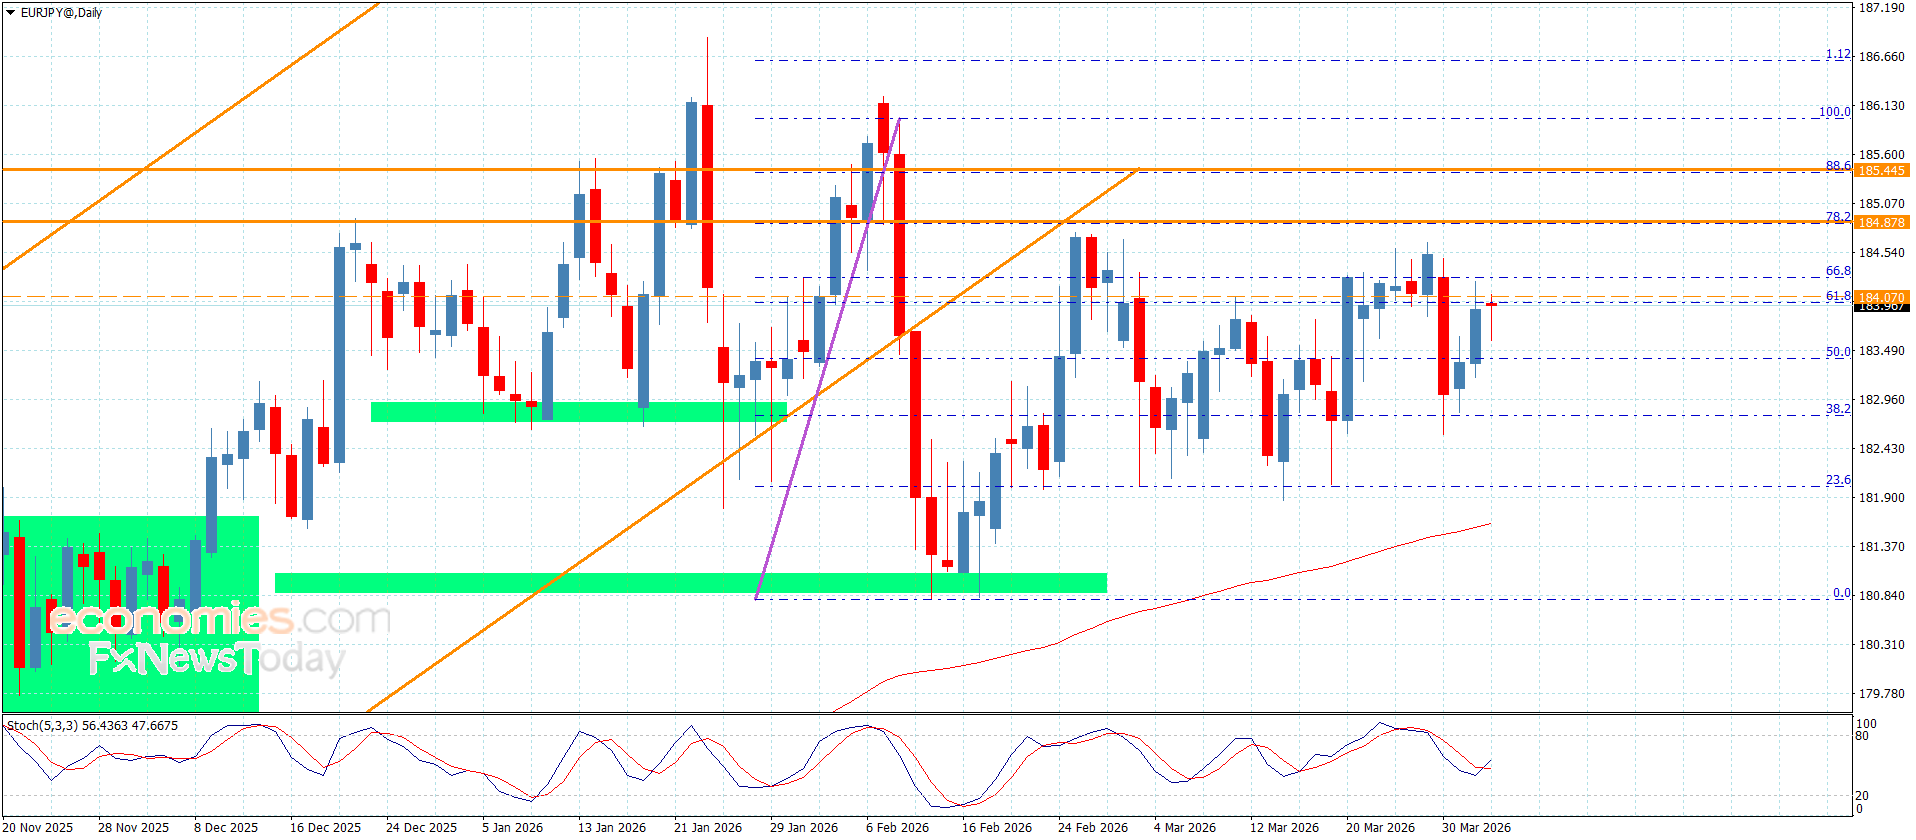
The EURJPY pair continued forming mixed trading, due to the continuation of the main indicators’ contradiction, delaying the negative attack in the current trading by its rally towards 184.25 yesterday, to open this morning trading with new negativity, to notice targeting 183.60.


In general, the bearish scenario will remain valid depending on the stability below 184.80 resistance, forming an extra barrier at 184.20 level will support the chances of gathering the negative momentum, to ease the mission of targeting negative levels, which might begin at 183.10 and 182.20.


The expected trading range for today is between 182.20 and 184.20


Trend forecast: Bearish


Source link

Go to Top