The main tag of Forex News Today Articles.
You can use the search box below to find what you need.
[wd_asp id=1]

27 03, 2026

Bulls retain control despite intervention warnings

By |2026-03-27T11:34:09+02:00March 27, 2026|Forex News, News|0 Comments

The USD/JPY pair turns positive for the fourth straight day following an intraday dip to the 159.45 area and touches a fresh high since July 2024 during the early European session on Friday. Given that Japan depends mostly on oil imports from the Middle East, the ongoing Iran war has been fueling worries that Japan’s economy will come under substantial strain in the foreseeable future. This, in turn, continues to undermine the Japanese Yen (JPY), which, along with the emergence of some US Dollar (USD) buying, acts as a tailwind for the currency pair. However, intervention fears might hold back the JPY bears from placing fresh bets and cap any further upside for spot prices.

The JPY hovers around the key 160 psychological mark against the USD, a key threshold level at which authorities stepped into the currency market multiple times in 2024. Moreover, Japan’s Finance Minister Satsuki Katayama has signaled that authorities are ready to take “bold” and “decisive” steps against excessive volatility in the currency market. The market implication, however, has been limited amid contrasting headlines over peace talks to end the war in the Middle East. Furthermore, supply disruptions caused by the effective closure of the Strait of Hormuz remain supportive of elevated energy prices, which could worsen Japan’s trade balance and weaken its economic outlook.

Despite US President Donald Trump’s ceasefire rhetoric, comments from Iranian officials dampen hopes for an immediate de-escalation of tensions. Meanwhile, Trump announced that he will delay strikes on Iran’s energy infrastructure and extended the deadline to reopen the Strait of Hormuz until April 6. Investors, however, remain worried about a further escalation of the conflict amid the deployment of additional US troops in the region. This keeps geopolitical risks in play, which, along with bets for an interest rate hike by the US Federal Reserve (Fed), lifts the USD closer to the weekly high. The fundamental backdrop, in turn, backs the case for a further USD/JPY appreciation.

USD/JPY daily chart

Technical Analysis:

Against the backdrop of the recent rebounds from the critical 200-day Exponential Moving Average (EMA), a sustained move and acceptance above the 160.00 mark will be seen as a fresh trigger for bullish traders. The Relative Strength Index hovers around 61, staying in bullish territory without overbought conditions, which signals ongoing buying pressure but reduced urgency to extend the rally aggressively.

However, the Moving Average Convergence Divergence (MACD) line has flattened just above the zero line with only a slight positive edge over its signal line, suggesting waning but still positive momentum. Hence, it will be prudent to wait for some follow-through buying before positioning for further gains towards the next relevant hurdle near the 160.50 region en route to the 161.00 round-figure mark.

On the downside, initial support emerges at 158.50, followed by firmer demand near 157.70, the prior breakout area. A daily close below 157.70 would weaken the bullish structure and expose the 156.20 consolidation zone, well above the 200-day EMA. As long as the USD/JPY pair remains above 158.50, dips are more consistent with consolidation inside an ongoing uptrend rather than a completed top.

(The technical analysis of this story was written with the help of an AI tool.)

Source link

27 03, 2026

Forecast update for EURUSD -26-03-2026.

By |2026-03-27T07:32:44+02:00March 27, 2026|Forex News, News|0 Comments

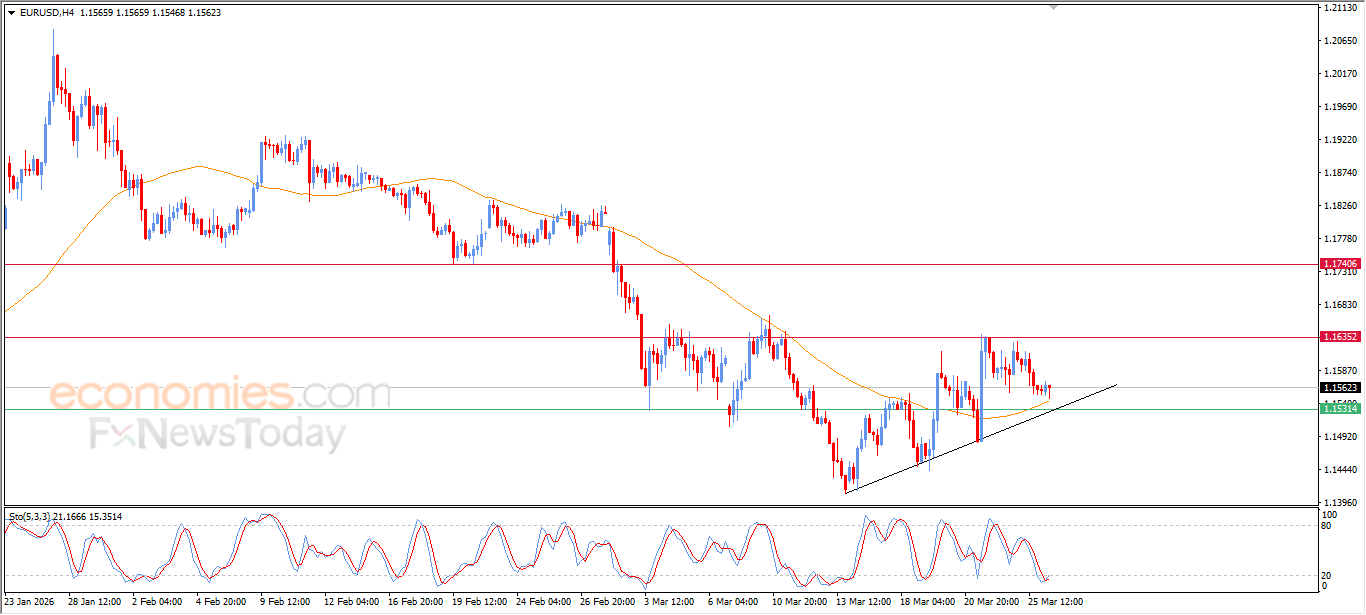
The GBPAUD confirmed the continuation of the bullish corrective scenario by moving way from the main support at 1.8675, achieving several gains by its rally towards 1.9270, taking advantage of the continuation of providing positive momentum by stochastic in the previous period.


Forming extra support at 1.9060 level will increase the efficiency of the bullish corrective track, to keep waiting for attacking 1.9310 level, and surpassing it will open the way for recording extra gains that might begin at 1.9400 reaching 1.9515.


The expected trading range for today is between 1.9155 and 1.9310


Trend forecast: Bullish


Source link

27 03, 2026

The EURJPY in its way to activate the bullish trend– Forecast today – 26-3-2026

By |2026-03-27T03:31:49+02:00March 27, 2026|Forex News, News|0 Comments

Copper price stayed below $5.5100, maintaining its negative stance and increasing the likelihood of forming short-term corrective downward waves. Since yesterday, the price has been fluctuating near $5.4200, affected by the ongoing divergence in key indicators, particularly the moving average 55 positioned above current trading levels.


It is important for the price to gather bearish momentum during today’s sessions, which would facilitate targeting first $5.2700, followed by the next key support near $4.9500. However, a strong push above $5.5100 with a positive close would cancel this bearish outlook and give the price a chance to start recovering, potentially moving first toward $5.6300.


The expected trading range for today is between $5.2700 and $5.5100


Trend forecast: Bearish


Source link

26 03, 2026

GBP/USD Forecast: Pound Sterling Choppy as Iran Talk Uncertainty Persists

By |2026-03-26T23:30:00+02:00March 26, 2026|Forex News, News|0 Comments


– Written by

The Pound US Dollar (GBP/USD) exchange rate moved without a clear trajectory on Thursday, amid uncertainty around US-Iran peace negotiations.

At the time of writing, GBP/USD was trading at $1.3364, having wavered throughout the session.

The US Dollar experienced uneven movement, rising early in the session before giving back those gains, as uncertainty surrounding potential US-Iran peace talks clouded market sentiment.

Earlier in the week, US President Donald Trump suggested that discussions were underway to bring an end to the conflict, a claim swiftly dismissed by Tehran.

Since then, reports have remained mixed, with speculation ranging from informal contact to the possibility of structured negotiations taking place in the coming days.

Washington has also tabled a peace proposal that Iran has publicly rejected, though there are suggestions it is still being weighed behind closed doors. At the same time, the deployment of an additional 2,000 US troops to the region has raised questions about the credibility of de-escalation efforts.

Amid these conflicting signals, the safe-haven US Dollar found it difficult to establish a clear trend.

Save on Your GBP/USD Transfer

Get better rates and lower fees on your next international money transfer.
Compare TorFX with top UK banks in seconds and see how much you could save.


Compare the Best GBP/USD Rates »

The Pound struggled to find momentum, with the absence of notable UK economic releases leaving Sterling without a clear catalyst.

With little fresh data to guide markets, GBP traded cautiously as investors continued to assess how the ongoing Middle East crisis could influence the UK’s economic outlook.

While rising energy prices may encourage the Bank of England to maintain a more restrictive policy stance, they also risk placing additional pressure on already weak growth prospects.

Short-Term GBP/USD Forecast: UK Retail Sales in Focus

Friday’s UK retail sales figures could act as a headwind for the Pound. Forecasts suggest sales volumes contracted by 0.8% in February, with a drop of this scale likely to raise fresh concerns about the resilience of the UK economy.

Across the Atlantic, the final reading of the US consumer sentiment index is also due. If confidence is confirmed to have weakened or revised lower, this could place some downward pressure on the US Dollar.

Developments in the US-Iran conflict are expected to remain a key driver of movement. Any indication that both sides are willing to engage in meaningful peace discussions may lift market sentiment and support GBP/USD. On the other hand, further escalation could reinforce demand for the safe-haven US Dollar and potentially push the exchange rate lower.

Like this piece? Please share with your friends and colleagues:


International Money Transfer? Ask our resident FX expert a money transfer question or try John’s new, free, no-obligation personal service! ,where he helps every step of the way,
ensuring you get the best exchange rates on your currency requirements.

TAGS: Pound Dollar Forecasts

Source link

26 03, 2026

Yen Slides Amid Rising Oil Pressures. Forecast as of 26.03.2026

By |2026-03-26T19:29:10+02:00March 26, 2026|Forex News, News|0 Comments

The Japanese government doubts that intervening in the Forex market will drive the USD/JPY pair down. The US dollar is strong amid surging Brent crude prices. Let’s discuss this and develop a trading plan.

The article covers the following subjects:

Major Takeaways

  • The Japanese government is stepping up its verbal interventions.
  • Japan is planning to intervene in the oil market.
  • The BoJ may raise rates as early as April.
  • Long positions on the USD/JPY pair can be opened on a breakout of 159.7.

Weekly Fundamental Forecast for Yen

While the Japanese government says it is ready to intervene in the currency market at any moment, it is also considering a large-scale plan to deploy its $1.4 trillion in reserves across other markets. The crude oil futures market, in particular, is in the spotlight. The recent rally in Brent crude—triggered by the closure of the Strait of Hormuz—has become a major concern for Prime Minister Sanae Takaichi.

Japan has considerable experience with currency interventions, but its effectiveness has often depended on periods of US dollar weakness. With the Fed signaling the end of its monetary tightening cycle and a potential shift toward rate cuts, pressure on USD/JPY has increased. It seems that Tokyo has been waiting for the right moment to act.

USD/JPY Rate and Currency Interventions

Source: Bloomberg.

This time, however, the Fed is largely sidelined. The futures market gives a 63% probability that the US regulator will keep rates unchanged through the end of 2026. At the same time, the trajectory of the US dollar is increasingly tied to oil prices. In other words, any decline in USD/JPY quotes is likely to be temporary as long as Brent crude prices remain elevated. Addressing the root cause of the problem would, in turn, ease pressure on the Japanese currency.

At the same time, Japanese officials continue to fuel concerns in the domestic currency market. Finance Minister Satsuki Katayama has described the USD/JPY rally as disconnected from fundamentals and warned that intervention in the foreign exchange market could occur at any moment. She has been echoed by Deputy Minister for International Affairs Atsushi Mimura. Alongside this, Bank of Japan Governor Kazuo Ueda has indicated that the Middle East conflict will have only a temporary impact on the economy and reiterated that the central bank is still considering further rate hikes. These factors would support the yen.

However, the currency remains weak. This weakness, combined with rising import costs driven by higher oil prices, is increasing the risk of renewed inflationary pressure, even as inflation has recently fallen below the 2% target for the first time since March 2022.

Japan CPI

Source: Bloomberg.

In this context, the Bank of Japan’s potential moves are truly mind-boggling. The central bank refrained from raising the overnight rate even though consumer prices remained above target for four years. Now, it is considering rate hikes while the CPI slides below 2%. It is nothing short of a paradox.

In reality, central bank actions are typically preventive. If rising inflation expectations are not contained early, they can spiral out of control. This is precisely why Nomura expects the BoJ to increase the overnight rate in April.

Weekly USDJPY Trading Plan

Interventions in the oil market are unlikely to achieve lasting results. Brent is reacting primarily to news of ongoing negotiations, and any funds Japan injects will likely only suppress prices temporarily. The same logic applies to the USD/JPY pair. As a result, a sustained break above the resistance level at 159.7 could serve as a strong signal to add to previously established long positions.


This forecast is based on the analysis of fundamental factors, including official statements from financial institutions and regulators, various geopolitical and economic developments, and statistical data. Historical market data are also considered.

Price chart of USDJPY in real time mode

The content of this article reflects the author’s opinion and does not necessarily reflect the official position of LiteFinance broker. The material published on this page is provided for informational purposes only and should not be considered as the provision of investment advice for the purposes of Directive 2014/65/EU.


According to copyright law, this article is considered intellectual property, which includes a prohibition on copying and distributing it without consent.

Rate this article:

{{value}} ( {{count}} {{title}} )


Source link

26 03, 2026

Navigating The Critical Downside Bias Within A Persistent Trading Range

By |2026-03-26T15:28:29+02:00March 26, 2026|Forex News, News|0 Comments

Singapore, March 2025 – The EUR/USD currency pair, the world’s most traded forex instrument, currently exhibits a pronounced downside bias according to technical analysis from United Overseas Bank (UOB). However, this bearish pressure operates firmly within a well-defined and persistent broader trading range, creating a complex landscape for traders and investors navigating the 2025 financial markets. This analysis examines the technical structure, fundamental underpinnings, and potential market implications of this configuration.

EUR/USD Technical Structure: Defining the Range

United Overseas Bank’s Global Economics & Markets Research team identifies specific technical levels that confine the current price action. The pair has consistently found support near the 1.0650 level throughout the first quarter of 2025. Conversely, multiple rally attempts have faltered around the 1.0950 resistance zone. This 300-pip corridor has contained most trading activity since late 2024. Consequently, the market demonstrates clear memory at these psychological and technical junctures. The 100-day and 200-day simple moving averages currently converge within this range, further emphasizing its technical significance. Meanwhile, momentum indicators like the Relative Strength Index (RSI) frequently oscillate between oversold and neutral territory without reaching overbought extremes, confirming the range-bound nature with a bearish tilt.

Key Technical Levels for Q2 2025

The following table summarizes the critical technical zones identified by UOB and corroborated by market price action:

Level Type Price Zone Significance
Immediate Resistance 1.0880 – 1.0900 Previous swing high & 50-day SMA
Major Range Resistance 1.0950 – 1.0980 Q1 2025 highs & descending trendline
Immediate Support 1.0720 – 1.0700 Recent consolidation low
Major Range Support 1.0650 – 1.0630 Critical multi-month floor

Fundamental Drivers Behind the Range and Bias

The technical pattern directly reflects a stalemate in fundamental monetary policy divergence. On one side, the European Central Bank maintains a cautious stance despite easing inflationary pressures. The ECB’s Governing Council emphasizes data dependency, particularly regarding wage growth trends in the Eurozone. Therefore, market expectations for rate cuts remain measured and gradual. Conversely, the Federal Reserve’s policy trajectory dominates the dollar’s narrative. Strong U.S. labor market data and resilient consumption figures have prompted the Fed to delay its own easing cycle. This policy differential creates a fundamental headwind for the euro, explaining the pair’s downside bias. However, the range persists because neither central bank exhibits urgency for aggressive action, leading to a equilibrium of expectations.

Furthermore, global risk sentiment and geopolitical developments provide alternating support and pressure. For instance, periods of market stress typically bolster the U.S. dollar’s safe-haven status, testing the lower bounds of the range. Conversely, improving global growth prospects or de-escalation in geopolitical tensions can trigger euro rallies toward range resistance. Economic data releases, especially inflation prints (CPI) and Purchasing Managers’ Index (PMI) surveys from both regions, act as frequent catalysts for volatility within the established boundaries. Traders consistently monitor these releases for signals that could break the stalemate.

Comparative Economic Indicators

The range-bound price action mirrors closely matched economic indicators. Key metrics include:

  • Inflation Trends: Both Eurozone and U.S. headline inflation have converged toward 2.5-3.0%, reducing a major policy divergence driver.
  • Growth Expectations: IMF forecasts for 2025 GDP growth show marginal differences, with the U.S. slightly ahead.
  • Yield Differentials: The 2-year government bond yield spread between Germany and the U.S. has stabilized, anchoring the currency pair.

Market Implications and Trader Positioning

This technical setup presents distinct scenarios for different market participants. For short-term tactical traders, the defined range offers clear opportunities. The strategy involves selling rallies near resistance and buying dips near support, always respecting the range boundaries. Position sizing and strict stop-loss management become paramount, as false breakouts remain a constant risk. For longer-term institutional investors and corporate treasurers, the environment necessitates a focus on hedging currency exposure. The persistent range reduces the urgency for directional bets but increases the value of options strategies that profit from continued volatility and time decay. According to Commitments of Traders (COT) data from the Commodity Futures Trading Commission, speculative net positioning on the euro remains near neutral levels, reflecting market indecision and alignment with the range-bound thesis.

Moreover, the downside bias suggests a slight preference for bearish strategies. This includes put option structures or ratio spreads that benefit more from a decline than a rally. However, the strength of the range support at 1.0650 tempers expectations for a sustained collapse. A decisive weekly close below this level would signal a potential breakdown, shifting the technical outlook and likely triggering a wave of stop-loss orders. Conversely, a sustained move above 1.0980 would invalidate the immediate downside bias and open the path toward higher resistance levels near 1.1100. The market currently assigns a higher probability to a test of the lower boundary before any sustained upward breakout.

Historical Context and Range Persistence

Extended trading ranges are not uncommon for major currency pairs. The EUR/USD spent most of 2023 oscillating within a 1.0500-1.1000 band before breaking higher. Historical analysis shows that such consolidation phases often precede significant directional moves. The duration of the current range, now exceeding five months, suggests building energy for a future breakout. The eventual direction will likely hinge on which central bank shifts its communication stance more dramatically. Analysts also watch for exogenous shocks, such as significant changes in energy prices or unforeseen political events within the Eurozone or United States, which could serve as catalysts to break the technical deadlock. Monitoring trading volume during tests of range boundaries provides crucial clues; weakening volume on bounces and increasing volume on sell-offs would confirm the downside bias.

Conclusion

The EUR/USD pair presents a classic case of conflicting market forces resulting in constrained price action. The technical analysis from UOB correctly identifies a downside bias within a broad and resilient trading range. This configuration reflects a fundamental standoff between the ECB and the Fed, with economic data flows alternately supporting each currency. For market participants, this environment demands discipline, favoring range-trading strategies while preparing for an eventual breakout. The critical levels of 1.0650 support and 1.0950 resistance will continue to define the pair’s trajectory in the second quarter of 2025, serving as the primary benchmarks for assessing any shift in market structure.

FAQs

Q1: What does ‘downside bias within a broad range’ mean for EUR/USD?
It means the currency pair is more likely to move toward the lower end of its established trading channel (e.g., 1.0650) than the upper end (e.g., 1.0950), but a complete breakdown below the range is not the base case. Sellers generally have more control in the short term.

Q2: What fundamental factors are causing this range-bound trading?
The primary cause is a convergence in monetary policy outlooks between the European Central Bank and the U.S. Federal Reserve. Both are in a data-dependent holding pattern regarding interest rates, eliminating a major driver of sustained directional trends for the exchange rate.

Q3: How should a trader approach this market setup?
Traders often employ range-bound strategies, such as buying near identified support levels and selling near resistance, with tight risk management. They also monitor for a decisive breakout above or below the range with increasing volume, which would signal a potential new trend.

Q4: What would signal a break of the current EUR/USD range?
A sustained daily and weekly close, confirmed by strong trading volume, above the 1.0980 resistance or below the 1.0650 support level would signal a valid breakout. A single spike outside the range is often a false signal.

Q5: Who is UOB and why is their analysis significant?
United Overseas Bank (UOB) is a major Asian financial institution with a respected Global Economics & Markets Research team. Their analysis is closely followed because it provides a well-informed, institutional perspective on forex markets, combining technical and fundamental insights.

Disclaimer: The information provided is not trading advice, Bitcoinworld.co.in holds no liability for any investments made based on the information provided on this page. We strongly recommend independent research and/or consultation with a qualified professional before making any investment decisions.

Source link

26 03, 2026

The GBPJPY is waiting for surpassing the barrier– Forecast today – 26-3-2026

By |2026-03-26T11:27:00+02:00March 26, 2026|Forex News, News|0 Comments

Copper price stayed below $5.5100, maintaining its negative stance and increasing the likelihood of forming short-term corrective downward waves. Since yesterday, the price has been fluctuating near $5.4200, affected by the ongoing divergence in key indicators, particularly the moving average 55 positioned above current trading levels.


It is important for the price to gather bearish momentum during today’s sessions, which would facilitate targeting first $5.2700, followed by the next key support near $4.9500. However, a strong push above $5.5100 with a positive close would cancel this bearish outlook and give the price a chance to start recovering, potentially moving first toward $5.6300.


The expected trading range for today is between $5.2700 and $5.5100


Trend forecast: Bearish


Source link

26 03, 2026

The EURJPY is waiting to confirm the breach– Forecast today – 25-3-2026

By |2026-03-26T07:25:54+02:00March 26, 2026|Forex News, News|0 Comments

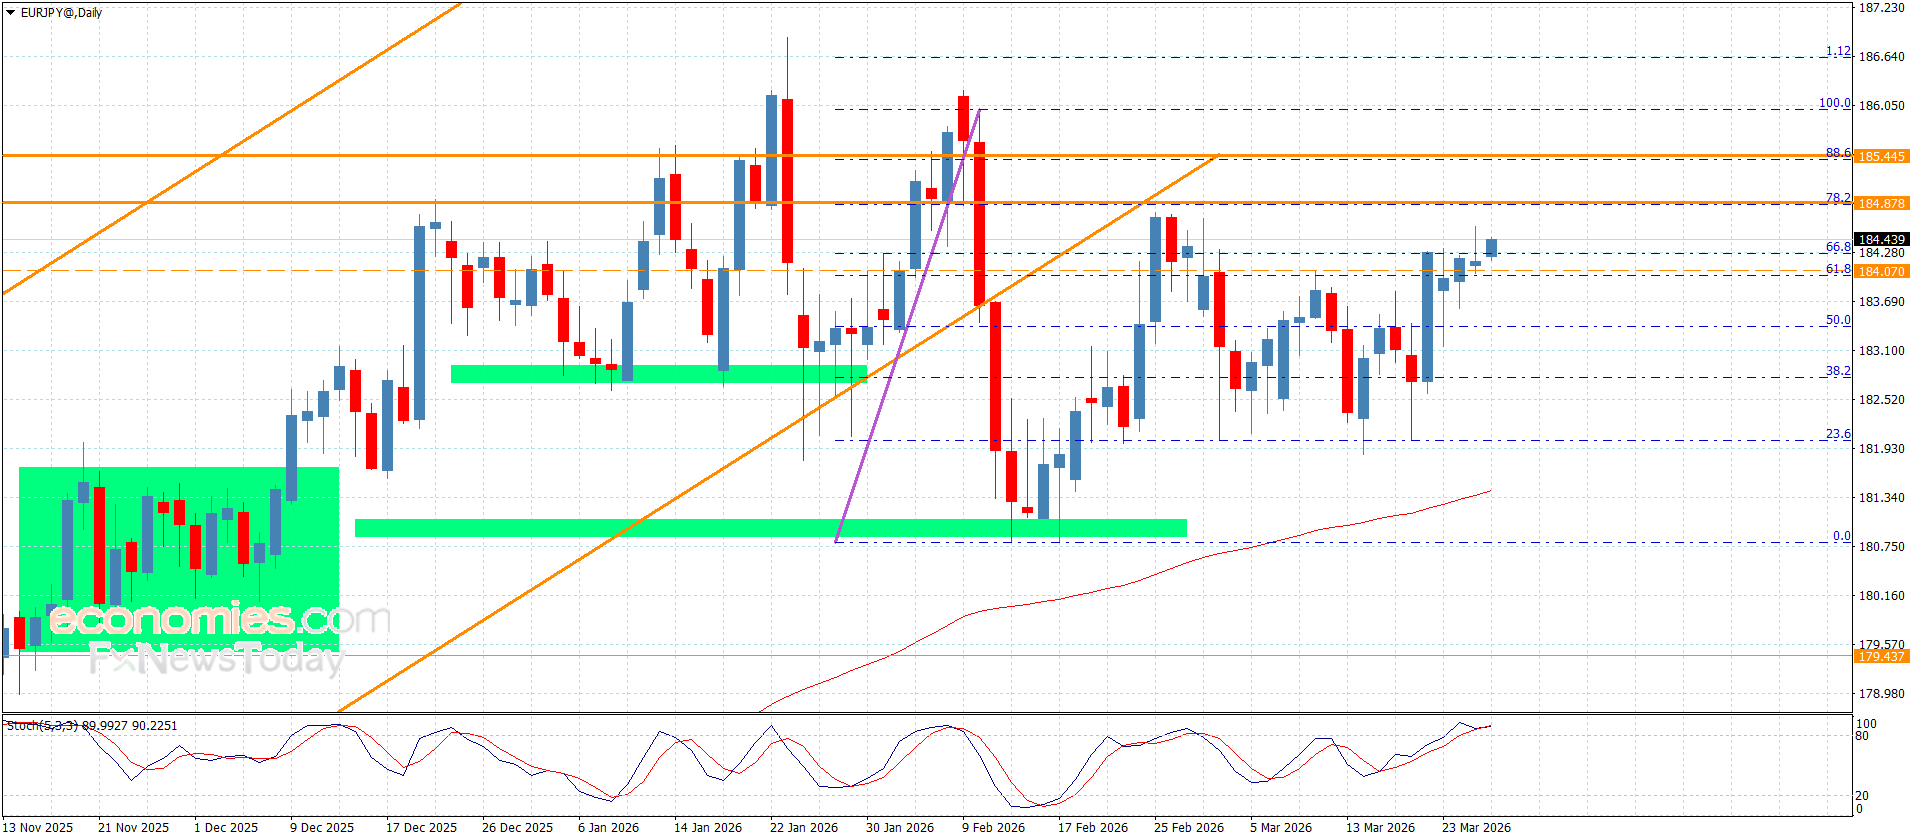
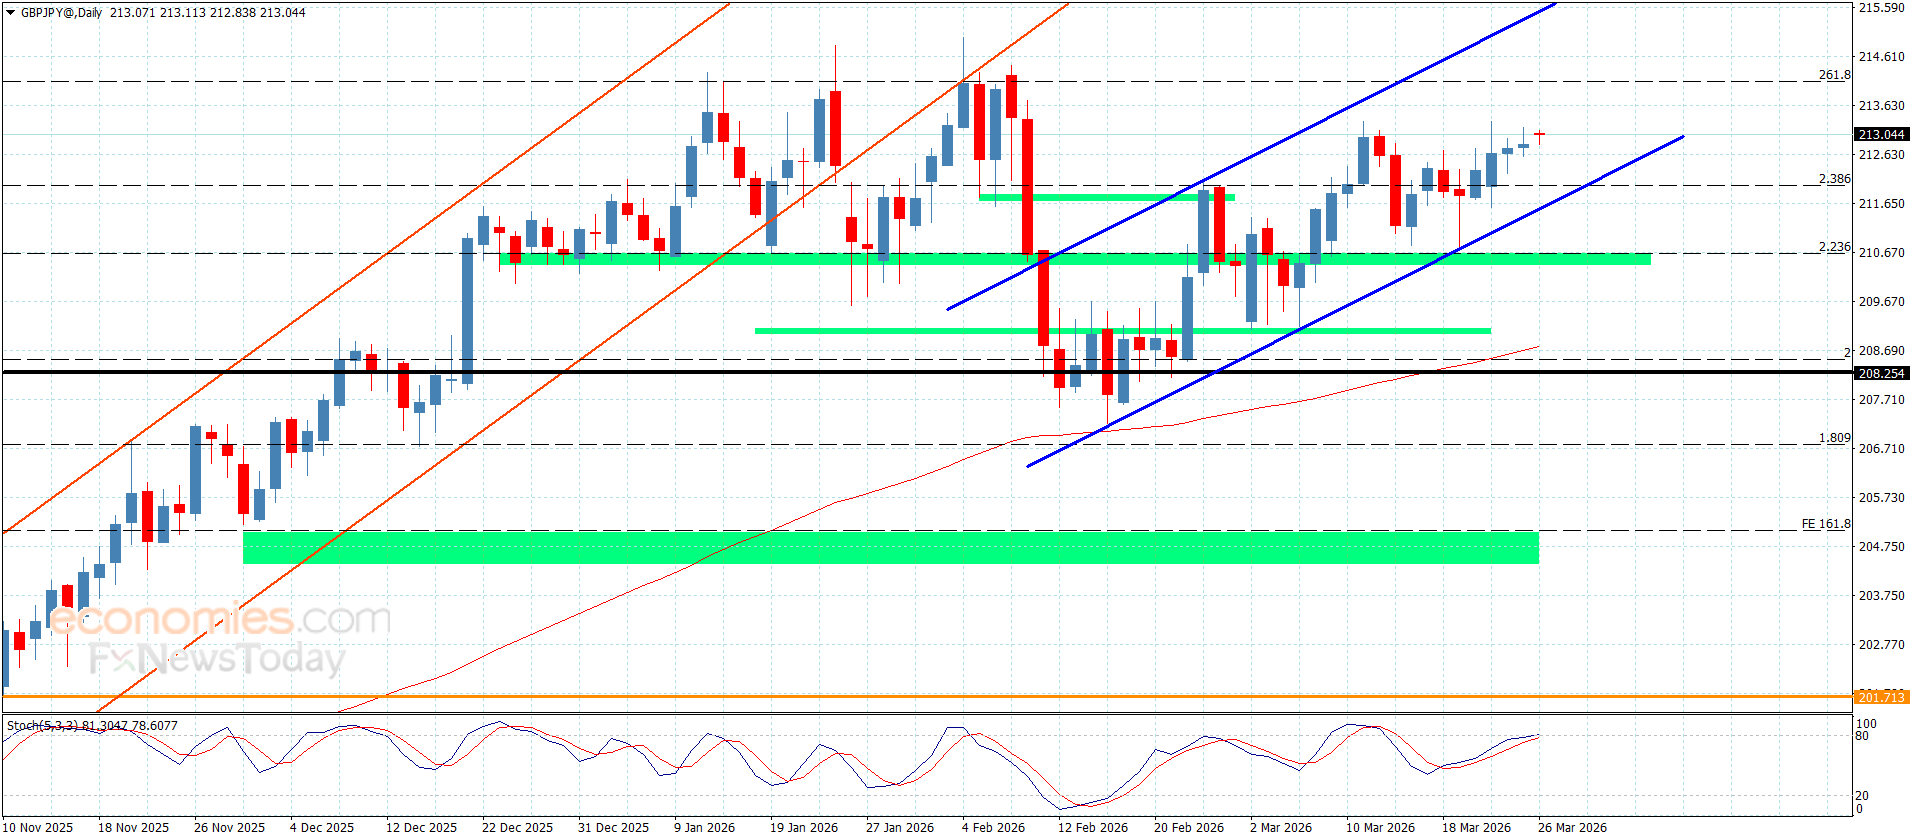
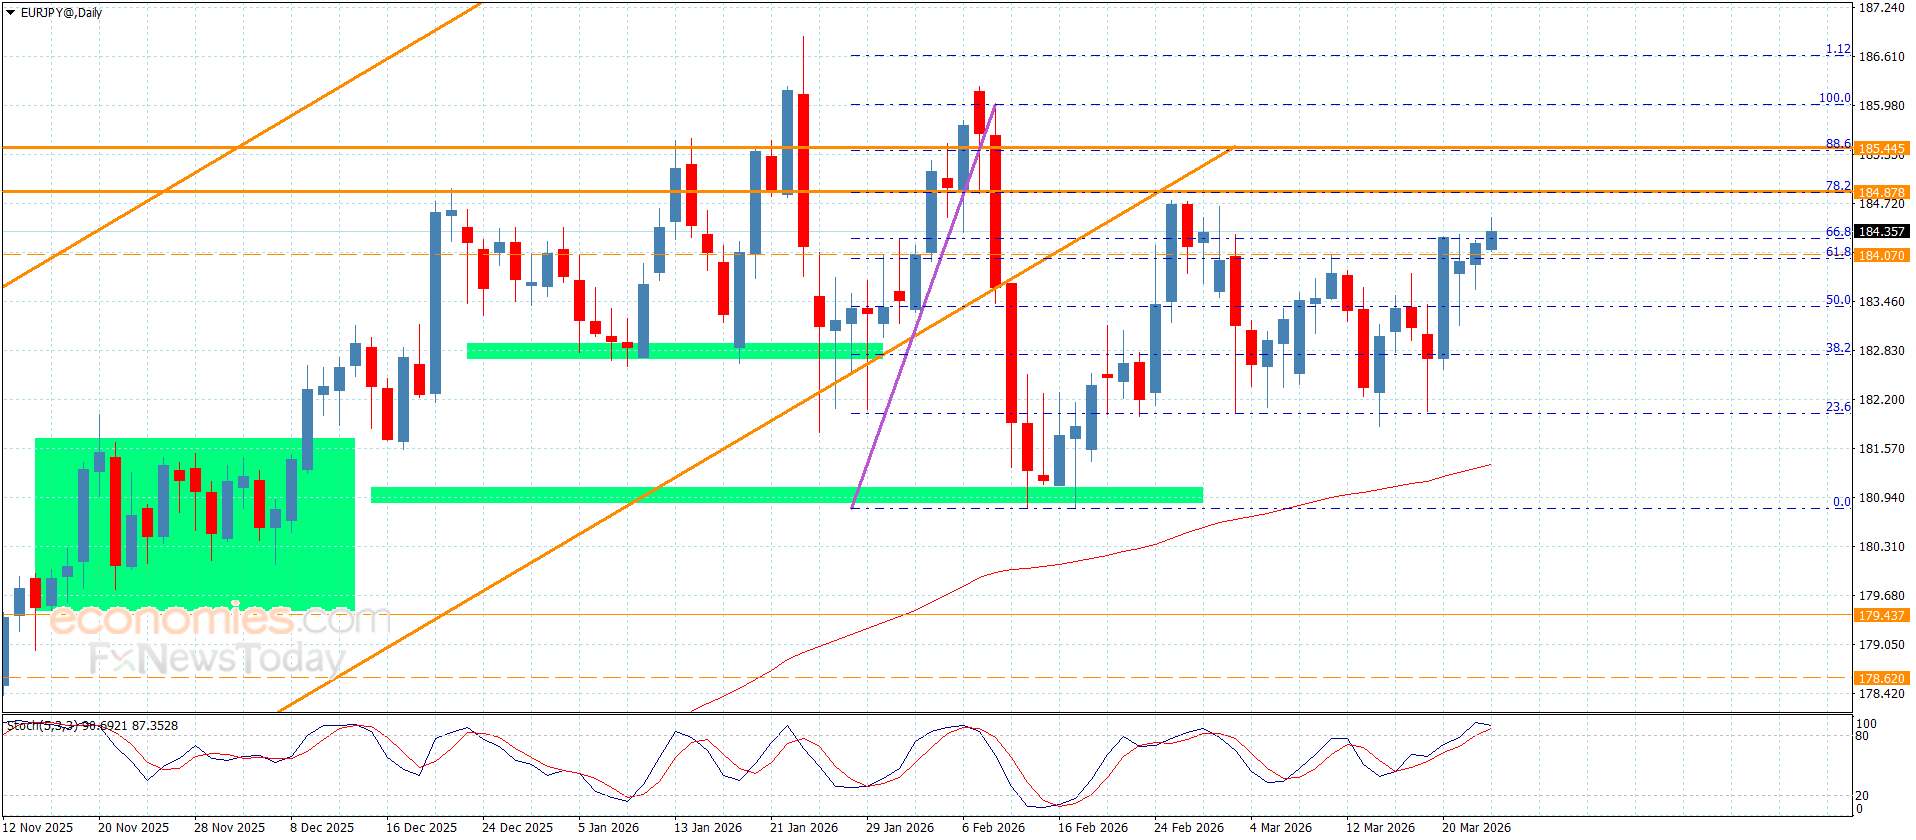
The GBPJPY pair repeats the attempts of forming bullish waves, taking advantage of its stability within the minor bullish channel’s levels that appear in the above image, besides the continuation of forming an extra support at 212.00 level, to rally towards 213.20 in this morning trading.


The price needs a new bullish momentum, which allows it to surpass the intraday barrier at 213.30, opening the way towards the main bullish stations that are located near 214.05 reaching to 215.2, while changing the main trend is represented by the attempt of breaking the bullish channel’s support at 211.40.


The expected trading range for today is between 212.10 and 214.05


Trend forecast: Bullish


Source link

26 03, 2026

Crucial Support Zone Expected to Hold Through 2025 – ING Analysis

By |2026-03-26T03:24:59+02:00March 26, 2026|Forex News, News|0 Comments

BitcoinWorld
BitcoinWorld
EUR/GBP Forecast: Crucial Support Zone Expected to Hold Through 2025 – ING Analysis

Financial markets in London and Frankfurt are closely monitoring the EUR/GBP currency pair as ING analysts project a crucial support zone will hold through 2025, potentially stabilizing the cross-rate amid diverging monetary policies between the European Central Bank and Bank of England. The euro-pound exchange rate, currently trading around 0.8550, faces significant technical and fundamental tests as central banks navigate inflation challenges while economic growth patterns diverge across European economies.

EUR/GBP Technical Analysis and Support Zone Dynamics

Technical analysts at ING have identified a critical support zone between 0.8520 and 0.8480 for the EUR/GBP pair. This zone represents a confluence of multiple technical factors that historically provided substantial buying interest. The 200-day moving average currently intersects this region, creating additional technical significance. Furthermore, Fibonacci retracement levels from the 2024 rally align with these price points, strengthening the zone’s importance.

Market participants observe several key technical indicators suggesting potential stabilization. The Relative Strength Index (RSI) recently approached oversold territory near 30, typically preceding corrective bounces in trending markets. Additionally, trading volume patterns show increased activity near the support zone, indicating heightened institutional interest at these levels. Bollinger Band analysis reveals the pair testing the lower band boundary, a condition that often precedes mean reversion moves in currency markets.

Historical Context of EUR/GBP Support Levels

The identified support zone carries historical significance dating back to pre-Brexit trading ranges. Market memory often creates psychological barriers at price levels where previous reversals occurred. Technical analysts note that this zone previously acted as resistance during 2023’s downward trend before breaking higher in early 2024. Such role reversals between support and resistance frequently create stronger technical barriers, as multiple market participants establish positions around these levels.

Fundamental Drivers Behind EUR/GBP Movements

Monetary policy divergence represents the primary fundamental driver for EUR/GBP movements in 2025. The European Central Bank maintains a cautious approach toward interest rate adjustments, prioritizing inflation control over growth stimulation. Conversely, the Bank of England faces different economic pressures, particularly regarding consumer spending patterns and housing market stability. This policy divergence creates natural currency valuation pressures that technical levels must withstand.

Economic growth differentials further influence the currency pair’s trajectory. Eurozone economies demonstrate varying recovery paces, with Germany’s manufacturing sector showing signs of stabilization while Southern European nations experience stronger service sector growth. Meanwhile, UK economic indicators reveal persistent challenges in productivity growth and trade balance improvements. These fundamental factors create underlying currents that technical analysis must incorporate for accurate forecasting.

Key economic indicators affecting EUR/GBP:

  • Interest rate differentials between ECB and BoE
  • Inflation convergence or divergence patterns
  • Manufacturing PMI comparisons across regions
  • Trade balance developments and current account positions
  • Labor market strength and wage growth trends

Central Bank Policy Implications for Currency Markets

Central bank communications increasingly influence currency valuations beyond mere policy decisions. The European Central Bank’s forward guidance emphasizes data dependency, creating uncertainty about the timing and magnitude of future rate adjustments. This uncertainty typically increases currency volatility but may also strengthen support zones as markets price in various scenarios. The Bank of England faces similar communication challenges while managing market expectations about inflation persistence.

Quantitative tightening programs represent another crucial factor. Both central banks continue balance sheet reduction efforts, though at different paces and scales. The relative speed of these programs affects currency supply dynamics, potentially strengthening the currency of the central bank pursuing more aggressive balance sheet normalization. Market participants closely monitor these technical aspects of monetary policy implementation, as they directly impact currency valuation models.

Institutional Positioning and Market Sentiment

Commitments of Traders reports reveal changing institutional positioning around the EUR/GBP support zone. Hedge funds and asset managers adjusted their exposure throughout 2024, with recent data showing reduced net short positions as the pair approached technical support. This positioning shift suggests professional traders anticipate potential stabilization or reversal near current levels. Meanwhile, retail trader sentiment indicators show increased caution, typically a contrarian signal in currency markets.

Comparative Analysis of European Economic Conditions

The eurozone and United Kingdom face distinct economic challenges that influence their respective currencies. Eurozone integration efforts continue affecting currency stability, particularly regarding fiscal policy coordination and energy market reforms. These structural factors create longer-term currency valuation pressures that technical analysis must consider. Meanwhile, UK-specific factors including post-Brexit trade arrangements and financial services competitiveness create unique pound sterling dynamics.

Economic Indicator Comparison: Eurozone vs United Kingdom
Indicator Eurozone (Latest) United Kingdom (Latest) Impact on EUR/GBP
Core Inflation 2.8% 3.2% Moderate Sterling pressure
GDP Growth Forecast 1.2% 0.8% Euro supportive
Unemployment Rate 6.5% 4.2% Mixed implications
Manufacturing PMI 48.7 47.2 Neutral to Euro positive
Consumer Confidence -14.2 -21.5 Euro supportive

Risk Factors That Could Break EUR/GBP Support

Several risk factors threaten the integrity of the identified EUR/GBP support zone. Geopolitical developments in Eastern Europe continue affecting energy markets and European economic stability. Any escalation in regional conflicts could disproportionately impact eurozone economies through energy price channels. Additionally, political developments within European Union member states create uncertainty about fiscal policy coordination and structural reform implementation.

UK-specific risks include persistent inflation surprises that might force more aggressive Bank of England action than currently anticipated. Housing market vulnerabilities represent another concern, particularly if mortgage rate resets create consumer spending constraints. Furthermore, trade relationship developments with both European Union and non-EU partners could significantly impact pound sterling valuations through current account effects.

Primary risk scenarios for EUR/GBP:

  • Unexpected ECB policy pivot toward earlier easing
  • UK inflation persistence requiring additional rate hikes
  • European recession signals deepening beyond expectations
  • Significant divergence in energy price impacts between regions
  • Political instability affecting fiscal policy coordination

Market Structure and Liquidity Considerations

Currency market structure evolution affects how support zones function in modern trading environments. Algorithmic trading participation continues growing, potentially amplifying moves toward technical levels while also providing liquidity near those levels. The EUR/GBP pair benefits from deep liquidity pools during European trading hours, though Asian and American session liquidity varies significantly. This liquidity pattern creates potential for overnight gaps that technical analysts must consider when evaluating support zone reliability.

Market microstructure analysis reveals changing transaction patterns around key technical levels. Order book data shows concentrated liquidity accumulation near the 0.8520 support level, with both resting orders and algorithmic liquidity provision creating a buffer against rapid declines. This market structure development supports ING’s analysis that the zone should hold against normal market volatility, though exceptional events could overwhelm these technical defenses.

Conclusion

ING’s EUR/GBP analysis presents a technically grounded forecast suggesting the identified support zone between 0.8520 and 0.8480 should hold through 2025’s market conditions. This projection combines rigorous technical analysis with fundamental understanding of central bank policies and economic divergences. While risk factors exist that could challenge this support zone, the confluence of technical indicators, institutional positioning, and market structure developments creates substantial evidence for the zone’s durability. Currency traders and risk managers should monitor this EUR/GBP support zone closely, as its integrity will significantly influence cross-rate volatility and directional bias throughout the coming year.

FAQs

Q1: What specific price levels define the EUR/GBP support zone according to ING?
ING analysts identify the critical support zone between 0.8520 and 0.8480, representing a confluence of technical factors including the 200-day moving average and key Fibonacci retracement levels.

Q2: How does monetary policy divergence affect the EUR/GBP exchange rate?
Divergence between European Central Bank and Bank of England policies creates natural currency valuation pressures, with interest rate differentials and quantitative tightening pace differences directly impacting the exchange rate’s fundamental valuation.

Q3: What technical indicators support the analysis that this zone will hold?
Multiple technical indicators suggest potential stabilization, including RSI approaching oversold conditions, Bollinger Band positioning, historical support/resistance role reversal, and volume patterns showing increased activity near these levels.

Q4: What are the main risk factors that could break this EUR/GBP support?
Primary risks include unexpected central bank policy pivots, geopolitical developments affecting European energy markets, UK inflation persistence requiring additional rate hikes, and significant economic divergence beyond current expectations.

Q5: How does market structure affect support zone reliability in modern currency trading?
Algorithmic trading participation and order book liquidity concentration near technical levels can both amplify moves toward support zones and provide defensive liquidity, creating more defined technical barriers than in previous market eras.

This post EUR/GBP Forecast: Crucial Support Zone Expected to Hold Through 2025 – ING Analysis first appeared on BitcoinWorld.

Source link

25 03, 2026

Traders seem hesitant amid hawkish Fed/BoE bets

By |2026-03-25T23:24:09+02:00March 25, 2026|Forex News, News|0 Comments

The GBP/USD pair continues with its struggle to make it through a technically significant 200-day Simple Moving Average (SMA) and seesaws between tepid gains/minor losses through the first half of the European session on Wednesday. Geopolitical uncertainties benefit the US Dollar’s (USD) status as the global reserve currency and exert some pressure on the current pair, which reacts little to the latest UK consumer inflation figures. That said, a mixed fundamental backdrop warrants some caution before placing aggressive directional bets.

Reports suggest that diplomatic efforts are underway to introduce a one-month ceasefire mechanism to allow the US and Iran to negotiate on a plan to end the war. This follows US President Donald Trump’s decision to delay planned strikes on Iran’s energy infrastructure by five days, fueling hopes for a de-escalation of tensions in the Middle East. The conflict, however, has shown no signs of easing, with Israel continuing its strikes on the Islamic Republic, and the Trump administration has directed thousands of soldiers from the US Army’s elite 82nd Airborne Division to the Middle East.

Moreover, Iran fired a new missile barrage at Israel, while Gulf countries also reported repeated drone and missile interceptions, as fighting intensifies in Lebanon and Iraq. This keeps geopolitical risks in play and acts as a tailwind for Crude Oil prices, fueling inflation fears and hawkish US Federal Reserve (Fed) expectations. In fact, traders have nearly priced out the possibility of any further rate cuts by the Fed and are rapidly increasing bets for a hike by the end of this year. The outlook, in turn, assists the USD to attract some buyers and caps the upside for the GBP/USD pair.

Meanwhile, the UK Office for National Statistics (ONS) reported that the headline Consumer Price Index (CPI) rose 3.0% over the year in February, matching the previous month’s reading and consensus estimates. However, the core CPI, which excludes volatile food and energy items, came in above market expectations and climbed 3.2% YoY from 3.1% in January. Moreover, the Bank of England’s (BoE) hawkish outlook, signaling the potential rate hike as early as April amid inflation fears, offers some support to the British Pound (GBP) and helps limit losses for the GBP/USD pair.

GBP/USD daily chart

Technical Analysis:

The near-term bias is neutral with a slight downside tilt, as spot prices fluctuate just below the 200-day SMA at 1.3433, which caps recovery attempts. The GBP/USD pair is also trading under the 38.2% Fibonacci retracement of the fall from the January swing high, around the 1.3855 area, reinforcing a corrective tone within a broader range.

Meanwhile, the Moving Average Convergence Divergence (MACD) histogram has turned positive while the MACD line moves above the signal line but remains close to the zero mark, hinting at only modest upside momentum. The Relative Strength Index (RSI) around 49 stays near its midline, consistent with a consolidative environment rather than a directional move.

Initial resistance stands at 1.3462, the 38.2% Fibo. level, with a daily close above this level opening the way toward the 50% retracement at 1.3537 as the next upside hurdle. A stronger barrier appears near 1.3612 at the 61.8% Fibo. level, where prior supply and the broader corrective structure could limit gains.

On the downside, immediate support comes from the 23.6% retracement at 1.3369, followed by the recent base area near 1.3220, aligned with the 0% Fibonacci level at 1.3219. A break below 1.3369 would expose that lower band of the range and would weaken the case for a more durable rebound.

(The technical analysis of this story was written with the help of an AI tool.)

Source link

Go to Top