The main tag of Gold Price Articles.
You can use the search box below to find what you need.
[wd_asp id=1]
The main tag of Gold Price Articles.
You can use the search box below to find what you need.
[wd_asp id=1]
MCX Natural Gas Mini (26 Aug) at Rs 266.40/mmBtu (+2.03%) on 21 Aug 2026. High: Rs 266.80. Low: Rs 262.50. Best single-day gain this week. Support: Rs 262. Resistance: Rs 266.80.
Quick Answer
The natural gas price prediction for Monday is mildly bullish. MCX Natural Gas (Mini 26 Aug) surged +2.03% to Rs 266.40/mmBtu on Friday 21 August — the biggest single-day MCX natural gas gain this week. Ankit Jaiswal’s natural gas price prediction for Monday places support at Rs 262 to 263 and resistance at Rs 266.80.
The natural gas price prediction for Monday follows Friday’s strong session where MCX Natural Gas Mini opened at Rs 262.50, reached Rs 266.80, and settled at Rs 266.40. Ankit Jaiswal, Research Analyst at Univest, notes that the natural gas price prediction for Monday benefits from the US EIA weekly natural gas storage report, which showed a smaller-than-expected inventory build — this is a bullish fundamental catalyst supporting the natural gas price prediction for Monday.
Kunal Singla, Research Analyst at Univest, observes that the natural gas price prediction for Monday is supported by the approaching expiry of the MCX Natural Gas 26 August contract. As participants roll forward to September, there is typically reduced liquidity in the near-month contract heading into Monday, which can amplify price moves in the natural gas price prediction for Monday.
Click Here – Get Free Investment Predictions
Ankit Jaiswal’s natural gas price prediction for Monday identifies Rs 262 to 263 as the immediate support, near Friday’s intraday low of Rs 262.50. A hold above Rs 262 in the natural gas price prediction for Monday confirms the bullish momentum. Resistance stands at Rs 266.80 (Friday’s high) with stronger resistance at Rs 271 to 273 in the natural gas price prediction for Monday.
Trend for Monday 24 August 2026: Mildly Bullish
Support: Rs 262 to 263 | Rs 258 to 260
Resistance: Rs 266.80 | Rs 271 to 273
| Stock | 21 Aug Close (Rs) | Change | Key Level for Monday |
|---|---|---|---|
| GAIL India | 203 | -0.20% | Support: 200 | Resistance: 208 |
| ONGC | 238 | +0.88% | Support: 235 | Resistance: 241 |
| Indian Oil Corporation | 158 | +0.40% | Support: 156 | Resistance: 161 |
Explore Natural Gas-Linked Stocks on Univest Screener
Sentiment for the natural gas price prediction for Monday is mildly bullish after Friday’s 2.03% surge — the strongest single-day gain for MCX Natural Gas this week. Ankit Jaiswal notes that the smaller-than-expected US EIA storage build is the most important fundamental input for the natural gas price prediction for Monday, as it signals tighter-than-anticipated US supply.
Kunal Singla observes that the natural gas price prediction for Monday is also affected by the approaching 26 August contract expiry. Reduced near-month liquidity may amplify Monday’s price moves in the natural gas price prediction for Monday. Participants should ensure they roll forward to September before Monday’s MCX open if holding near-month positions.
Download the Univest iOS App or Univest Android App to track live Natural Gas prices and get real-time predictions.
the 24 August natural gas price outlook, 24 August 2026, is mildly bullish. MCX Natural Gas surged +2.03% to Rs 266.40/mmBtu on 21 August. Ankit Jaiswal places support at Rs 262 and resistance at Rs 266.80.
Kunal Singla notes the US EIA bullish storage data and approaching 26 Aug expiry are key factors in the MCX natural gas price forecast for Monday. Download the Univest app for live MCX natural gas tracking.
Disclaimer: Investments in securities are subject to market risk. This content is for educational purposes only and does not constitute investment advice. Univest Research Analyst Registration No. INH000013776.
Ans. Mildly bullish. MCX Natural Gas surged +2.03% to Rs 266.40 on 21 Aug. Ankit Jaiswal places support at Rs 262 and resistance at Rs 266.80 for the natural gas price outlook for 24 August.
Ans. A smaller-than-expected US EIA natural gas storage build and broader commodity risk-on sentiment drove Friday’s 2.03% MCX Natural Gas gain, supporting the Monday’s MCX natural gas price forecast.
Ans. Yes, MCX Natural Gas 26 Aug contract nears expiry. Thin liquidity may amplify Monday moves. Ankit Jaiswal recommends checking contract roll to September before Monday in the Wednesday’s natural gas price outlook.
Ans. Support: Rs 262 to 263 and Rs 258 to 260. Resistance: Rs 266.80 and Rs 271 to 273 in the 24 August natural gas price outlook.
Ans. Buy near Rs 262 with stop below Rs 258 targeting Rs 266.80 in the MCX natural gas price forecast for Monday. A break above Rs 266.80 targets Rs 271 to 273.
Note: This blog is for information purpose only. Investments and trading are subject to market risks, read all scheme related documents carefully.
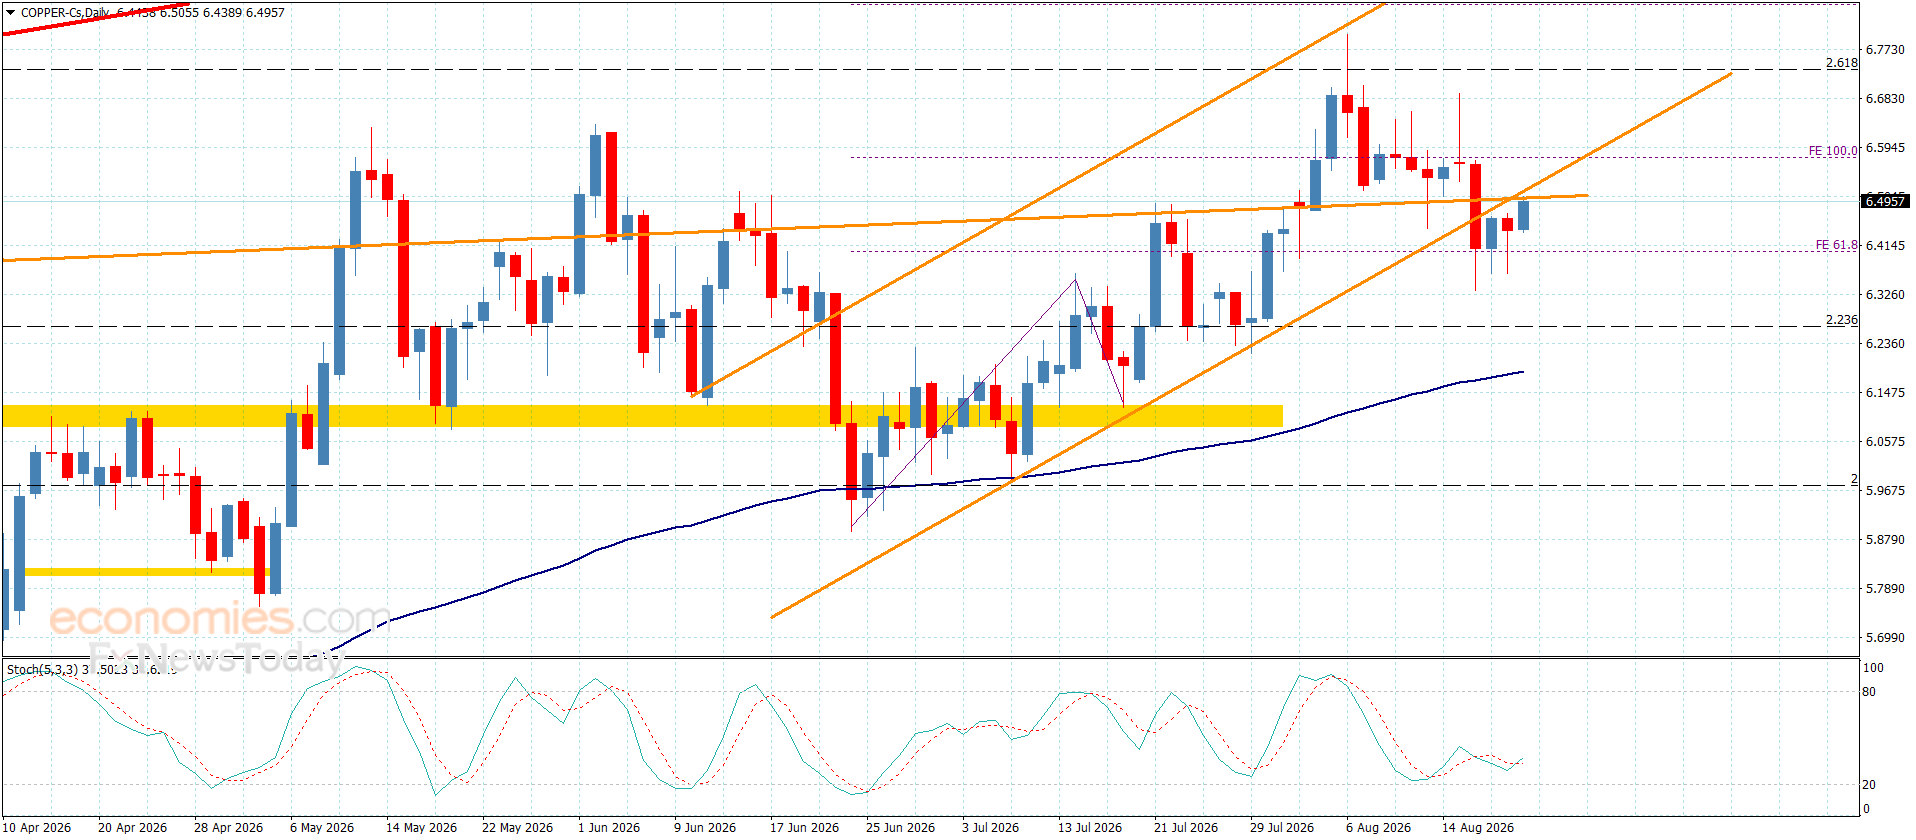
Copper price ended the bearish corrective trading by providing a new positive close above the main support at $6.2700, benefiting from the main indicators by forming some bullish waves, to settle near $6.5000, confirming the stability of the previously suggested bullish scenario.
The price might face some difficulties in the bullish attempts due to stochastic fluctuation below level 50, we expect reaching the barrier near $6.5800, and breaching it will ease the mission of recording extra gains that might begin at $6.6700.
The expected trading range for today is between $6.4200 and $6.5800
Trend forecast: Bullish
The Gold price (XAU/USD) entered the weekend near $4,604 an ounce after climbing more than 5% over the week and reaching its highest level since mid-May.
Friday’s advance carried spot gold as high as $4,631.99, while US futures settled at $4,680.60.
The move above the 200-day moving average around $4,513 marked an important change in the technical picture and strengthened the case for a further recovery towards $4,700.
Gold benefited from a sharp Dollar decline after US Treasury plans to expand purchases of longer-dated government debt unsettled investors and pulled capital towards alternative stores of value.
The policy announcement also helped ease long-term yields, reducing the opportunity cost of holding a non-interest-bearing asset.
Goldman Sachs reported renewed speculative interest in COMEX gold and rate-sensitive exchange-traded funds, while unusually strong demand for call options amplified the advance.

Gold broke decisively above $4,500 as Dollar selling and renewed demand for macroeconomic hedges accelerated.
The immediate gold price forecast has turned bullish following Friday’s close above both the 200-day average and the downward trend line from the January record.
Initial resistance is expected between $4,654 and $4,689, where measured technical projections converge with retracement levels from the earlier decline.
TD Securities global head of commodity strategy Bart Melek said: “Next step is $4,700 if this momentum continues.”
A sustained break above $4,700 would strengthen the recovery and expose the $4,770–$4,780 region.
Technical analyst Bruce Powers identified the April swing high around $4,891 as the larger upside objective if buyers retain control.
That would leave gold within reach of the psychologically important $5,000 level, although momentum indicators suggest the market could consolidate or correct before mounting such an advance.
The first important support zone is now located between $4,500 and $4,516.
Holding this area would indicate that former resistance has become support and keep the bullish breakout intact.
A daily close below $4,500 would weaken the signal and risk a retreat towards $4,450, followed by the August 14 low near $4,310.
Losses below $4,300 would represent a more serious deterioration, potentially returning attention to the $4,000 region that supported gold during the June correction.
World Gold Council research also revealed improving demand conditions in India ahead of the festive season, although the figures should be viewed as evidence of support during price declines rather than justification for an uninterrupted rally.
The Council’s reference price of $4,391 was recorded on August 14, before gold subsequently broke above $4,600.
Research Head for India Kavita Chacko said: “Demand conditions are improving, raising expectations of a stronger festive season.”
Jewellery retailers and manufacturers replenished inventories as consumers returned after June’s sharp correction and July’s period of greater price stability.
Local discounts narrowed from around $100 an ounce in May and early June to approximately $45 by mid-August, pointing to a better balance between available supply and immediate demand.
Estimated Indian gold imports recovered to 40–45 tonnes in July from 20 tonnes during June, while their value more than doubled from $1.97bn to $4.16bn.
Investment demand provided a second source of support.
Indian gold ETFs attracted net inflows of $163mn during July, followed by an estimated $124mn during the first two weeks of August.
There are limits to how much support the physical market can provide at current prices.
Friday’s surge above $4,600 reportedly deterred some Indian retail buyers, while elevated prices could encourage households to exchange old jewellery and postpone discretionary purchases.
The medium-term institutional outlook nevertheless retains a bullish bias.
UBS expects gold to reach $5,000 an ounce during the first half of 2027, supported by eventual Federal Reserve easing, portfolio diversification and continuing official-sector demand.
UBS Chief Investment Officer Mark Haefele said periods of weakness towards $4,000 “may ultimately prove to be opportunities to build strategic exposure.”
Our base-case forecast is for gold to remain supported above $4,500 and challenge $4,654–$4,700.
A confirmed break higher would target $4,770–$4,780 and potentially $4,891, while a close below $4,500 would warn that the breakout had failed.
US PCE inflation data on Wednesday and Federal Reserve Chair Kevin Warsh’s Jackson Hole address on Friday will be the principal tests next week.
Softer inflation or reduced expectations of another US rate increase would favour further gains, whereas a renewed rise in yields and the Dollar could trigger a correction towards breakout support.
So, there could be a little bit of a jump here in the next week or so in one direction or the other, really. And the October contract does tend to be a little bit more bullish than September because you start to talk about cooler temperatures in the United States, something that we certainly don’t have at the moment. I’m giving this analysis with all of the windows open, very comfortable temperatures, no need to burn a lot of natural gas, although it is somewhat attached to electricity. It gets a little bit of a spike when it gets really hot; air conditioning demand can drive it higher, but right now there is no real huge push for that either. So, all things being equal, with the abundant supply, it keeps the price of natural gas somewhat suppressed.
Ultimately, I do think that we’re getting close to the end of the quiet season. And this winter could be particularly interesting as the Europeans may find themselves having to import US natural gas, and that will have a major influence here.
But as things stand right now, we’re in a tight range between the 50-day EMA at $2.87 and the $2.65 level underneath. We’re basically in the middle of it. Looks like quiet, choppy trading to me.
At 8 a.m. Eastern Time today, oil was priced at $95.29 per barrel with Brent serving as the benchmark (we’ll explain different benchmarks later in this article). That’s a loss of 11 cents compared with yesterday morning and more than $27 higher than the price one year ago.
It’s impossible to forecast oil prices with detailed precision. Many different elements affect the market, but ultimately it boils down to supply and demand. When worries about economic recession, war, and other large-scale disruptions increase, oil’s path can shift fast.
Gas prices at the pump don’t only track crude oil. They also include what it takes to refine and move that fuel, the taxes layered on top, and the extra markup your local station adds to stay in business.
Since crude oil generally makes up a majority of the per-gallon cost, changes in its price have an outsized impact. When oil surges, gas prices typically rise in tandem. But when oil retreats, gas prices often lag on the way down, a trend sometimes described as “rockets and feathers.”
In case of emergency, the U.S. has a store of crude oil known as the Strategic Petroleum Reserve. Its primary purpose is energy security in case of disaster (think sanctions, severe storm damage, even war). But it can also go a long way toward softening crippling price hikes during supply shocks.
It’s not a long-term answer and is more meant to provide temporary relief, assisting consumers and keeping critical parts of the economy running, like key industries, emergency services, public transportation, etc.
Both oil and natural gas are key sources of the energy we use every day. Because of this, a big change in oil prices can affect natural gas. For example, if oil prices increase, some industries may swap natural gas for some segments of their operations where possible, which increases demand for natural gas.
To gauge oil’s performance, we often turn to two benchmarks:
Between these two, Brent better represents global oil performance because it prices much of the world’s traded crude. And, it’s often the best way to track historical oil performance. In fact, even the U.S. Energy Information Administration now uses Brent as its primary reference in its Annual Energy Outlook.
Looking at the Brent benchmark across several decades, oil has been anything but steady. It’s seen spikes due to factors such as wars and supply cuts, and it’s also seen crashes from global recessions and an oversupply (called a “glut”). For example:
All to say, oil’s historical performance has been anything but smooth. Again, it’s hugely affected by wars, recessions, OPEC whims, evolving energy initiatives and policies, and much more.
Looking to stay up-to-date regarding the latest energy developments? Check out our recent coverage:
The current price of oil per barrel depends largely on supply and demand, including news about potential future supply and demand (geopolitics, decisions made by OPEC+, etc.). In the U.S., prices also move based on how friendly an administration is to drilling, as it can affect future supply. For example, 2025 saw the Trump administration move to reopen more than 1.5 million acres in the Coastal Plain of the Arctic National Wildlife Refuge for oil and gas leasing, reversing the Biden administration’s policy of limiting oil drilling in the Arctic.
The price of oil updates constantly when the “futures” markets are open. A futures market is effectively an auction where people agree to buy or sell oil in the future. As long as people and companies are trading contracts, the oil price is changing.
In short, shale is rock that contains oil and natural gas. Think of shale as energy yet to be tapped. The more shale the U.S. accesses, the more energy we’ll have—and the more easily oil prices can keep from spiking as much thanks to a greater supply.
When oil is expensive, it tends to make everyday items cost more. This can be related to energy (your heating, gas utilities, etc.), but it’s also due to the logistics involved with making those items accessible to you. Shipping, for example, can affect the price of things at the grocery store, as it’s more expensive to get those products from warehouses and farms onto the shelf.
Gold Price Forecast: XAU/USD Extends Rally as US Debt Concerns Weigh on Dollar
Gold prices extended their rally on [current date], with XAU/USD climbing to [price] as persistent US debt concerns continued to drag the US Dollar lower, boosting demand for the safe-haven metal.
The primary catalyst for gold’s upward momentum is the ongoing weakness in the US Dollar, which has been pressured by escalating concerns over the US government’s debt levels and fiscal sustainability. As the dollar weakens, gold becomes more attractive to international buyers, as it is priced in dollars, and its relative value increases.
Additionally, market participants are closely monitoring the US debt ceiling negotiations and the potential for a government shutdown, which have historically led to increased volatility and a flight to safe-haven assets like gold. The uncertainty surrounding these fiscal issues has also weighed on Treasury yields, further supporting gold prices.
From a technical perspective, gold has broken above key resistance levels, confirming a bullish trend. The recent rally has pushed the price above the 50-day and 200-day moving averages, a signal often interpreted by traders as a strong bullish indicator. Momentum indicators, such as the Relative Strength Index (RSI), are also suggesting that the uptrend has room to continue, though the market may be approaching overbought conditions in the short term.
Traders are now eyeing the next resistance level at [price], with a potential target of [price] if the rally continues. On the downside, support is seen at [price], which could be tested if the dollar stabilizes or if there is a shift in market sentiment.
For investors, the ongoing rally in gold highlights the metal’s role as a hedge against economic uncertainty and currency devaluation. With the US debt situation unresolved, gold may continue to be a preferred asset for those looking to diversify their portfolios. However, it is important to note that gold prices are also influenced by a variety of factors, including interest rates, inflation, and global geopolitical events, so investors should remain cautious and consider a balanced approach.
In summary, gold prices are extending their rally as US debt concerns continue to undermine the US Dollar. The outlook remains positive for gold in the near term, but traders should be mindful of potential volatility and key technical levels. As always, staying informed about macroeconomic developments is crucial for making sound investment decisions.
Q1: Why does the US debt situation affect gold prices?
When there are concerns about US debt, the US Dollar often weakens because investors worry about the country’s fiscal health. Since gold is priced in dollars, a weaker dollar makes gold cheaper for foreign investors, increasing demand and pushing prices higher.
Q2: What are the key technical levels to watch in gold?
Currently, the next resistance level is around [price], and if broken, gold could target [price]. On the downside, support is at [price], which could be tested if the dollar strengthens or market sentiment shifts.
Q3: Is it a good time to invest in gold?
Gold can be a good addition to a diversified portfolio, especially during times of economic uncertainty. However, it’s important to consider your investment goals and risk tolerance, and to consult with a financial advisor before making any decisions.
This post Gold Price Forecast: XAU/USD Extends Rally as US Debt Concerns Weigh on Dollar first appeared on BitcoinWorld.
MCX Copper (31 Aug) at Rs 1,384.15/kg (+0.91%) on 21 Aug 2026. High: Rs 1,386.00. Low: Rs 1,375.50. Support: Rs 1,375. Resistance: Rs 1,386.00.
Quick Answer
The copper price prediction for Monday is sideways to mildly bullish. MCX Copper (31 Aug) closed at Rs 1,384.15/kg (+0.91%) on Friday 21 August, recovering alongside the broader commodity rally that saw all six MCX commodities gain on Friday. Ankit Jaiswal’s copper price prediction for Monday places support at Rs 1,375 to 1,377 and resistance at Rs 1,386.00.
The copper price prediction for Monday follows a Friday session where MCX Copper opened at Rs 1,376.95, reached Rs 1,386.00, and settled at Rs 1,384.15. Ankit Jaiswal, Research Analyst at Univest, notes that the copper price prediction for Monday reflects improving global industrial sentiment — Nifty Metal gained 0.86% on Friday, Hindustan Copper rose 0.90%, and MCX Copper’s 0.91% gain confirms this sector-level positive momentum heading into Monday.
Kunal Singla, Research Analyst at Univest, observes that the copper price prediction for Monday benefits from the broader commodity rally: gold breaching Rs 1,60,000, silver gaining 1.27%, and crude oil rising 0.61% all signal risk-on commodity sentiment that typically extends to base metals like copper. The Monday MCX Copper 24 Aug options expiry adds intraday volatility to the copper price prediction for Monday, with the Rs 1,400 call seeing heavy volume on Friday.
Click Here – Get Free Investment Predictions
Ankit Jaiswal’s copper price prediction for Monday identifies Rs 1,375 to 1,377 as the immediate support (near Friday’s low of Rs 1,375.50). A hold above Rs 1,375 in the copper price prediction for Monday confirms buyers are active at lower levels. Resistance in the copper price prediction for Monday stands at Rs 1,386.00, with a break above targeting Rs 1,392 to 1,395.
Trend for Monday 24 August 2026: Sideways to Mildly Bullish
Support: Rs 1,375 to 1,377 | Rs 1,364
Resistance: Rs 1,386.00 | Rs 1,392 to 1,395
| Stock | 21 Aug Close (Rs) | Change | Key Level for Monday |
|---|---|---|---|
| Hindalco Industries | 687 | +0.75% | Support: 680 | Resistance: 695 |
| Hindustan Copper | 568 | +0.90% | Support: 561 | Resistance: 575 |
| Tata Steel | 154 | +0.80% | Support: 152 | Resistance: 156 |
Explore Copper-Linked Stocks on Univest Screener
Sentiment for the copper price prediction for Monday is cautiously positive. Friday’s broad commodity rally — all six MCX commodities gaining — reflects risk-on sentiment that benefits base metals. Ankit Jaiswal notes that Nifty Metal’s 0.86% Friday gain is a strong equity-side validation of the copper price prediction for Monday.
Kunal Singla observes that Monday 24 August is also the MCX Copper 24 Aug options expiry, which will create intraday volatility in the copper price prediction for Monday. The Rs 1,400 call saw significant volume on Friday, indicating institutional positioning for a continued recovery in the copper price prediction for Monday.
Download the Univest iOS App or Univest Android App to track live Copper prices and get real-time predictions.
the 24 August copper price outlook, 24 August 2026, is sideways to mildly bullish. MCX Copper closed at Rs 1,384.15/kg (+0.91%) on 21 August. Ankit Jaiswal places support at Rs 1,375 and resistance at Rs 1,386.00.
Kunal Singla notes Monday 24 Aug MCX Copper options expiry adds intraday volatility — use defined stop-losses in the MCX copper price forecast for Monday. Download the Univest app for live MCX copper tracking.
Disclaimer: Investments in securities are subject to market risk. This content is for educational purposes only and does not constitute investment advice. Univest Research Analyst Registration No. INH000013776.
Ans. the copper price outlook for 24 August is sideways to mildly bullish. MCX Copper closed at Rs 1,384.15/kg (+0.91%) on 21 August. Ankit Jaiswal places support at Rs 1,375 and resistance at Rs 1,386.00 for the Monday’s MCX copper price forecast.
Ans. Support at Rs 1,375 to 1,377 and strong support at Rs 1,364. Resistance at Rs 1,386.00 and Rs 1,392 to 1,395 in the Wednesday’s copper price outlook.
Ans. Yes, MCX Copper 24 Aug options expire Monday, adding intraday volatility. Ankit Jaiswal recommends using futures for directional the MCX copper price forecast for Monday trades.
Ans. Hindustan Copper (+0.90% on 21 Aug) and Hindalco (+0.75%) are the primary equity proxies for the copper price outlook for 24 August. Watch these for sector-level confirmation.
Ans. Buy MCX Copper near Rs 1,375 with stop below Rs 1,364 targeting Rs 1,386.00 in the Monday’s MCX copper price forecast. A break above Rs 1,386 targets Rs 1,392.
Note: This blog is for information purpose only. Investments and trading are subject to market risks, read all scheme related documents carefully.
The Silver price broke decisively above $69 on Friday as the latest Dollar sell-off added fuel to a precious-metals rally that has gathered pace throughout the week.
The Silver to US Dollar (XAG/USD) price traded around $69.44, up 1.78% on the day and 7.35% higher over five sessions.
The metal has now gained just over 18% in one month, a dramatic recovery from July’s lows below $55.
The immediate macro driver remains the weaker Dollar, alongside the market’s reassessment of US Treasury policy after Washington increased long-dated bond buybacks.
Brian Lan, Managing Director at GoldSilver Central, said the Dollar decline had supported “not just gold but all precious metals”, while also highlighting the large shift in yields.
Silver has now cleared the $66.80-$67 resistance area that capped the market earlier in the week, leaving $70 as the first psychological hurdle and $72 as the next more meaningful technical test.
The metal’s tendency to amplify moves in gold remains a central feature of the rally.
Alexander Zumpfe of Heraeus Metals Germany expects that volatility to persist, saying: “Silver is expected to remain one of the most volatile precious metals in 2026”.
His LBMA forecast range for 2026 is exceptionally wide at $55-$105, with a $75 average, reflecting both the strength of investment demand and the risk that high prices erode industrial consumption.
For now, momentum remains firmly positive while XAG/USD holds above $67.
A sustained break through $70-$72 would strengthen the case for another leg higher, while a fall back beneath $66.80 would suggest the latest breakout has failed.
Our currency coverage draws on live market data, official economic releases and published bank research.
Domestic coffee prices today
Coffee prices today in the domestic market increased slightly compared to the previous session. According to giacaphe. com, the average coffee price on August 21st was 97,900 VND/kg, an increase of 100 VND/kg.
In Dak Lak, coffee prices were recorded at 97,900 VND/kg, an increase of 200 VND/kg compared to the previous session.
In Lam Dong, coffee prices reached 97,300 VND/kg, an increase of 100 VND/kg. This is the lowest level among the surveyed areas.
In Gia Lai, coffee prices are at 97,900 VND/kg, an increase of 200 VND/kg.
The old Dak Nong area recorded a level of 98,000 VND/kg, unchanged compared to the previous session. This is the highest level in today’s price list.
The increase is not large, but it helps the price level continue to hold close to the 98,000 VND/kg zone after previous strong fluctuations.
The USD/VND exchange rate according to Vietcombank was recorded at 25,870 VND/USD, down 90 VND.
World coffee prices
In the world market, coffee prices in the most recent session diễn biến trái chiều (developed in opposite directions).
According to Barchart, the September 2026 Arabica futures contract closed up 4.10 US cents/lb, equivalent to 1.14%. Conversely, the September 2026 Robusta futures contract fell 16 USD/ton, equivalent to 0.43%.
Barchart said Arabica increased as it continued to consolidate below the 6.5-month high price range. Meanwhile, Robusta was under pressure as Robusta inventory certified on ICE rose to a 5.25-month high.
This development shows that the support from the world market is not even. For Vietnam, Robusta is still the group that has a more direct impact on domestic purchasing prices, so the slight decrease in Robusta makes the domestic upward momentum only at a modest level.
Coffee price assessment
Domestic coffee prices increased slightly by 100-200 VND/kg in many regions, but have not created a clear breakthrough. The highest price level is currently at 98,000 VND/kg, still lower than the 100,000 VND/kg mark that the market had previously noticed.
A noteworthy point is that domestic prices still increased slightly even though Robusta London decreased in the most recent session. This shows that domestic prices are still affected by real supply and demand, the amount of goods in the people, the purchasing demand of export businesses and exchange rate fluctuations.
According to Barchart, drier weather in Brazil may support harvest progress, creating a price holding factor. Cooxupe Cooperative said harvests reached 81.1% as of August 14, up from last week but still lower than 86.1% in the same period last year.
Domestically, according to the Ministry of Agriculture and Environment, in July, Vietnam exported about 147,600 tons of coffee, worth 639.5 million USD. Accumulated in the first 7 months of the year, coffee exports reached about 1.2 million tons, an increase of 10.8% in volume but turnover decreased by 11.2%, to 5.45 billion USD. The main reason is that the average export price decreased by 19.9% compared to the same period, down to 4,537 USD/ton.
Regarding the weather, the National Center for Hydro-Meteorological Forecasting said that on the day and night of August 21, the Central Highlands area will have showers and thunderstorms in some places; especially in the afternoon and evening there will be showers, scattered thunderstorms, locally heavy rain. Lowest temperature 20-23 degrees C, highest 27-30 degrees C.
This season’s thunderstorms need to be monitored in terms of garden care, pest and disease prevention, and goods preservation.
In the coming sessions, the diễn biến of Robusta London, Arabica New York, USD/VND exchange rate, inventory and demand for export purchases will continue to dominate the domestic price level.