The main tag of Gold Price Articles.
You can use the search box below to find what you need.
[wd_asp id=1]
The main tag of Gold Price Articles.
You can use the search box below to find what you need.
[wd_asp id=1]
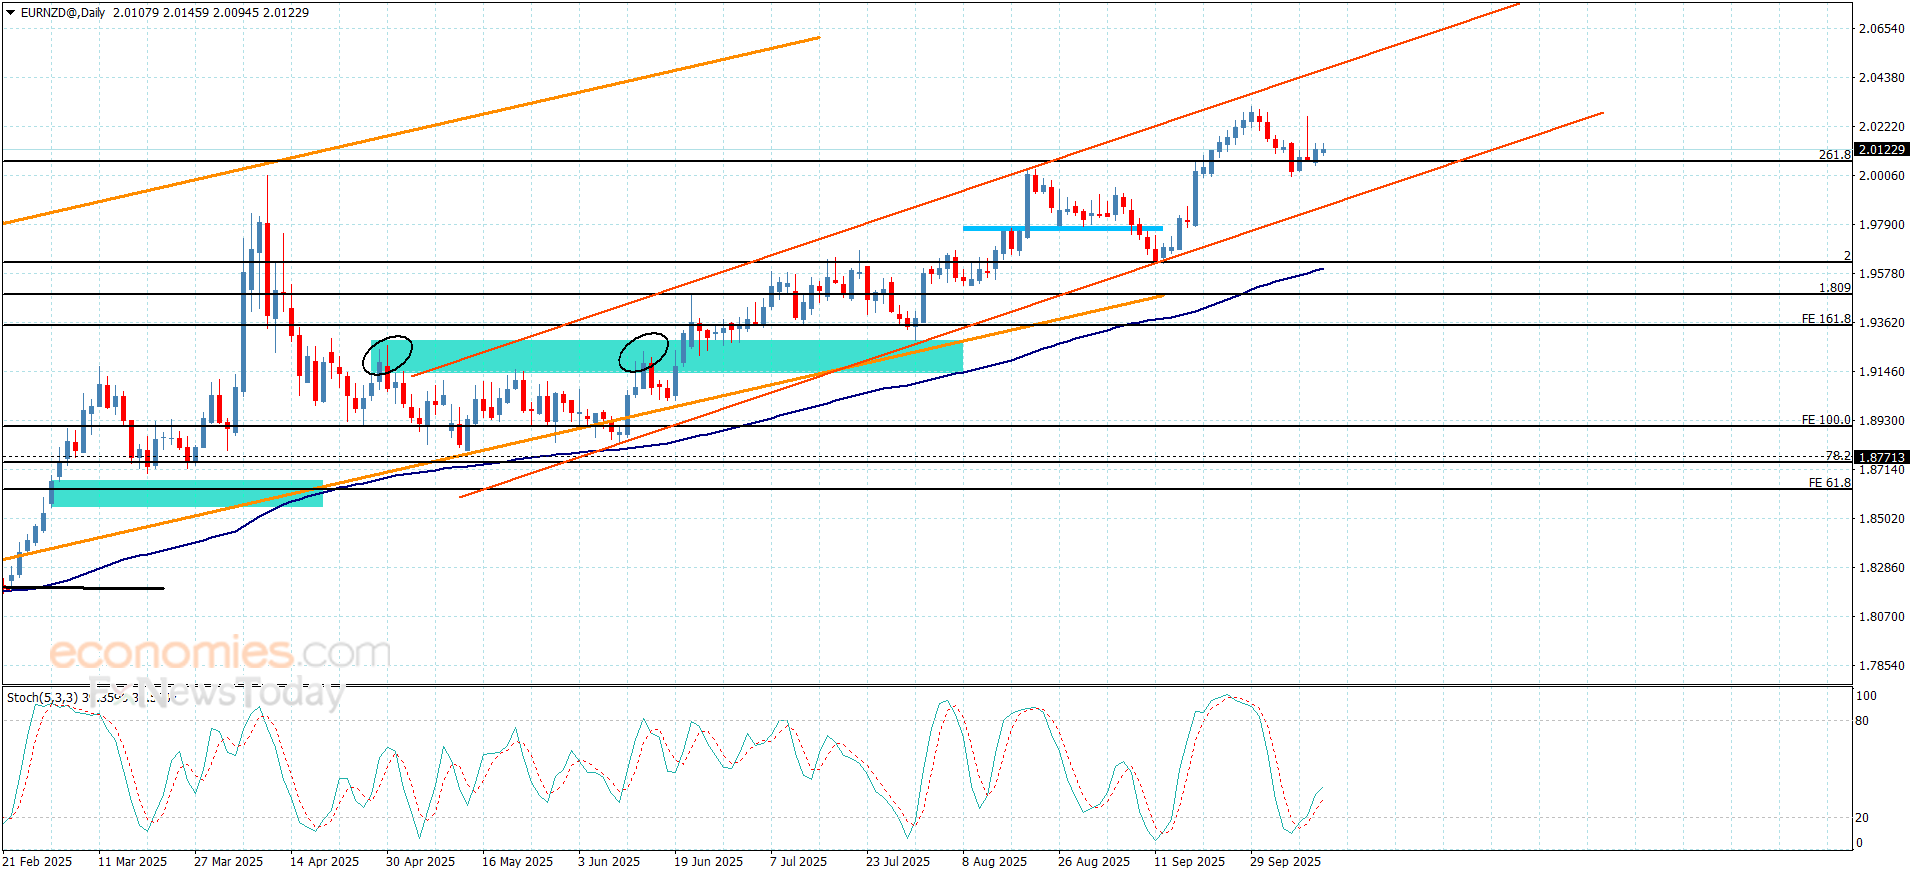
The EURNZD succeeded in getting rid of the negative pressure, to end the bearish corrective track by providing new positive close above the extra support at 2.0050, forming bullish waves and its stability near 2.0115.
Note that the main stability within the bullish channel’s levels, and stochastic attempt to provide positive momentum will assist to confirm the bullish scenario, which might target 2.0215 and 2.0295.
The expected trading range for today is between 2.0070 and 2.0215
Trend forecast: Bullish
The 10-day moving average at $3,926, steadily rising, marks the nearest support. Given its proximity to yesterday’s low of $3,944, gold could test this level with minimal downside. This average has been reliable dynamic support since the uptrend began at the $3,311 swing low in August, anchoring the rally.
If it holds, the short-term bias remains upward. However, a decisive break below $3,926, confirmed by a daily close below, would shift focus to the 20-day moving average at $3,818, a more robust support given its longer scope. This week’s low of $3,884 sits above the 20-day line, so a breach below it would signal increased selling pressure.
Should the 20-day average fail, a deeper support zone between $3,707 and $3,619 comes into view, defined by prior consolidation and a measured move matching the prior 10.8% correction. At the lower end, an 18.8% decline—mirroring the last bearish pullback—would align with the 50-day moving average, expected to enter this range soon. This convergence enhances the zone’s significance as a potential floor. A drop to this level would indicate strong supply but remain within the bounds of a healthy correction in the broader uptrend.
Gold’s bullish bias holds as long as the 10-day average at $3,926 supports prices. A weekly close above $4,001 reinforces the uptrend, while a break below $3,884 flags weakness. Traders should watch today’s close for confirmation and monitor $3,818 for signs of deeper selling or a bullish rebound.
For a look at all of today’s economic events, check out our economic calendar.
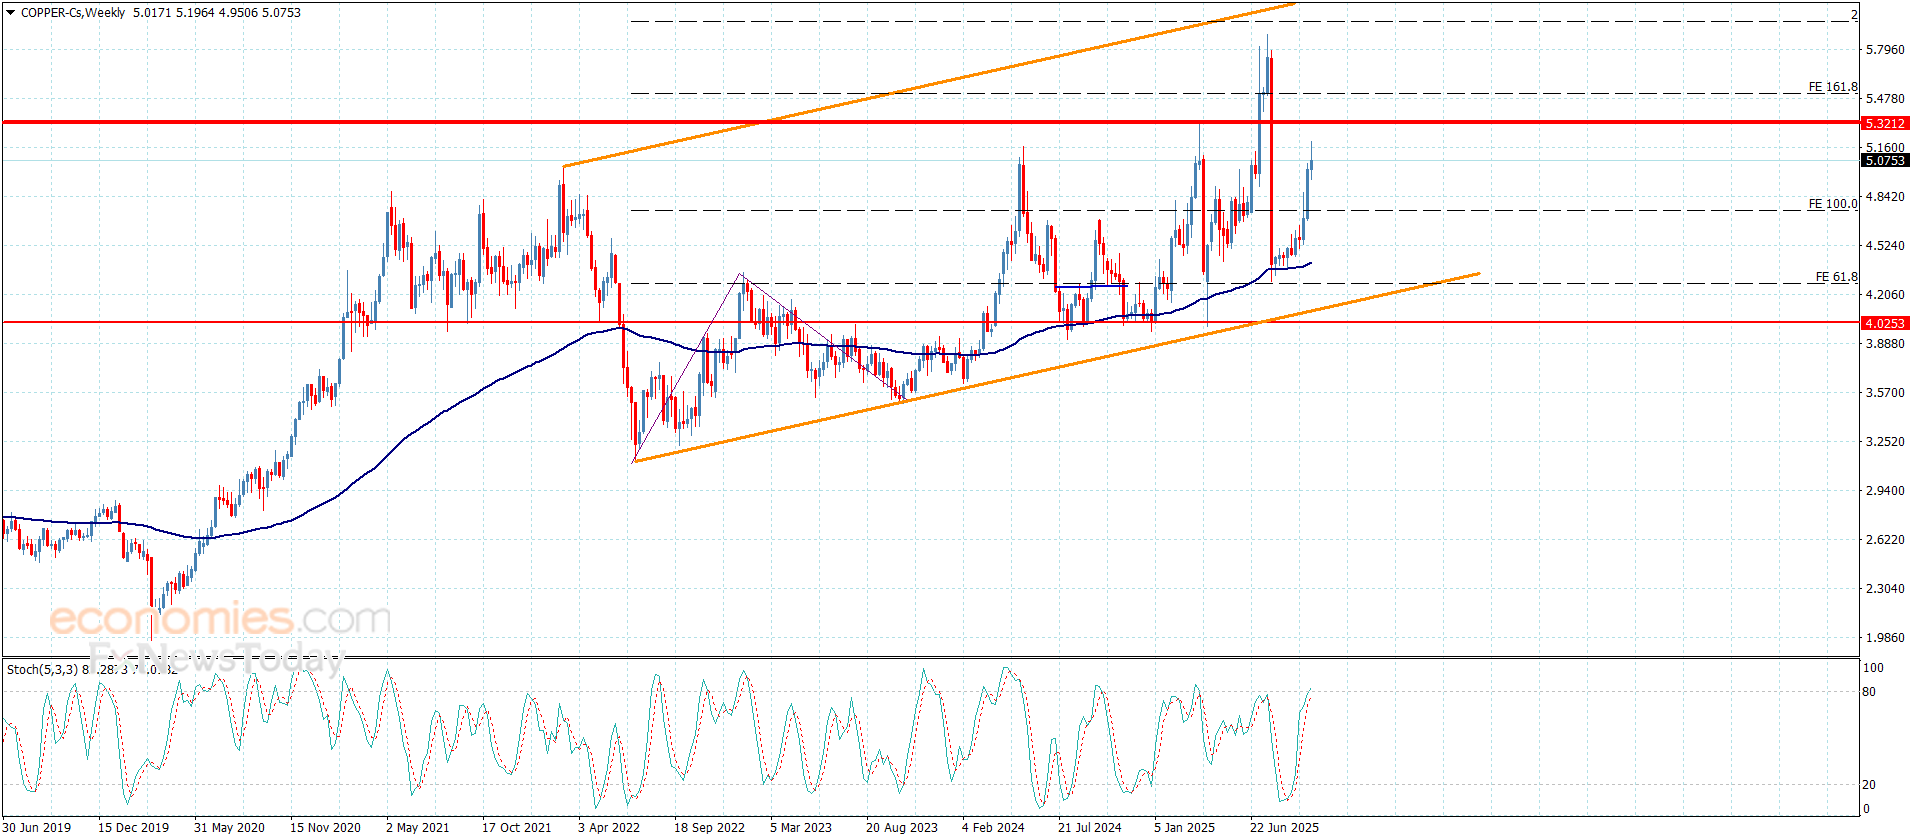
The next downside target is the 50-day moving average at $3.03, closely aligned with a falling upper-quarter channel line that previously capped swing highs in September. This convergence suggests a potential support zone, as the line may now flip from resistance to support. A daily close below $3.16 today would confirm the breakdown below the 20-day average, reinforcing bearish momentum. Traders should watch this $3.03 – $3.05 area closely for signs of buying interest or further capitulation.
Thursday’s bearish reversal confirmed a double top pattern, triggered by a close below the $3.30 neckline. This pattern formed against strong resistance at the 200-day moving average, the top of a falling channel, and an extended rising channel line. Such failed breakouts often lead to sharp reversals, and today’s plunge further supports that thesis. If selling persists, the lower boundary of the rising channel could come into play, potentially aligning with deeper support near $2.95, where multiple indicators converge.
A key price zone looms at $2.95, where the lower rising channel line intersects the falling upper-quarter channel line in roughly seven days. This area gains added significance with a gap fill at $2.97 and an anchored Volume Weighted Average Price (VWAP) nearby at the same level. This trifecta of technical markers makes $2.95 – $2.97 a higher-probability potential support zone, if it is approached.
The weekly chart, poised to close near its lows with a bearish pattern after falling below last week’s low, further tilts the odds toward sellers. A rally above $3.30 would challenge this outlook, but for now, bears hold the reins. Watch Friday’s close for confirmation.
For a look at all of today’s economic events, check out our economic calendar.
The (ETHUSD) price rose in its last trading on the intraday basis, after its leaning on the support level of $4,275, gaining some bullish momentum that helped it to achieve these gains, this support was our suggested target in our previous analysis, to attempt to recover some of the previous losses, attempting to offload some of its clear oversold conditions on the relative strength indicators, especially with the emergence of the positive signals from there, amid the dominance of bearish corrective wave on the short-term basis, with the continuation of the negative pressure due to its trading below EMA50, which reduces the chances of the price recovery on the near-term basis.
Get high-accuracy trading signals delivered directly to your Telegram. Subscribe to specialized packages tailored for the world’s top markets:
Full VIP signals performance report for Sept 29 – Oct 3, 2025:
West Texas Intermediate (WTI) Oil price falls on Friday, early in the European session. WTI trades at $60.99 per barrel, down from Thursday’s close at $61.16.
Brent Oil Exchange Rate (Brent crude) is also shedding ground, trading at $64.82 after its previous daily close at $64.99.
WTI Oil is a type of Crude Oil sold on international markets. The WTI stands for West Texas Intermediate, one of three major types including Brent and Dubai Crude. WTI is also referred to as “light” and “sweet” because of its relatively low gravity and sulfur content respectively. It is considered a high quality Oil that is easily refined. It is sourced in the United States and distributed via the Cushing hub, which is considered “The Pipeline Crossroads of the World”. It is a benchmark for the Oil market and WTI price is frequently quoted in the media.
Like all assets, supply and demand are the key drivers of WTI Oil price. As such, global growth can be a driver of increased demand and vice versa for weak global growth. Political instability, wars, and sanctions can disrupt supply and impact prices. The decisions of OPEC, a group of major Oil-producing countries, is another key driver of price. The value of the US Dollar influences the price of WTI Crude Oil, since Oil is predominantly traded in US Dollars, thus a weaker US Dollar can make Oil more affordable and vice versa.
The weekly Oil inventory reports published by the American Petroleum Institute (API) and the Energy Information Agency (EIA) impact the price of WTI Oil. Changes in inventories reflect fluctuating supply and demand. If the data shows a drop in inventories it can indicate increased demand, pushing up Oil price. Higher inventories can reflect increased supply, pushing down prices. API’s report is published every Tuesday and EIA’s the day after. Their results are usually similar, falling within 1% of each other 75% of the time. The EIA data is considered more reliable, since it is a government agency.
OPEC (Organization of the Petroleum Exporting Countries) is a group of 12 Oil-producing nations who collectively decide production quotas for member countries at twice-yearly meetings. Their decisions often impact WTI Oil prices. When OPEC decides to lower quotas, it can tighten supply, pushing up Oil prices. When OPEC increases production, it has the opposite effect. OPEC+ refers to an expanded group that includes ten extra non-OPEC members, the most notable of which is Russia.
Gold price (XAU/USD) trades 0.4% higher to near $3,995.00 during the European trading session on Friday. The yellow metal stabilized after a corrective move on Thursday, which followed a fresh all-time high of nearly $4,060 posted on Wednesday.
Four-day winning streak in the precious metal halted after Israel and Hamas signed a ceasefire agreement to end the war in Gaza. According to the first phase of the ceasefire, the Israeli army has released hostages and Hamas has now 72 hours to release Israeli hostages, BBC News reported.
Theoretically, easing geopolitical tensions diminishes demand for safe-haven assets, such as Gold.
However, the outlook for the Gold price remains firm as comments from Federal Reserve officials have signaled that more interest rate cuts are highly likely in the remaining year.
On Thursday, New York Fed Bank President John Williams and San Francisco Federal Reserve Bank President Mary Daly call for more interest rate cuts this year, citing downside risks to the labour market. “We’re to a point now where the softening in the labor market looks like it could be more worrisome if we don’t risk manage it, Daly said, Reuters reported. On the current status of inflation, Daly stated that growth in price pressures has come “much less than had been feared”.
Lower interest rates by the Fed bode well for non-yielding assets, such as Gold.
Gold price retraces after posting a fresh all-time high near $4,060. However, the overall trend of the Gold price remains bullish as the 20-day Exponential Moving Average (EMA) slopes higher around $3,834.10. The upward-sloping trendline from the August 22 low around $3,321.50 will act as key support for the Gold price.
The 14-day Relative Strength Index (RSI) stays above 60.00 for a long period, suggesting a strong bullish momentum.
On the upside, the Gold price could extend its upside towards $4,100. Looking down, the October 2 high of around $3,900 would act as key support.
Gold has played a key role in human’s history as it has been widely used as a store of value and medium of exchange. Currently, apart from its shine and usage for jewelry, the precious metal is widely seen as a safe-haven asset, meaning that it is considered a good investment during turbulent times. Gold is also widely seen as a hedge against inflation and against depreciating currencies as it doesn’t rely on any specific issuer or government.
Central banks are the biggest Gold holders. In their aim to support their currencies in turbulent times, central banks tend to diversify their reserves and buy Gold to improve the perceived strength of the economy and the currency. High Gold reserves can be a source of trust for a country’s solvency. Central banks added 1,136 tonnes of Gold worth around $70 billion to their reserves in 2022, according to data from the World Gold Council. This is the highest yearly purchase since records began. Central banks from emerging economies such as China, India and Turkey are quickly increasing their Gold reserves.
Gold has an inverse correlation with the US Dollar and US Treasuries, which are both major reserve and safe-haven assets. When the Dollar depreciates, Gold tends to rise, enabling investors and central banks to diversify their assets in turbulent times. Gold is also inversely correlated with risk assets. A rally in the stock market tends to weaken Gold price, while sell-offs in riskier markets tend to favor the precious metal.
The price can move due to a wide range of factors. Geopolitical instability or fears of a deep recession can quickly make Gold price escalate due to its safe-haven status. As a yield-less asset, Gold tends to rise with lower interest rates, while higher cost of money usually weighs down on the yellow metal. Still, most moves depend on how the US Dollar (USD) behaves as the asset is priced in dollars (XAU/USD). A strong Dollar tends to keep the price of Gold controlled, whereas a weaker Dollar is likely to push Gold prices up.

The Netherlands-based banking group ING has published updated forecasts for the prices of Brent Crude oil and Dutch TTF natural gas through 2028.
Find the plan that suits you best.
Full digital access to all news for 1 month
Full digital access to all news for 3 months
-33%
Full digital access to all news for 6 months
-36%
Full digital access to all news for 1 year
-41%
Here we are to serve you with news right now. It does not cost much, but worth your attention.
Choose to support open, independent, quality journalism and subscribe on a monthly basis.
By subscribing to our online newspaper, you can have full digital access to all news, analysis, and much more.
Subscribe
You can also follow AzerNEWS on Twitter @AzerNewsAz or Facebook @AzerNewsNewspaper
Thank you!
The (ETHUSD) price rose in its last trading on the intraday basis, after its leaning on the support level of $4,275, gaining some bullish momentum that helped it to achieve these gains, this support was our suggested target in our previous analysis, to attempt to recover some of the previous losses, attempting to offload some of its clear oversold conditions on the relative strength indicators, especially with the emergence of the positive signals from there, amid the dominance of bearish corrective wave on the short-term basis, with the continuation of the negative pressure due to its trading below EMA50, which reduces the chances of the price recovery on the near-term basis.
Get high-accuracy trading signals delivered directly to your Telegram. Subscribe to specialized packages tailored for the world’s top markets:
Full VIP signals performance report for Sept 29 – Oct 3, 2025:
Gold’s rally has turned heads this year, but silver and platinum are leading a broader rush into hard assets.
Spot silver is trading around $50 per ounce, up about 70% year to date after touching its record high above $51 per ounce on Thursday.
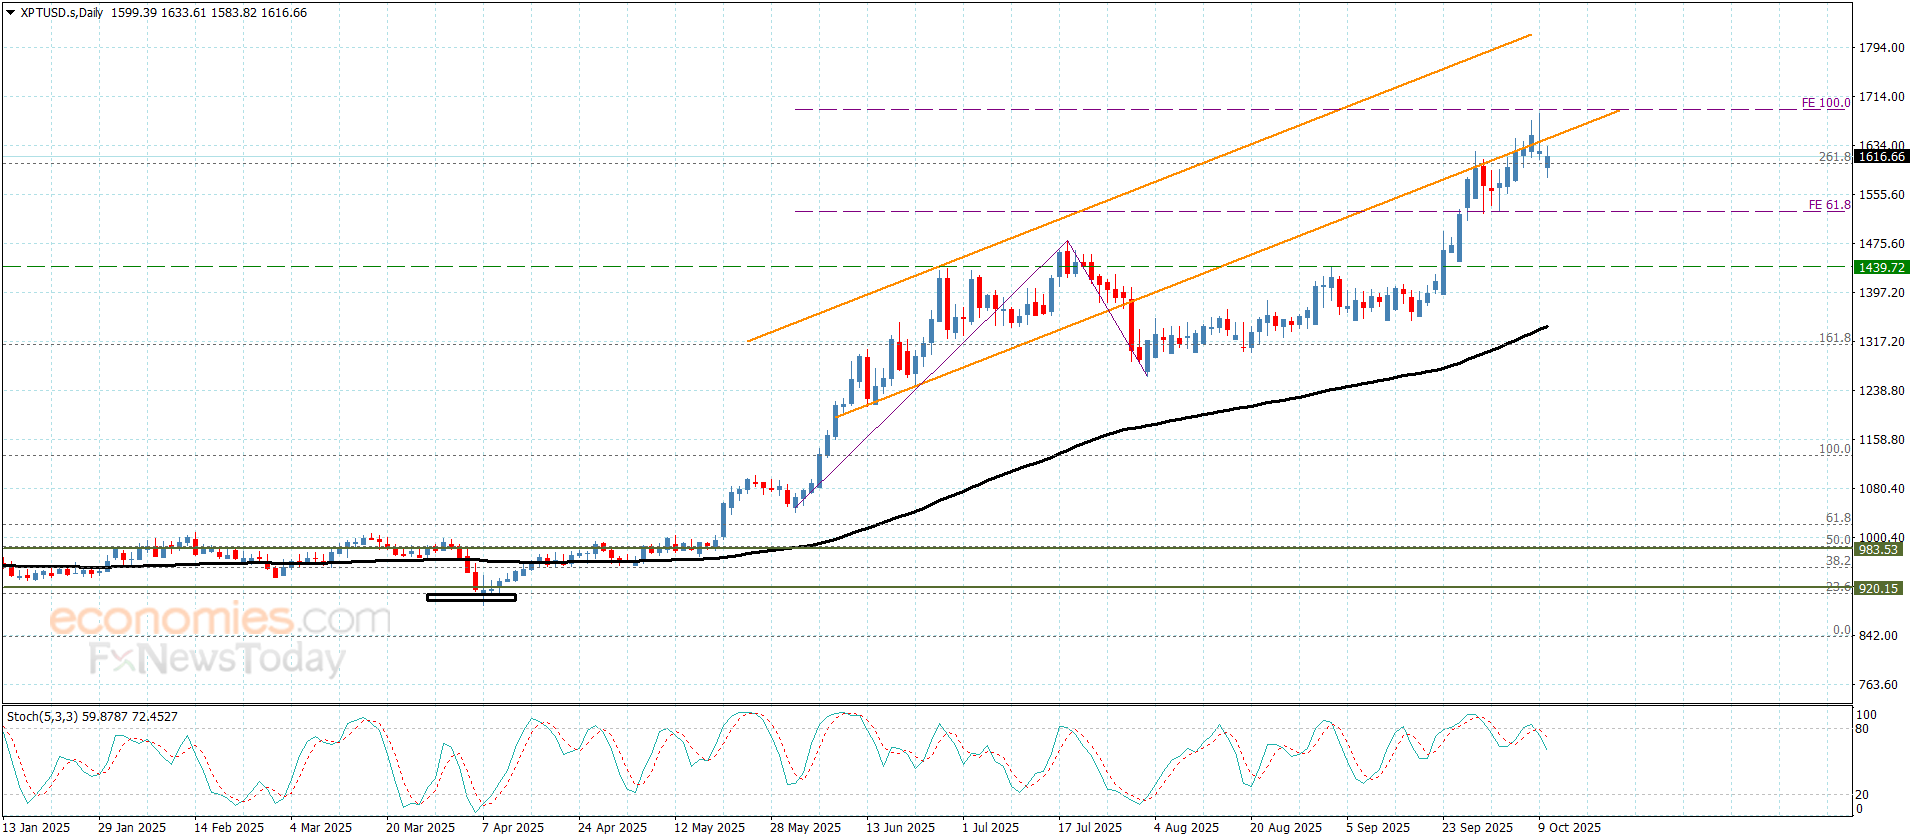
Meanwhile, spot platinum is trading near $1,620 per ounce, up a staggering 80% year-to-date and around 13-year highs.
The rush into silver reflects how the white metal — alongside assets like bitcoin — is now seen as “easy-access global inflation havens,” wrote Thierry Wizman, a global foreign exchange and rates strategist at Macquarie Group, on Wednesday.
Gold’s performance — while impressive — slightly trails silver and platinum.
Spot gold prices are up 52% this year, having smashed through the $4,000 per ounce level on Tuesday. The yellow metal was trading around $3,978 per ounce at 10:11 p.m. ET on Thursday.
The synchronized rally across gold, silver, and platinum isn’t just about inflation hedging or interest rate expectations — it reflects something deeper, wrote Ole Hansen, the head of commodity strategy at Saxo Bank, on Wednesday.
The powerful gains “point to a broader trend of a rotation into ‘tangible stores of value’ across the precious metals complex,” Hansen wrote.
“In an increasingly fragmented world, the West’s weaponization of markets, payment systems, and reserve assets has eroded confidence in traditional safe havens such as the US dollar and Treasuries,” Hansen added, highlighting the West’s sanctions against Russia for its full-scale invasion of Ukraine in 2022.
That erosion of trust, Hansen argues, is driving both institutional and sovereign investors to seek security outside the traditional financial system.
The shift has fueled an unprecedented wave of gold buying by global central banks — a signal that the appetite for real, unencumbered assets is now structural, not speculative.
“The result is a market no longer dominated by short-term speculative money reacting to real-rate moves, but by a persistent structural bid for security,” Hansen wrote.
Beyond long-term structural flows, geopolitics have added fresh fuel to gold’s ascent this year.
Analysts point to President Donald Trump’s new trade tariffs, which could stoke inflation, as well as concerns about the Federal Reserve’s independence and the US government’s debt load.
“The US now spends more on interest payments than on defense — a statistic that underpins the appeal of holding assets that carry no counterparty risk,” wrote Hansen.
Gold’s rally, he wrote, has become “a mirror of waning confidence in the old financial order.”
“For decades, investors treated US Treasuries as the global risk-free benchmark. Today, the market’s message is subtler: ‘risk-free’ and ‘trust-free’ are no longer synonymous,” he added.
While questions are building over how long gold’s record rally can last, top forecasters are bullish over the yellow metal’s outlook.
Earlier this week, Goldman Sachs lifted its December 2026 gold price forecast to $4,900 per ounce from $4,300, citing strong inflows into Western gold ETFs and central bank demand.
“If investors increasingly see political and financial systems as intertwined — and potentially vulnerable — the argument for holding unencumbered tangible assets strengthens,” wrote Hansen.
“It may represent a collective reappraisal of trust, sovereignty, and what it truly means to be ‘safe.’ In that sense, the market is not just questioning the old order — it may already be pricing in the next one,” he wrote.
Gold is looking to build on Thursday’s late rebound as buyers aim for the key $4,000 level once again early Friday, snapping the corrective decline from lifetime highs of $4,059 set on Wednesday.
Bracing for the eighth consecutive weekly advance, Gold buyers look to resume the record-setting rally in Asian trading on Friday.
Markets remain risk-averse as the US government shutdown is seen stretching into the next week as the Senate wound up for a long weekend holiday, not back until Tuesday.
Further, declining Asian stocks and a pause in the US Dollar (USD) upsurge also lend support to the bullion as traders digest the latest dovish commentary from Federal Reserve (Fed) policymakers.
New York (NY) Fed President John Williams told the NY Times on Thursday that he supports further interest rate cuts this year, per Reuters.
Meanwhile, San Francisco Fed President Mary Daly noted early Friday that “the Fed is projecting additional cuts, but in risk management.”
Markets now eagerly await the release of the University of Michigan (UoM) Consumer Sentiment and Inflation Expectations data for fresh policy insights and trading impetus, in the wake of delayed key statistics and Fed Chair Jerome Powell’s no-show on monetary policy.
Investors also take account of the latest report carried by the NY Times, citing that the US Bureau of Labor Statistics (BLS) plans to publish the September Consumer Price Index (CPI) report despite the ongoing government shutdown.
However, the inflation data is unlikely to be released on October 15, originally scheduled.
The daily chart shows that the 14-day Relative Strength Index (RSI) is off the extreme overbought zone but remains near 75, as of writing.
The leading indicator suggests that buyers could regain full vigour, with a retest of the all-time high of $4,059 likely. A sustained break above that will call for a test of the $4,100 – the upper boundary of the rising channel.
To the downside, Gold needs to crack the lower boundary of the rising channel at $3,962 on a weekly candlestick closing basis to sustain the correction toward the $3,900 round figure.
The October 2 low of $3,819 will be next on sellers’ radars, where the 21-day Simple Moving Average (SMA) approaches.
Gold has played a key role in human’s history as it has been widely used as a store of value and medium of exchange. Currently, apart from its shine and usage for jewelry, the precious metal is widely seen as a safe-haven asset, meaning that it is considered a good investment during turbulent times. Gold is also widely seen as a hedge against inflation and against depreciating currencies as it doesn’t rely on any specific issuer or government.
Central banks are the biggest Gold holders. In their aim to support their currencies in turbulent times, central banks tend to diversify their reserves and buy Gold to improve the perceived strength of the economy and the currency. High Gold reserves can be a source of trust for a country’s solvency. Central banks added 1,136 tonnes of Gold worth around $70 billion to their reserves in 2022, according to data from the World Gold Council. This is the highest yearly purchase since records began. Central banks from emerging economies such as China, India and Turkey are quickly increasing their Gold reserves.
Gold has an inverse correlation with the US Dollar and US Treasuries, which are both major reserve and safe-haven assets. When the Dollar depreciates, Gold tends to rise, enabling investors and central banks to diversify their assets in turbulent times. Gold is also inversely correlated with risk assets. A rally in the stock market tends to weaken Gold price, while sell-offs in riskier markets tend to favor the precious metal.
The price can move due to a wide range of factors. Geopolitical instability or fears of a deep recession can quickly make Gold price escalate due to its safe-haven status. As a yield-less asset, Gold tends to rise with lower interest rates, while higher cost of money usually weighs down on the yellow metal. Still, most moves depend on how the US Dollar (USD) behaves as the asset is priced in dollars (XAU/USD). A strong Dollar tends to keep the price of Gold controlled, whereas a weaker Dollar is likely to push Gold prices up.