The main tag of Gold Price Articles.
You can use the search box below to find what you need.
[wd_asp id=1]
The main tag of Gold Price Articles.
You can use the search box below to find what you need.
[wd_asp id=1]
The EURJPY pair succeeded in facing stochastic negativity by its stability above 172.00 level yesterday, to form some of the bullish waves to approach from the barrier at 173.50, forming an obstacle against the attempts of resuming the bullish attack.
To confirm the attempts of resuming the bullish attack, we recommend waiting for breaching the barrier and providing positive close above it, to increase the chances for recording extra gains that might extend to 174.25 reaching 1.809%Fibonacci extension level at 175.20, while the price failure to breach this level will force it to provide more of the sideways trading, and there is a new chance to decline towards 171.60.
The expected trading range for today is between 172.60 and 174.25
Trend forecast: Bullish
GameStop Corporation (GME) stock extended its gains in its latest intraday trading, successfully breaking above the key resistance level of 24.50. This significantly increases the chances of extending the short-term corrective bullish trend, especially with the stock continuing to trade above its previous 50-day SMA, which provides renewed positive momentum. Additional support comes from positive signals in the Stochastic indicators, despite being in strongly overbought territory.
High-risk warning: GME belongs to the so-called “meme stocks,” which are characterized by extreme speculative trading. As a result, the stock’s movement often deviates from technical expectations or financial reports and can sometimes be highly unpredictable.
Therefore, we expect the stock to rise in its upcoming trading, provided it confirms the breakout of the mentioned resistance at 24.50 and holds above it, to then target its next resistance at 28.40.
Today’s price forecast: Bullish.
Gold (XAU/USD) continues to press record territory, trading around $3,685 per ounce after reaching an intraday high of $3,695.50. Spot prices climbed 40% year-to-date, making 2025 one of the strongest years in decades for bullion. August CPI rose 0.4% month-on-month and 2.9% annually, while jobless claims surged to 263,000 — the highest since 2021 — fueling stagflation concerns. Nonfarm payroll growth slowed to just 22,000, while unemployment rose to 4.3%. This macro backdrop has investors nearly fully pricing a 25 bps rate cut at the Fed’s September meeting, with a 7% chance of a larger 50 bps cut. Historically, easing cycles have provided powerful support for non-yielding assets like gold.
Major institutions have raised price projections. UBS now expects gold to reach $3,800/oz by year-end and $3,900/oz by mid-2026, citing a 200-basis-point Fed easing cycle and a weaker dollar. Commerzbank also raised its end-2026 target to $3,800, up from $3,600. Goldman Sachs is more aggressive, suggesting a base case of $4,000 by mid-2026 and even a $4,500–$5,000 tail scenario if U.S. political pressures undermine Fed independence. The investment bank notes that if just 1% of privately held Treasuries were reallocated into bullion, it could drive the next leg higher. Analysts emphasize that unlike the volatile spike of 1980 — when gold peaked at $850 ($3,590 inflation-adjusted) — today’s surge is supported by deeper liquidity, ETFs, and institutional allocations.
ETF flows are approaching historic records, with total holdings forecast to exceed 3,900 metric tons by the end of 2025, nearly touching the all-time high of 3,915 tons from October 2020. Weekly inflows have already surpassed 700 tons this year, marking one of the most aggressive institutional accumulation phases on record. Central banks remain net buyers at roughly 900–950 tons in 2025, slightly below last year’s record 1,000 tons. This ongoing official sector demand reflects geopolitical hedging, especially in emerging markets diversifying away from the dollar. The total value of London vault reserves surpassed $1 trillion last month, showing how institutions continue to build long-term gold positions.
The U.S. dollar index sits at 97.7, down on the month, while five-year TIPS yields dropped over 20 bps to their lowest since mid-2022, both of which are historically bullish for gold. Real rates are now projected to fall further into year-end as easing accelerates. With U.S. President Donald Trump repeatedly pressing for lower interest rates, and markets already pricing three cuts before year-end, the environment for gold remains highly favorable. Treasury demand has weakened under this policy backdrop, redirecting flows into bullion as an alternative safe-haven hedge.
On the technical side, gold remains firmly bullish. The 20-day EMA is trending higher at $3,518, while the RSI has surged to 80, bordering on overbought territory but consistent with strong momentum phases. Key resistance sits at $3,700, which if broken could open the path to $3,800 in the near term. Support lies first at $3,500 and deeper around $3,360, but each dip has been consistently absorbed by buyers this year. Year-on-year, gold has climbed from $2,529 in September 2024 to $3,685 now, a 45% gain. Over the past month alone, prices surged 9.4%, highlighting the sustained bid under current macro stress.
Beyond institutions, retail and corporate participation has grown. In the U.S., consumer access through Costco (NASDAQ:COST) has gained traction as the retailer sells gold bars, silver coins, and platinum, broadening exposure for households looking to hedge inflation. In Asia, physical demand has stayed resilient even with higher prices, while in Europe, wealth managers are allocating mid-single-digit portfolio weights to bullion as a defensive anchor. Analysts stress that the current rally is not purely speculative but reflects broad structural allocation shifts.
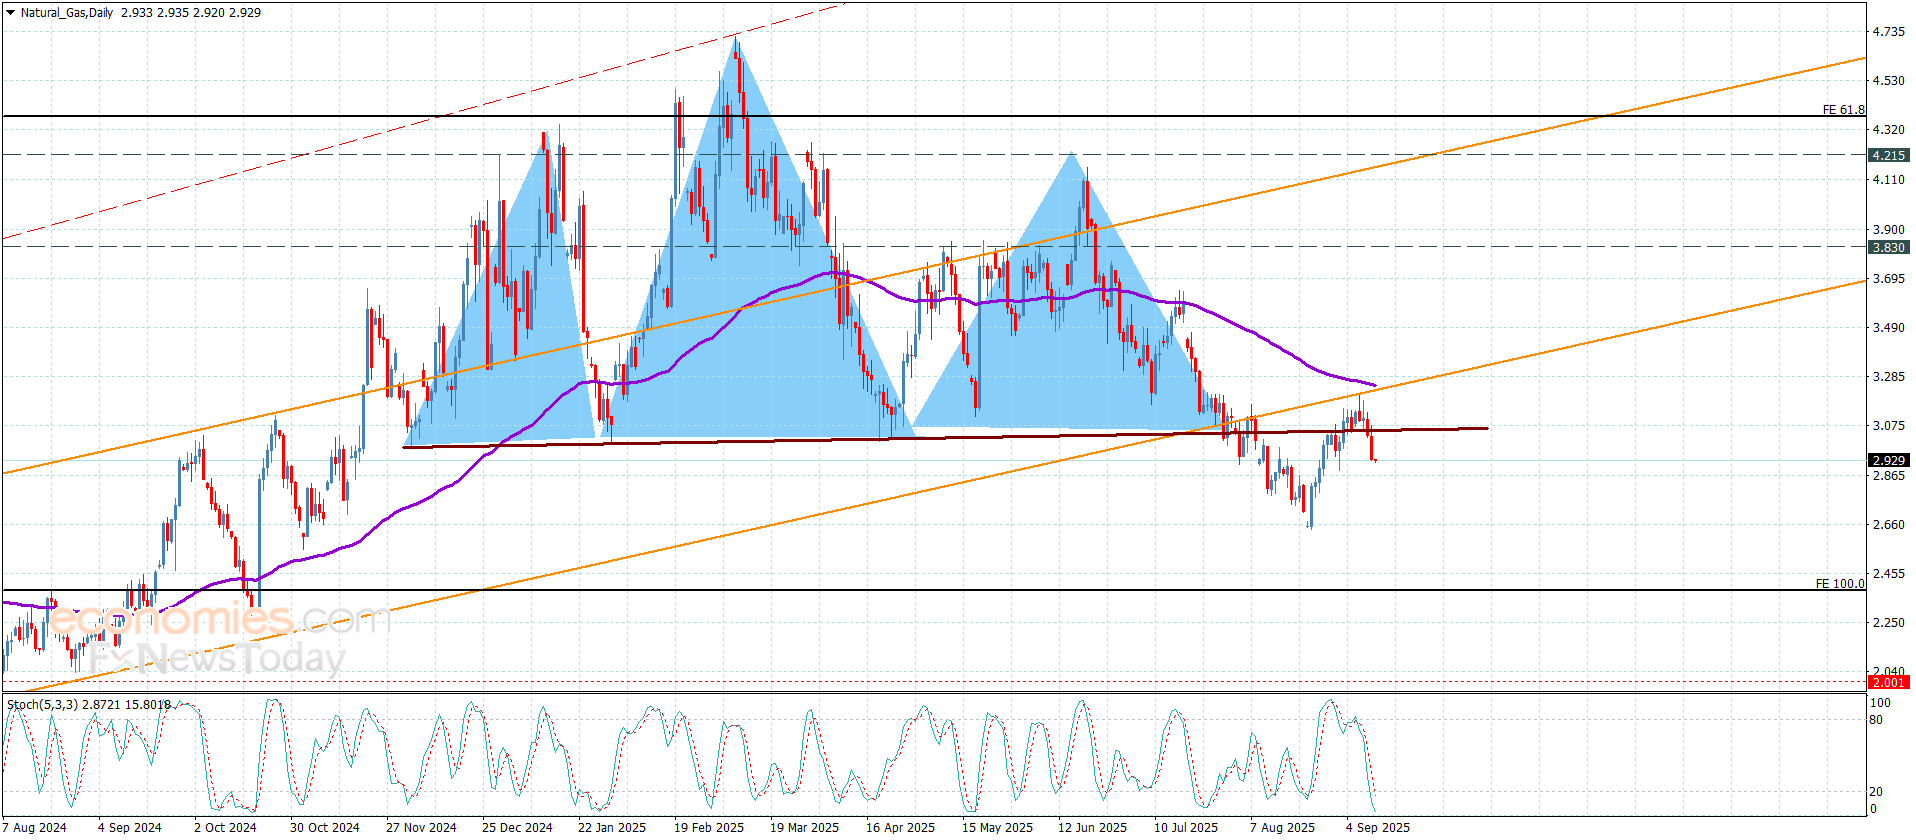
The confluence of the 20-Day moving average at $2.92 and the 50% retracement at $2.91 marks the first notable support area. This zone has contained declines over the past two days, and a bullish reversal could still trigger from here. If today’s low is broken, however, further downside levels come into focus, including the interim swing low at $2.87 and the 61.8% Fibonacci retracement at $2.84. Both align with the midpoint line of the large descending channel highlighted on the chart.
Natural gas continues to respect the structure of the descending channel. The center line was tested as support in March and as resistance in mid-August, and most recently, the upper quarter line capped the September 8 swing high. These repeated interactions reinforce the channel’s importance as a guide. If the 61.8% retracement fails to hold, the lower center line of the channel becomes the next downside target. Certainly, a drop below the Fibonacci level could unfold given the wide range weekly bullish engulfing candle that completed two weeks ago.
The break below the long-term uptrend line on August 11 remains a key bearish development. A subsequent rally into that line was rejected, confirming its role as resistance. While this suggests the larger downtrend may be reasserting itself, price action still needs to be assessed step by step as patterns develop. The current pullback could remain controlled if buyers defend support levels.
On the weekly chart, natural gas is set to close with a higher high and higher low, but still down for the week and below a long-term AVWAP around $2.96. This reflects short-term strength within a broader bearish bias. Heading into next week, a drop below this week’s low of $2.90 would confirm a one-week bearish reversal and keep pressure on towards lower support zones.
For a look at all of today’s economic events, check out our economic calendar.
An upside target zone was reached this week, where resistance developed. Two measured moves completed at that level, highlighted as rising ABCD patterns on the chart. The bearish response that followed indicates the market recognized the zone. Despite the reaction, underlying buying pressure remains evident as gold continues to hold near record highs. Still, the shooting star trigger and consecutive lower highs and lows highlight the potential for a deeper pullback before buyers reassert control.
A decline below Thursday’s low of $3,613 would signal a continuation of the pullback. If sellers remain in control, the 38.2% Fibonacci retracement at $3,537 serves as the first lower target. The prior trend high at $3,500 may also be retested as support if weakness extends further, reinforced by a 50% retracement level at $3,495. Together, these levels illustrate a critical support zone that traders will be monitoring closely.
Gold has yet to see a meaningful retracement since breaking out of its symmetrical triangle and surging to fresh records. Typically, the first pullback after such a breakout attracts strong demand as participants look for entry opportunities. A decline toward the 20-Day moving average remains possible, now at $3,465 and rising. The most recent acceleration in bullish momentum began with a successful reclaim of the 20-Day average on August 22, and even if not imminent, a test of support around the line is likely at some point in the trend’s development.
Despite near-term bearish signals, gold is on track to finish the week above last week’s high of $3,600. Such a close would confirm the weekly breakout triggered earlier this week and underscore ongoing underlying demand. A decisive advance above the $3,675 record high would reinstate bullish momentum and open the door to higher targets, beginning with the $3,734 price zone.
For a look at all of today’s economic events, check out our economic calendar.
The global platinum market is experiencing its third consecutive year of supply deficits, though the shortfall for 2025 has been revised downwards by the World Platinum Investment Council (WPIC).
The deficit is now projected at 850,000 ounces, a significant figure but less than the 968,000-ounce deficit seen last year.
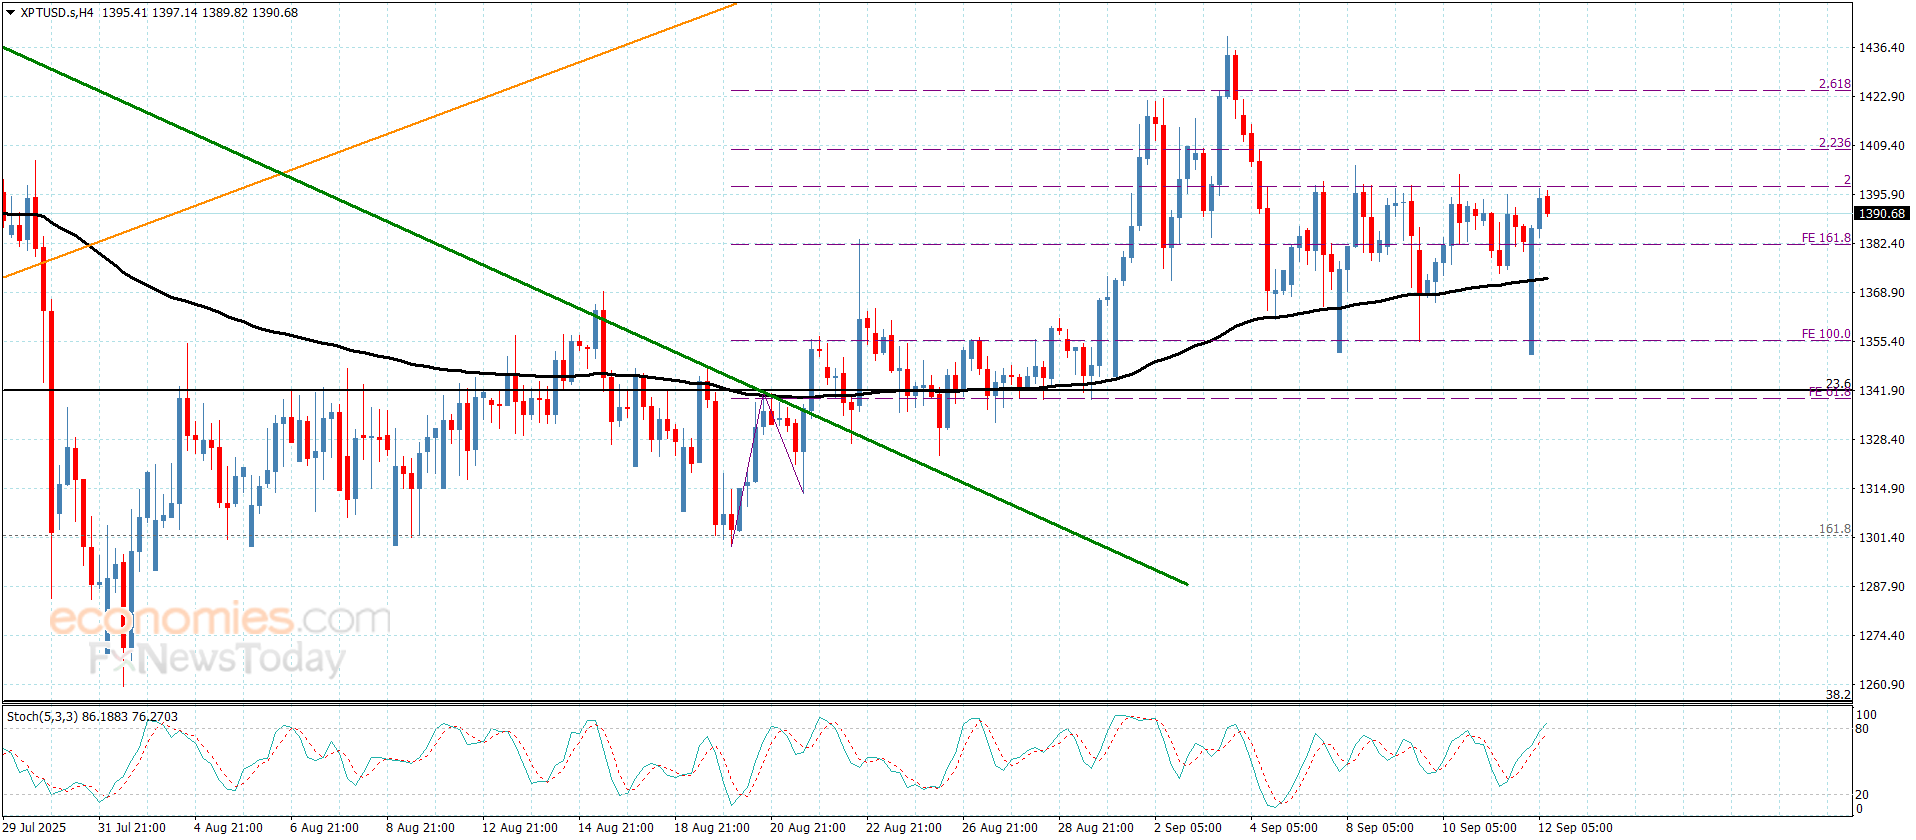
At the time of writing, the most-active platinum contract on COMEX was at $1,398.35 per ounce, down 0.1% from the previous close.
Prices of both platinum and palladium have risen significantly over the last few weeks, tracking gold’s rally.
Gold prices have enjoyed a blockbuster run in 2025 so far, with prices jumping more than 40%. The yellow metal has hit a series of record highs and recently breached the $3,700 per ounce.
The primary reasons for this downward revision are a slightly higher-than-anticipated recycling supply and weaker industrial demand.
“Industrial demand is expected to hit an eight-year low, largely due to a significant drop from the glass industry,” noted Carsten Fritsch, commodity analyst at Commerzbank AG.
This decline could not be fully offset by a surge in jewelry demand, particularly from China in the second quarter, which is pushing jewelry demand to a seven-year high.
Minor adjustments in automotive demand and investment demand largely balanced each other out.
The uptick in investment demand is attributed to robust interest in platinum bars and coins. Interestingly, this year’s expected ETF demand has been confirmed, a surprising development given the strong outflows from ETFs since May.
The forecast for mine supply remains unchanged, with expectations of a nearly 6% year-on-year decrease, reaching a five-year low.
This indicates that the recent significant increase in platinum prices has not yet stimulated new production.
“The WPIC highlights the multi-year time lag between the development of mining projects and the commencement of production,” Fritsch added.
However, it’s worth considering that recently decommissioned shafts from existing mines could potentially be brought back online.
Above-ground platinum stocks are now predicted to fall to just under 3 million ounces this year.
This is a substantial revision from the previous forecast, which was about 800,000 ounces lower.
This new projection implies that another year with a supply deficit of similar magnitude would be needed for stocks to reach the level previously expected.
Fritsch noted:
Despite three consecutive years of supply deficits, the platinum market isn’t quite as tight as initially believed.
Commerzbank AG has adjusted its platinum price forecast for the end of 2025 upwards to $1,400 per troy ounce, an increase from the previous $1,350 per ounce.
This revision reflects the current higher price level and an updated gold price forecast.
The year-end forecast for 2026 remains confirmed at $1,500.
Price forecasts for palladium are holding steady at $1,200 for the end of 2025 and $1,300 for the end of 2026.
The post Platinum market remains undersupplied; Commerzbank scales up price forecast appeared first on Invezz
The EURJPY pair succeeded in facing stochastic negativity by its stability above 172.00 level yesterday, to form some of the bullish waves to approach from the barrier at 173.50, forming an obstacle against the attempts of resuming the bullish attack.
To confirm the attempts of resuming the bullish attack, we recommend waiting for breaching the barrier and providing positive close above it, to increase the chances for recording extra gains that might extend to 174.25 reaching 1.809%Fibonacci extension level at 175.20, while the price failure to breach this level will force it to provide more of the sideways trading, and there is a new chance to decline towards 171.60.
The expected trading range for today is between 172.60 and 174.25
Trend forecast: Bullish
The (ETHUSD) price rose in its last intraday trading, attacking the critical resistance at $4,500, which represents our suggested target in our previous analysis, supported by its continuous trading above EMA50, with its trading alongside minor bullish trend on the short-term basis that supports the bullish movement, despite the negative signals that come from the (RSI), after reaching overbought levels, to offload some of this conditions despite the price rise, indicating the strength of the trend and its dominance.
Get high-accuracy trading signals delivered directly to your Telegram. Subscribe to specialized packages tailored for the world’s top markets:
Full VIP signals performance report for September 1–5, 2025:
U.S. natural gas futures hovered near $2.98 after the Energy Information Administration reported a +71 Bcf storage injection for the week ending September 5, slightly above consensus estimates of +68–70 Bcf. Total storage rose to 3,343 Bcf, which is 188 Bcf above the five-year average and only 38 Bcf below last year’s levels. The injection disappointed bulls hoping for a lower figure, keeping NG=F prices capped under $3 despite recent attempts to break higher. Traders are now gauging whether this oversupply trend will continue, with projections pointing toward end-season inventories above 4.0 Tcf.
Natural gas is trading just below its 50-day moving average at $3.20 and faces a short-term pivot at $3.238. A decisive breakout above these levels could open room toward $3.579, but current momentum remains fragile. The market recently rebounded from a low of $2.695 to $3.198, a move driven largely by short-covering rather than fresh institutional buying. Support is concentrated in the $2.947–$2.887 range. If prices hold above this zone, a secondary higher bottom could form, paving the way for renewed bullish momentum. A failure of $2.887, however, would risk a sharp drop back toward $2.695–$2.647.
Weather models show muted demand signals in the near term, with cooler temperatures across the North and extreme Southern heat offsetting each other. This reduces overall gas burn expectations. Compounding the weakness, LNG feed gas demand remains subdued, keeping export flows below capacity levels. The quiet Atlantic hurricane season has further dampened volatility, as Gulf Coast LNG terminals face fewer storm-related risks. Traders are cautious that without a stronger weather-driven demand surge or a rebound in LNG exports, NG=F prices could remain pinned below resistance.
Henry Hub benchmark gas slipped by $0.21 to trade below $3.00, with broad regional averages showing similar pressure. West Texas and Southeast New Mexico hubs posted deeper declines, with Waha sliding by $0.535, highlighting pipeline constraints and oversupply in producing regions. In contrast, Northeast hubs like Tennessee Zone 6 showed small gains near $0.135, reflecting localized demand. Nationally, the weighted average dropped by $0.10, reinforcing that weakness is spread across most delivery points rather than being isolated to a few hubs.
While near-term pricing remains pressured, major North American buyers continue to lock in long-dated supply agreements. Forward curves show seasonal swings between $2.50 and $5.50/MMBtu through 2035, with consistent winter spikes above $5. This reflects underlying structural demand growth from population increases and data center expansion. Companies like Williams and Enbridge are expanding their pipeline and storage portfolios to meet this demand, underscoring that while short-term oversupply persists, long-term fundamentals remain tight.
With NG=F near $2.98 and resistance layered at $3.20–$3.24, the market is at a critical inflection point. If support at $2.947–$2.887 holds, upside potential toward $3.58 remains viable, especially if weather or LNG demand improves. However, repeated failures to clear $3.20 combined with strong storage builds argue for caution. On balance, the technical structure favors a Hold stance—bullish potential exists on support confirmation, but oversupply and weak catalysts prevent a decisive Buy call at this stage. A break below $2.887 would shift the outlook firmly bearish.
Price has now reached an important potential support zone defined by the 20-Day moving average at $2.92 and the 50% Fibonacci retracement at $2.91. This marks the first test of support around the 20-Day line since it was reclaimed nine days ago, a development that often carries technical significance. If buyers step in here, the zone could provide the foundation for a bullish reversal. Yet, the conviction behind today’s decline raises the risk that the 20-Day line may not hold, with lower levels likely to be tested before firm support is established.
Should the $2.91 area fail, nearby levels of interest include the interim swing low at $2.87 and the 61.8% Fibonacci retracement at $2.84. Together, these levels form a secondary support cluster that could attract buyers if downward momentum extends. A break below that zone, however, would increase the probability of natural gas testing the $2.62 swing low from late August.
Another lens for evaluating the current move is the large bearish parallel trend channel that continues to guide price action. The channel has been respected on multiple occasions, with the May corrective low and August swing low both bouncing off support near the lower quarter line. The center line has also acted as both support and resistance in recent months, underlining its importance as a dynamic pivot.
An upside breakout through the center line occurred on August 28, coinciding with the recovery of the 20-Day average — a technically significant alignment. Yet, the recent swing high at $3.20 was rejected at the upper quarter line of the channel, reinforcing resistance and keeping the channel intact. If price revisits the channel’s center line near the 61.8% retracement, traders will be watching closely for signs of stabilization and support from buyers.
For a look at all of today’s economic events, check out our economic calendar.