The main tag of Gold Price Articles.
You can use the search box below to find what you need.
[wd_asp id=1]
The main tag of Gold Price Articles.
You can use the search box below to find what you need.
[wd_asp id=1]
Gold (XAU/USD) futures opened Thursday at $3,680.60 per ounce, climbing 1% from the prior session’s close of $3,643.60. The metal has delivered nearly 40% YTD gains, a historic run powered by shifting U.S. monetary policy expectations, global inflation, and central bank accumulation. One week earlier, on September 4, futures traded at $3,549.90, meaning bullion has advanced 3.7% in seven days. Compared to a month ago, when contracts opened at $3,383.90 on August 11, the increase is +8.8%. Year-on-year, gold has surged 45.7% from $2,525.80 in September 2024, reflecting its strongest twelve-month performance since the post-crisis rally of 2010–2011.
The U.S. inflation profile remains at the center of gold’s momentum. The Consumer Price Index (CPI) advanced 0.4% MoM in August, accelerating from July’s 0.2%, pushing the annual rate to 2.9%. Core CPI held at 3.1% YoY, consistent with forecasts. At the same time, jobless claims surged to 263,000, far above the 235,000 consensus, marking the highest level in nearly four years. These signals increase the likelihood of Fed easing at the September 17 FOMC meeting, with futures markets fully pricing a 25bp cut from the 4.25%–4.50% band and leaving a smaller probability for a 50bp move. For gold, lower rates reduce opportunity costs, reinforcing its appeal versus yield-bearing assets.
Despite global strength, physical demand in Asia is softening. In Shanghai, bullion traded $17 below London prices, maintaining a discount streak for two consecutive weeks — the longest since late 2024. Discounts reflect weak local buying, particularly in jewelry, as consumers shift toward investment bars and coins. In India, the world’s No. 2 gold consumer, prices have risen more than 50% YoY, squeezing demand ahead of the critical festival and wedding season culminating in Diwali next month. Industry officials expect a 15–20% drop in volume purchases, with lighter jewelry designs replacing heavier traditional styles. Raksha Bandhan and Onam sales were already reported down 25% YoY, the steepest decline in three years.
While consumer demand has softened in Asia, central banks remain net buyers, offsetting retail declines. Ongoing geopolitical risk — including Trump’s 100% tariff threats against China and India if they maintain Russian ties — adds a policy-driven motive for reserve diversification. Central banks’ gold accumulation has historically provided a floor during periods of declining jewelry demand, and current trends mirror past cycles in 2020–2021 when official purchases supported prices even as consumer markets slowed.
The technical landscape remains constructive. Gold recently broke out from an ascending triangle pattern, confirming buyers’ control. The measured target from the breakout projects toward $3,800 per ounce, aligning with bullish Wall Street forecasts, including Goldman Sachs’ projection for $3,700 by year-end. Immediate support sits at $3,622, where futures briefly traded after Tuesday’s record-setting session. Below that, $3,550 represents secondary support. Resistance is now concentrated at $3,700–$3,720, followed by the breakout zone near $3,800. Failure to hold above $3,620 would risk testing the $3,500 handle, but momentum remains tilted upward as long as the Fed’s easing path stays intact.
Silver is adding fuel to the precious metals rally, recently trading back to $41.30 per ounce, only 25 cents shy of a 14-year high. The gold-to-silver ratio has compressed to levels not seen since 2021, suggesting relative strength in the white metal. Historically, silver’s outperformance has marked late-stage accelerations in precious metals rallies, further underlining speculative positioning.
Analysts note that the divergence between U.S. M2 money supply growth and gold’s price has reached levels last seen in 2016, 2019, and 2021 — all periods that preceded sustained rallies. If monetary expansion leads gold by three months, as historical correlations suggest, liquidity injections in Q4 2025 could extend the run toward $3,900–$4,000 territory. This structural undervaluation thesis is one reason many institutional desks maintain overweight positions in XAU/USD despite overbought conditions.
Trade policy remains a persistent wildcard. Trump’s proposed 100% tariffs on China and India if they maintain ties with Russia could exacerbate supply chain disruptions and drive safe-haven flows into gold. The assassination of activist Charlie Kirk added political instability in U.S. equities, but gold’s defensive positioning attracted buyers during that volatility. Geopolitical stress, coupled with the halving of global bond yields since early 2024, has made bullion increasingly attractive as a hedge against systemic risk.
Historically, the final quarter of the year has been gold’s strongest, with October and November showing outsized gains in multiple cycles. Combined with the Bitcoin halving effect drawing liquidity into alternative assets, and with the SEC reviewing 92 ETF applications across crypto and metals, broader institutional engagement could spill over into gold. Public listings of firms tied to gold-backed products are also expected, echoing the pipeline of crypto IPOs in parallel, reinforcing gold’s strategic allocation in institutional portfolios.
Gold price held within familiar levels on Thursday, hovering around $3,630 in the mid-American session. The XAU/USD pair suffered a minor intraday setback ahead of first-tier events, which were unable to spur action around the bright metal.
On the one hand, the European Central Bank (ECB) announced its decision to keep benchmark interest rates unchanged following the September meeting. The decision was largely anticipated by market players and had no major impact on financial markets, although the Euro (EUR) shed some ground amid fresh projections on slower growth in the Eurozone.
On the other hand, the United States (US) released the August Consumer Price Index (CPI), which showed inflation remained sticky in the month. The figures were pretty much in line with the market’s expectations, with the annual CPI hitting 2.9% and the core annual reading printing at 3.1%. On a negative note, the monthly increase was 0.4%, surpassing the 0.3% anticipated and the previous 0.2%. Also, the country released Initial Jobless Claims for the week ended September 6, which jumped to 263K from the previous 236K and was much higher than the expected 235K.
The US Dollar came under strong selling pressure after the dismal news, while Wall Street soared, as speculative interest rushed to price in Federal Reserve’s (Fed) interest rate cuts in the three meetings the central bank will have before year end.
Market’s attention now shifts to the Fed’s announcement scheduled for September 17.
Technically, the XAU/USD pair has made no progress. It trades little changed for a third consecutive day, consolidating near record highs. The daily chart shows that the pair remains far above all its moving averages, with a bullish 20 Simple Moving Average (SMA) accelerating north above the longer ones. In the meantime, technical indicators barely eased from their recent peaks, still holding within overbought readings.
The near-term picture is neutral. In the 4-hour chart, the XAU/USD pair battles to recover above a bullish 20 SMA, while the 100 and 200 SMAs maintain their firm upward slopes far below the current level. Technical indicators in the meantime, pared their slides and turned north, although the Momentum indicator remains below its 100 line and shows no actual strength. Overall, Gold is likely to extend its consolidative phase, with minor bearish corrections on the docket.
Support levels: 3,625.85 3,608.40 3,597.10
Resistance levels: 3,650.00 3,675.00 3,690.00
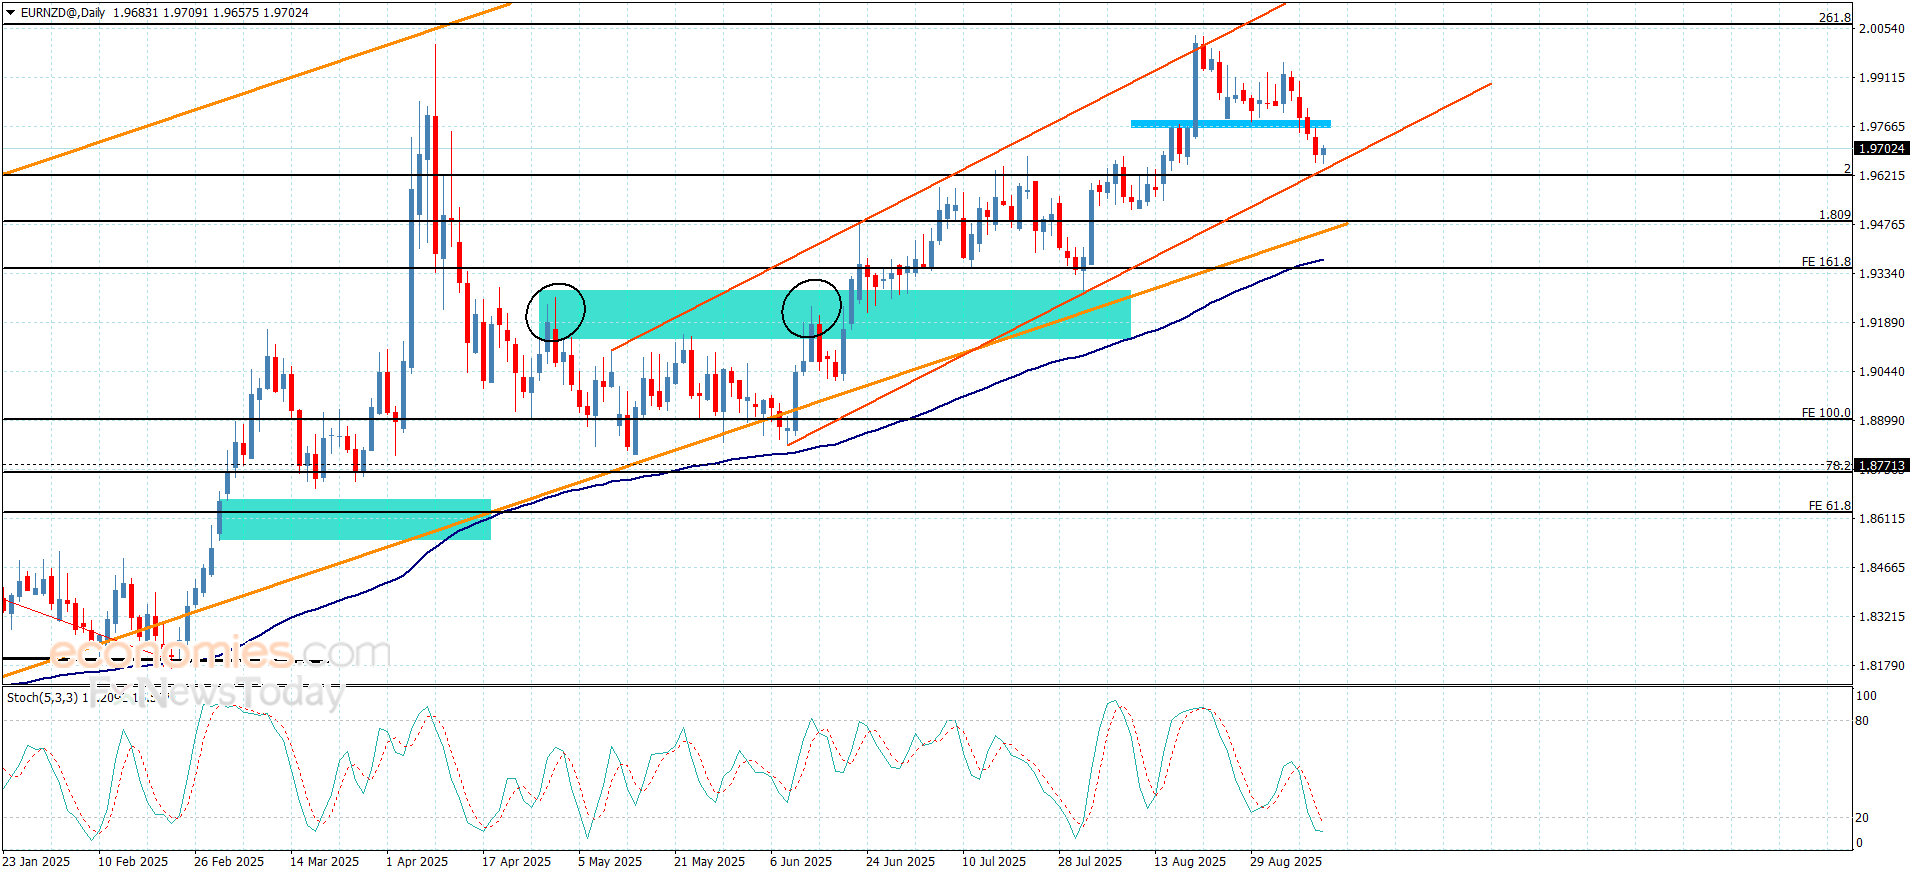
The EURNZD suffered strong negative pressures in its last trading, which forces it to break the extra support at 1.9775, suffering extra losses by its approach from the bullish channel’s support at 1.9645.
The current scenario depends on the strength of the bullish channel’s support, to expect forming bullish waves to breach 1.9775 level, then achieving extra gains by its rally to 1.9850, while breaking the main support will confirm moving to the negative track, which forces it to suffer big losses by reaching 1.9585 and 1.9525.
The expected trading range for today is between 1.9650 and 1.9800
Trend forecast: Bullish
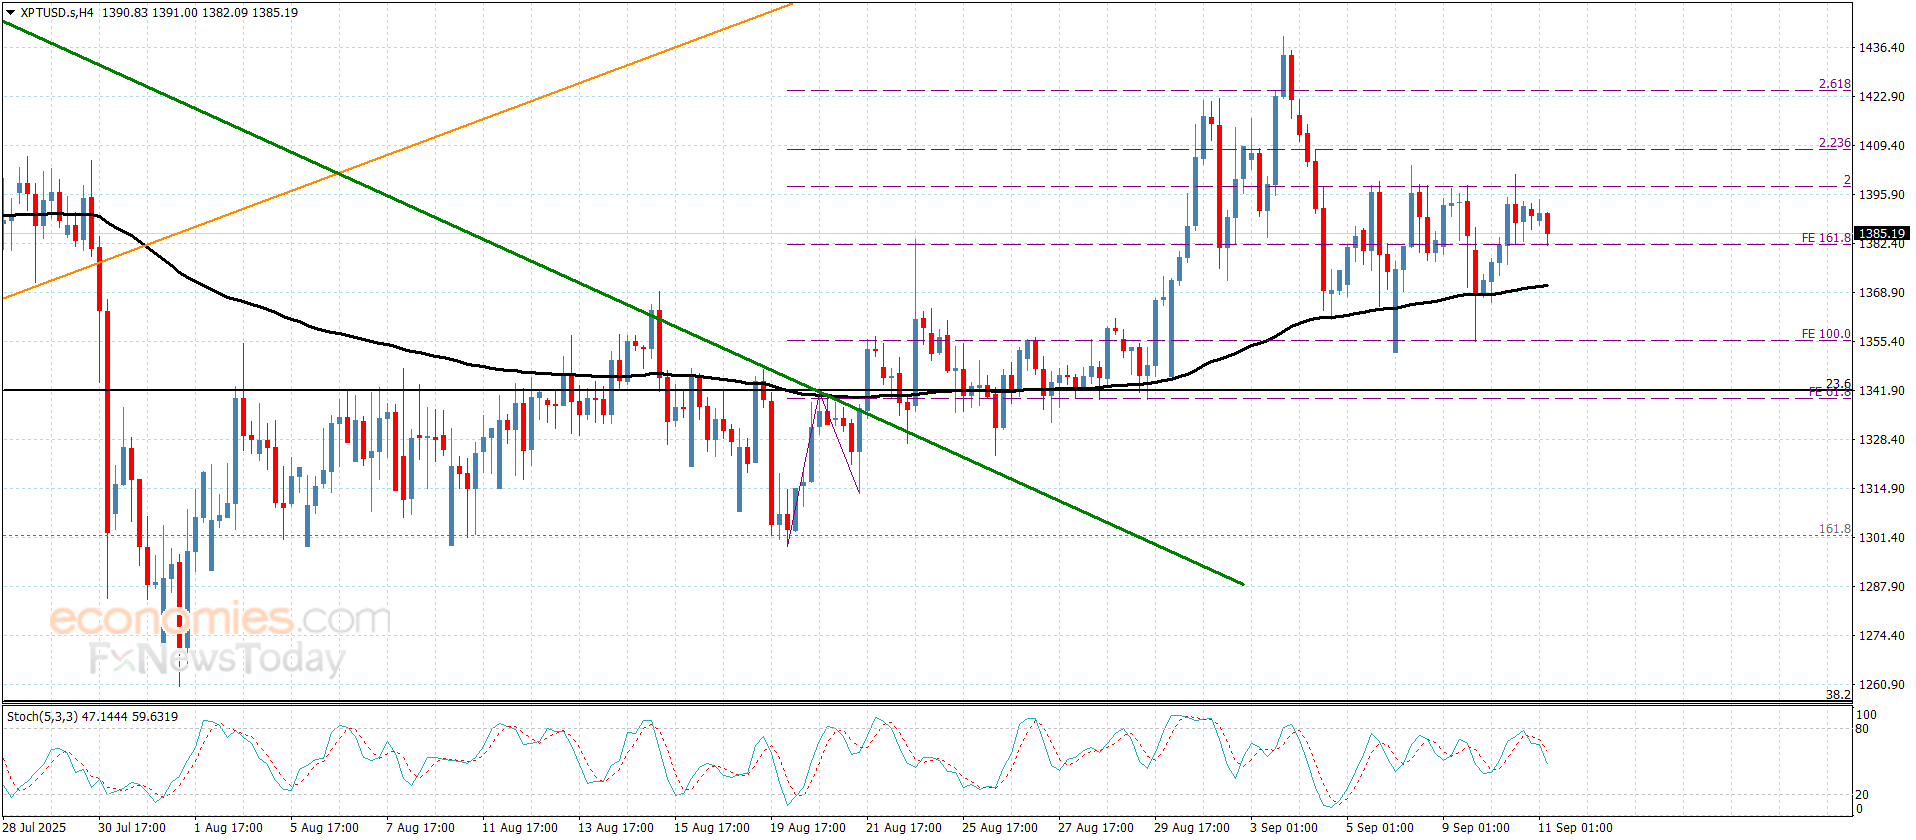
Platinum price attacked the barrier at $1400.00 yesterday, to find an exit to resume the bullish attempts, but this attempt ended by a clear failure to force it to decline temporarily towards $1381.00.
The contradiction between the main indicators might force the price to provide mixed trading until gathering extra positive momentum, to ease the mission of breaching the current barrier and begin recording extra gains by its rally to $1412.00 and $1435.00, while the attempts of changing the main trend requires achieving a real break to the support at $1340.00.
The expected trading range for today is between $1370.00 and $1412.00
Trend forecast: Fluctuated within the bullish track
Platinum price attacked the barrier at $1400.00 yesterday, to find an exit to resume the bullish attempts, but this attempt ended by a clear failure to force it to decline temporarily towards $1381.00.
The contradiction between the main indicators might force the price to provide mixed trading until gathering extra positive momentum, to ease the mission of breaching the current barrier and begin recording extra gains by its rally to $1412.00 and $1435.00, while the attempts of changing the main trend requires achieving a real break to the support at $1340.00.
The expected trading range for today is between $1370.00 and $1412.00
Trend forecast: Fluctuated within the bullish track
Gold price drifts higher to around $3,645 in Thursday’s early Asian session.
Rising Fed rate cut bets and geopolitical risks boost the Gold price.
The US CPI inflation report for August will be the highlight later on Thursday.
The Gold price (XAU/USD) gains momentum to near $3,645 during the early Asian session on Thursday. The precious metal edges higher on expectations of a US Federal Reserve (Fed) interest rate cut, a weaker US Dollar (USD) and global geopolitical risks. All eyes will be on the US Consumer Price Index (CPI) for August, which will be released later on Thursday.
US Producer Prices rose less than expected in August, reinforcing the view that the US central bank will deliver rate cuts at its upcoming policy meeting. This, in turn, weighs on the Greenback and underpins the USD-denominated commodity price. Lower interest rates could reduce the opportunity cost of holding Gold, supporting the non-yielding yellow metal.
Traders expect a stronger Fed easing. Money markets are now fully pricing in a 25 basis points (bps) rate cut at the Fed’s September meeting, while the chance of a larger 50 bps reduction has also risen to nearly 12%, according to the CME FedWatch tool.
Meanwhile, escalating geopolitical tensions in Europe and the Middle East also boost the safe-haven flows, benefitting the Gold price. Geopolitical risks in Europe rose after Poland shot down Russian drones that crossed into its territory in Russia’s latest attacks on Ukraine. Additionally, Israel on Tuesday launched a strike on Doha, Qatar, targeting the senior leadership of Hamas. Qatar said the attack by Israel violated international law and threatens to widen the conflict in the Middle East.
Gold traders will take more cues from the US August CPI inflation report later on Thursday. The headline CPI is expected to show an increase of 2.9% YoY in August, while the core CPI is projected to show a rise of 3.1% YoY during the same period. If the report shows a hotter-than-expected inflation, this could lift the USD and cap the upside for the precious metal price.
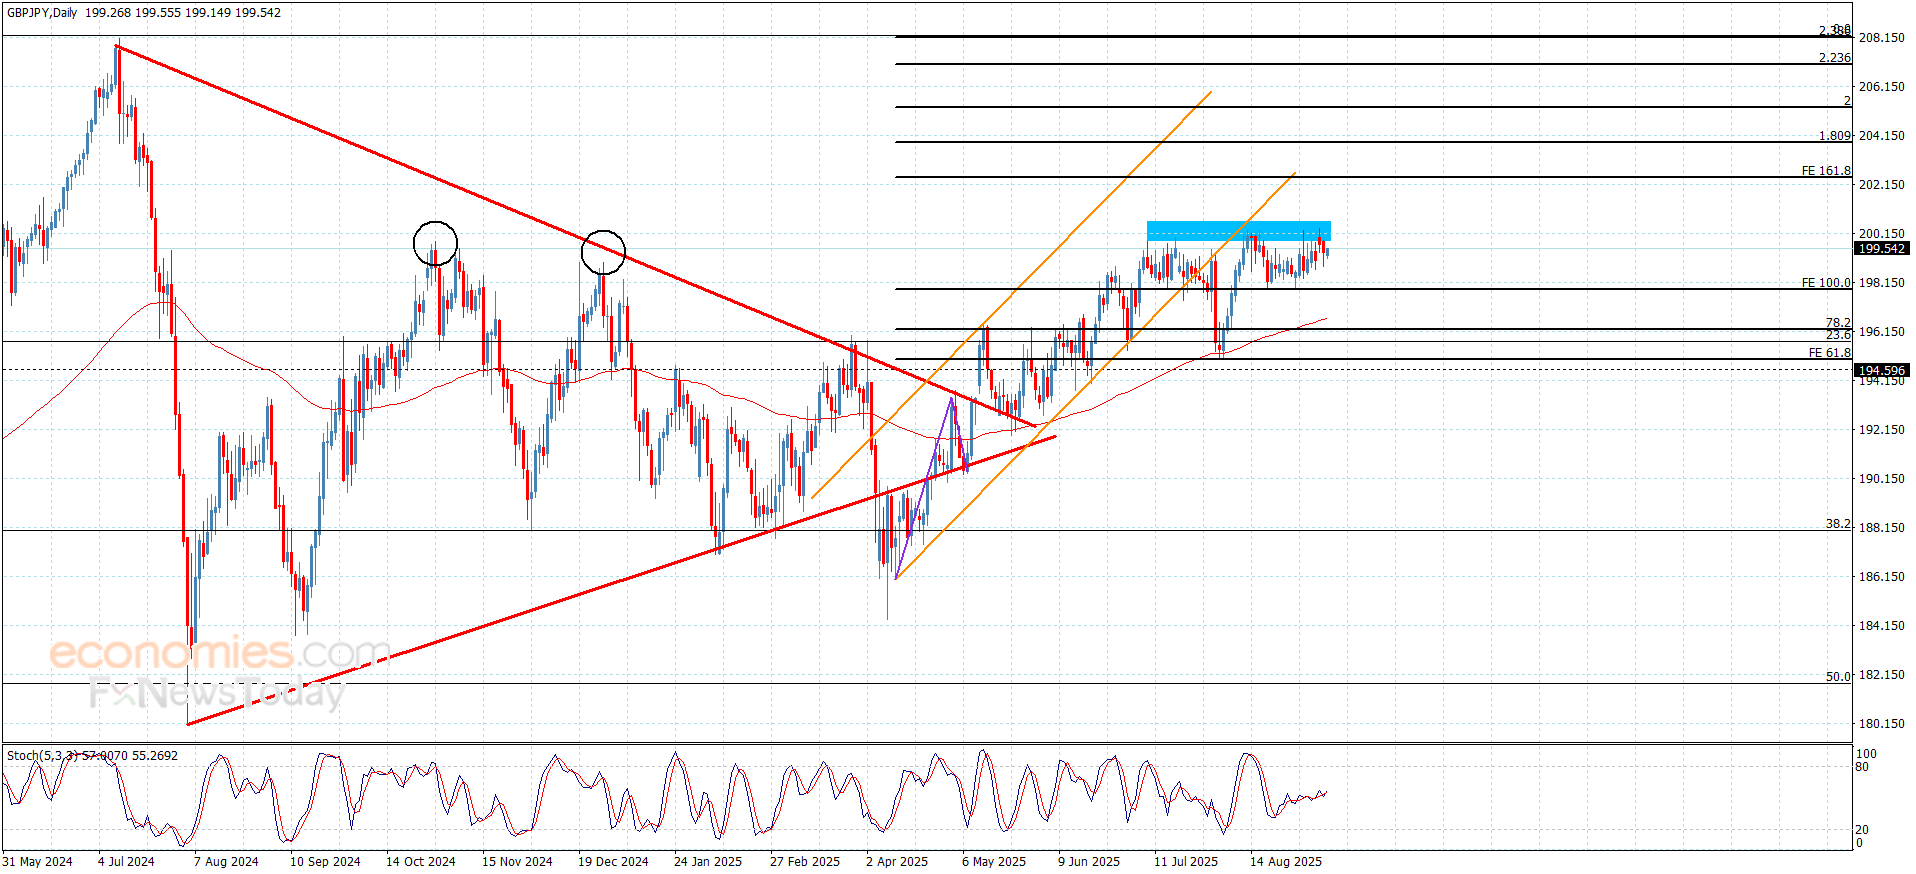
Despite the attempts of the main indicators to provide positive momentum but the stability of the GBPJPY pair below the barrier at 200.40 obstacle the chances for resuming the bullish attack, which forces it to provide sideways trading, activating the expected bearish correctional track.
While gathering the negative momentum will make the price begin targeting the negative stations by its decline to 198.60, then attempts to press on the initial support at 197.85, while the price success in breaching the barrier and holding above it will turn the bullish scenario to begin achieving clear gains by its rally to 200.90 and 201.55.
The expected trading range for today is between 198.65 and 200.30
Trend forecast: Bearish
Since the breakout to new record highs on September 2, gold has shown almost uninterrupted strength, with only one prior one-day pullback before momentum quickly resumed. A similar recovery is possible again, but price behavior now suggests the market may be ready for a deeper pullback or consolidation. The advance from the $3,311 swing low to Tuesday’s high represented an 11% gain, or $363, over just 14 trading sessions — a steep rise that increases the odds of further profit-taking before bullish continuation.
The first potential support area sits near this week’s low of $3,576, but if that level fails to hold, the 38.2% Fibonacci retracement at $3,537 is the next key zone. Below that, the prior record high of $3,500 comes into play, coinciding with the 50% retracement at $3,495. A stronger support zone rests lower, spanning the $3,451 and $3,439 swing highs that defined the prior symmetrical triangle pattern. This lower range aligns with the 61.8% retracement at $3,452 and is reinforced by dynamic support from the 20-Day moving average, now near $3,450 and rising.
While a pullback appears likely, the broader outlook for gold remains firmly bullish. The first test of the 20-Day average should attract buying interest and help maintain the uptrend. Only a decisive drop and sustained trade below the 20-Day line would weaken the bullish structure as it looks now.
With two trading sessions remaining this week, the closing price for the week may matter. A weekly close back under last week’s $3,600 high would show a failure to confirm the breakout, while a strong close above that level would reinforce the longer-term bull trend.
For a look at all of today’s economic events, check out our economic calendar.
The (ETHUSD) price continued its sideways trading in its last intraday levels, attempting to gain bullish momentum that might help it to rise, amid the continuation of the critical support level stability at $4,250, with the emergence of positive overlapping signals on the(RSI), after reaching oversold level, on the other hand, the price is under negative pressure that comes from its trading below EMA50, which prevents the price recovery in the previous session.
Get high-accuracy trading signals delivered directly to your Telegram. Subscribe to specialized packages tailored for the world’s top markets:
Full VIP signals performance report for September 1–5, 2025:
Spot Gold saw little action throughout Wednesday, with the XAU/USD pair stuck below the $3,650. The bright metal started the day with a soft tone amid broad US Dollar (USD) demand, but found an intraday bottom at $3,620.48. The USD lost ground early in the American session, although price action across the FX board remains limited ahead of the release of first-tier data, which can affect the Federal Reserve (Fed) monetary policy decision, scheduled for release next week.
The United States (US) published the August Producer Price Index (PPI), which showed that annualized inflation at producers’ levels rose by 2.6%, down from the 3.3% posted in July. The core annual figure printed at 2.8%, easing from a revised 3.4% previously, while on a monthly basis, the PPI declined by 0.1%. The Consumer Price Index (CPI) for the same month is scheduled for release on Thursday.
The figures were below expected, and quickly triggered comments from US President Donald Trump: “Just out: No Inflation!!! “Too Late” must lower the RATE, BIG, right now. Powell is a total disaster, who doesn’t have a clue!!! President DJT,” Trump shared on Truth Social.
Other than that, President Trump suffered a setback, as a US court allowed Fed’s official, Lisa Cook, to continue operating as a member of the Board. Trump “fired” Cook over fraud allegations, but Cook appealed the decision and so far, retains her seat.
Also, the Labor Department’s Office of Inspector General said it is reviewing the “challenges” that the Bureau of Labor Statistics (BLS) is facing in its data-collection efforts. Trump fired the BLS’s former head following the weak July monthly job report after claiming the numbers were wrong. Trump is quite unhappy with the large downward revisions to new jobs estimates.
From a technical point of view, XAU/USD has to extend its advance. In the daily chart, the pair develops well above its moving averages, with a bullish 20 Simple Moving Average (SMA) accelerating north above the longer ones. At the same time, technical indicators ticked higher after a modest downward correction, still within extreme overbought levels.
In the near term, and according to the 4-hour chart, XAU/USD entered a consolidative phase, yet the risk remains skewed to the upside. The bright metal trades well above all its moving averages, with a bullish 20 SMA providing near-term support at around $3,625. The 100 and 200 SMAs also advance, yet far below the shorter one. Technical indicators have turned south within positive levels, reflecting the lack of upward momentum rather than hinting at an upcoming slide.
Support levels: 3,638.10 3,625.85 3,608.40
Resistance levels: 3,650.00 3,675.00 3,690.00