The main tag of Gold Price Articles.
You can use the search box below to find what you need.
[wd_asp id=1]
The main tag of Gold Price Articles.
You can use the search box below to find what you need.
[wd_asp id=1]
The chart highlights measured moves that preceded the triangle breakout, producing targets that match percentage gains of 11.4% and 18.4%, or price increases of $356 and $543. Using the $3,423 high as the breakout level, projected measured move targets sit at $3,779 and $3,966 based on price. These align with the continuation potential implied by the triangle formation.
Gold is now advancing toward the first target zone at $3,563 to $3,603, derived from a long-term 223.6% Fibonacci extension and a rising ABCD projection. Given the strength of the current trend, this zone may not provide significant resistance, though interim pauses cannot be ruled out. Key support rests at the prior breakout point of $3,500, followed by former swing highs at $3,451 and $3,439. Holding above these levels maintains the breakout structure and preserves bullish momentum.
Beyond the $3,603 zone, traders should watch for potential resistance around $3,664 to $3,668, where two indicators converge. While the higher measured move target near $3,966 could be reached longer term, shorter-term resistance zones may provide reaction points and consolidation phases along the way.
Gold confirmed a long-term bullish breakout last week, closing at its highest monthly level ever after overcoming resistance from the past two months. The last comparable rally out of consolidation produced four consecutive weeks of gains. With this being the first week of a new breakout phase, historical precedent suggests further upside is favored before the current move exhausts.
For a look at all of today’s economic events, check out our economic calendar.
The gold market is surging with an intensity not seen in years, smashing through the $3,500 level and printing a new all-time record. Spot gold (XAU/USD) peaked at $3,516.31 per ounce during Asian hours, surpassing April’s previous high of $3,500.05, before stabilizing near $3,491.47 in New York, still higher on the day. U.S. gold futures for December delivery advanced to $3,554.30, while intraday trades briefly touched $3,580. With prices up more than 33% year-to-date, bullion has doubled since early 2023, cementing itself as the market’s strongest performing safe-haven asset.
The rally is underpinned by the conviction that the Federal Reserve is preparing its first rate cut in nine months. Markets are pricing a 90% probability of a 25 bps cut on September 17, with some speculation of a 50 bps move if nonfarm payrolls later this week miss estimates. Trump’s repeated attacks on Fed Chair Jerome Powell and his attempt to oust Governor Lisa Cook have escalated fears of compromised independence. A federal appeals court ruling that Trump’s global tariffs were illegally imposed has further rattled confidence in the U.S. economic outlook. Analysts warn that the political overhang, combined with inflationary risks if the Fed bows to pressure, has created a near-perfect environment for higher gold.
Beyond macro policy, structural demand from sovereign buyers is reinforcing the surge. Central banks in India, China, Turkey, and Poland have been expanding reserves, with 2024 marking the year gold overtook the euro as the second-largest global reserve asset after the dollar. This “de-dollarization” trend continues into 2025, with foreign central banks’ U.S. Treasury allocations shrinking while gold holdings rise. SPDR Gold Trust (GLD), the world’s largest gold-backed ETF, reported a 1.01% increase in holdings last week to 977.68 tons, its highest since 2022. Indian pension funds are also seeking approval to add gold ETFs to portfolios, a sign that institutional allocations remain strong even at record levels.
Gold’s explosive rise reflects a confluence of geopolitical and macroeconomic risks. Trump’s escalating tariffs and rhetoric against trading partners have reignited global trade tensions, while the dollar index languishes near one-month lows. With the greenback under pressure, overseas buyers find gold cheaper, reinforcing momentum. European bond markets mirror this trend, with U.K. 30-year gilt yields hitting a 27-year high, French 30-year yields at a 16-year high, and German 30-year bonds at their costliest since 2011. Investors are fleeing sovereign debt, turning instead to gold and silver as defensive hedges. Geopolitical backdrops—from Russia’s war in Ukraine to ongoing Middle East volatility—layer additional urgency for diversification into bullion.
The timing of this breakout coincides with gold’s seasonally strongest demand window. Analysts at Standard Chartered project average prices of $3,500/oz in Q3 and $3,700/oz in Q4, underscoring that momentum may extend into year-end. China and India, historically price-sensitive, are seeing jewelry buyers pivot into investment-grade coins and bars instead of exiting at high prices. This shift keeps Asian consumption steady even at elevated levels. Combined with robust ETF inflows, the demand profile suggests current prices are not discouraging participation but rather reinforcing gold’s role as the asset of choice during uncertainty.
The surge in gold is mirrored by strength in silver, platinum, and palladium. Silver (XAG/USD) touched $40.64/oz, its highest since 2011, before settling near $40.48. Platinum trades at $1,389.75 and palladium at $1,121.75, both lower on the day but still supported by safe-haven flows. With the gold-silver ratio still above its historical range of 60–80, analysts argue silver has greater upside potential in relative terms. The synchronized rise in precious metals reinforces broad investor hedging strategies against monetary and geopolitical shocks.
Strategists from UBS, BNP Paribas, and Goldman Sachs see this as more than a seasonal move. Projections range from $3,700 by mid-2026 to $4,000 per ounce if Fed rate cuts multiply or political crises deepen. BNP’s David Wilson stressed that Trump’s overt challenge to Fed independence combined with U.S. fiscal deficits provides the “perfect setup” for further gold appreciation. Goldman Sachs highlighted ETF inflows as the hidden accelerant that could sustain the rally, projecting $4,000 in the next 12 months. The resilience of gold above $3,500 suggests markets are already positioning for this upper range.
Friday’s nonfarm payrolls is now the most critical data point. A weak print could reignite speculation of a 50 bps cut, fueling additional gains in XAU/USD. Even without such an aggressive move, the structural bid from central banks, ETF flows, and retail demand provides a strong base. Investors remain highly sensitive to Trump’s next move on Fed governance, with the market interpreting every headline as another justification to add bullion exposure.
With spot prices near $3,491.47 and futures around $3,554.30, gold has broken key technical resistance and entered uncharted territory. Strong central bank buying, ETF inflows, and macro uncertainty support continued upside. Risks lie in a potential Fed surprise of no cut, which could temporarily cap momentum, but structural demand and political instability provide a solid floor above $3,400.
Verdict: Buy. Gold’s trajectory toward $3,700 by Q4 2025 and possible tests of $4,000 in 2026 positions XAU/USD as the strongest hedge in global markets, with silver offering leveraged upside in parallel.
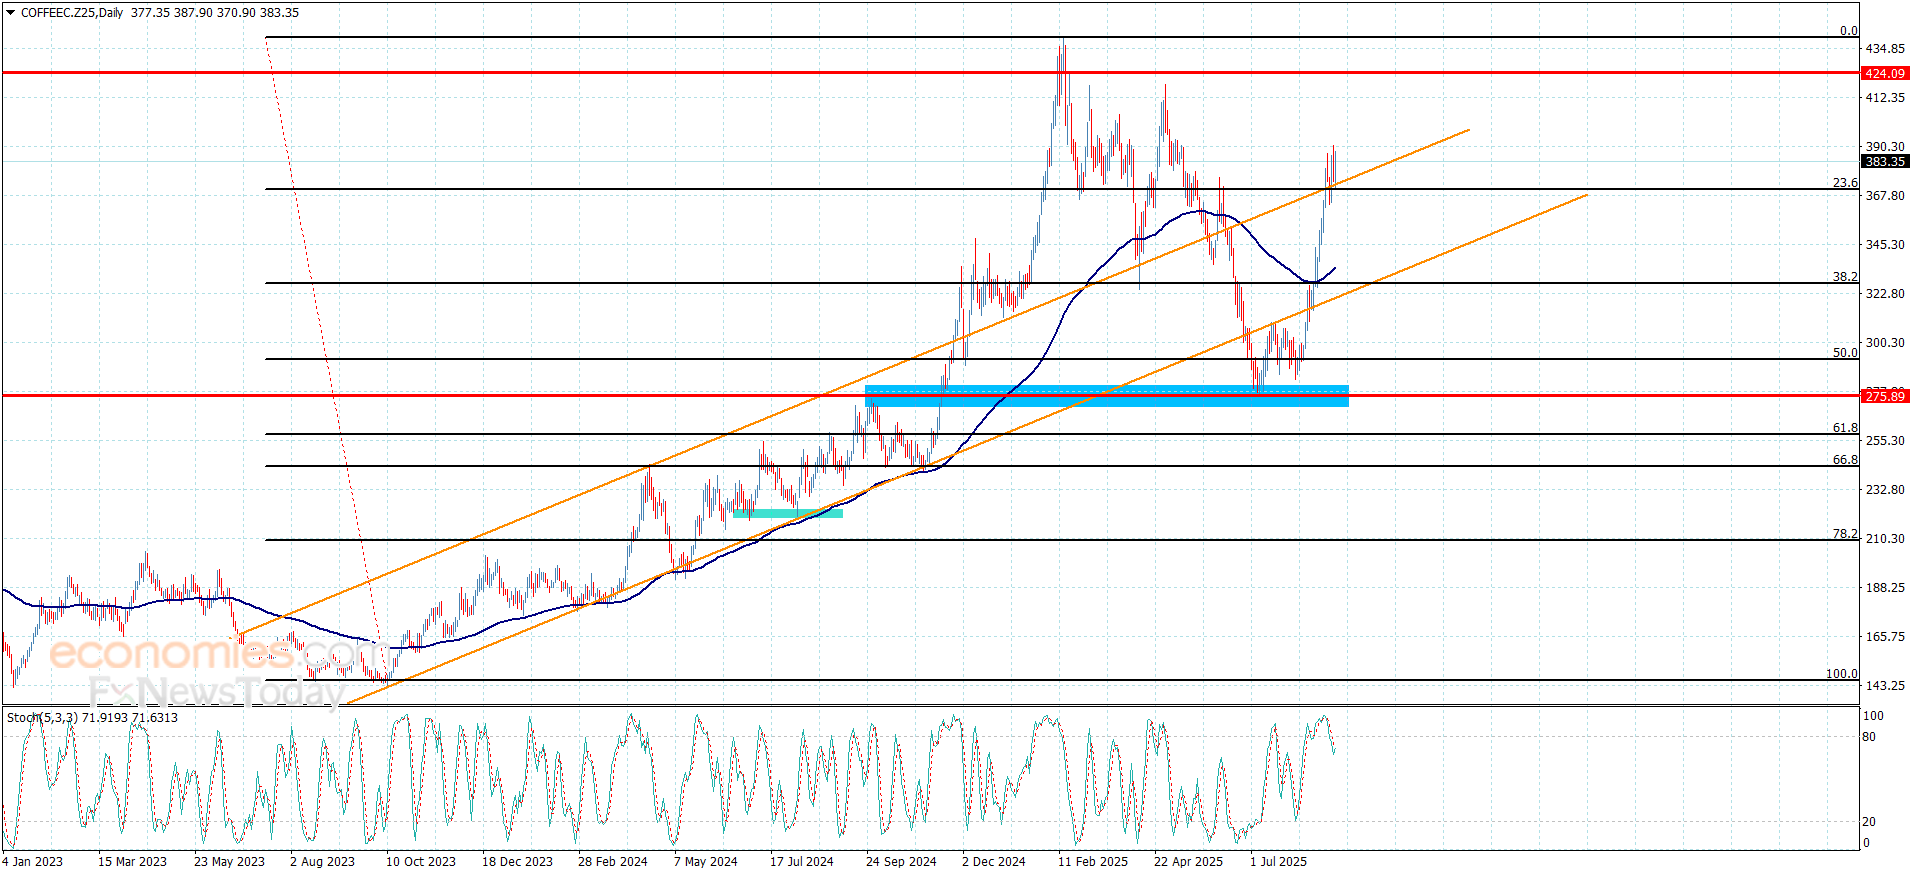
The coffee price ended its last bullish rally by surpassing the barrier at 370.60, confirming its move to a new positive station by recording 390.30 level, which forces it to form some sideways trading due to stochastic exit from the overbought level as appears in the above image.
Therefore, we will keep waiting for the positive momentum, which allows it to settle above 370.00 level, then begin targeting extra positive stations by reaching 400.55 and 411.20.
The expected trading range for today is between 375.00 and 400.00
Trend forecast: Bullish
Gold has quickly reversed an uptick to fresh all-time-highs above $3,500, gathering pace for a sustained move again above that level. All eyes now turn to the US ISM Manufacturing PMI due later in the day for further trading directives.
Gold extends its bullish momentum into a sixth straight day, but the further upside appears capped (for now), in the face of a resurgent buying interest in the US Dollar (USD).
The USD sees a short-covering bounce from over one-month troughs across the board, driven by profit taking, as traders cash in before the releases of crucial US business surveys and employment data due this week.
The US ISM Manufacturing PMI is on the radar next as speculations over a jumbo interest rate cut by the US Federal Reserve (Fed) this month grow. A 25 basis points (bps) September rate cut is fully baked in, with the CME Group’s Fed Watch Tool showing a 90% chance.
The headline ISM Manufacturing PMI is expected to advance to 49 in August from 48 in July, remaining in contraction.
On the data disappointment, the Greenback could come under renewed selling pressure, keeping the record rally in Gold alive.
Additionally, concerns over the Fed’s autonomy amidst US President Donald Trump’s continued efforts to rope in more dovish appointments to the US central bank remain a drag on the USD, while supporting the bright metal.
The geopolitical developments between Russia and Ukraine also remain in focus, underpinning the traditional safe-haven Gold. On Sunday, Ukraine’s President Volodymyr Zelenskiy said Ukraine plans new strikes deep into Russia after weeks of intensified attacks on Russian energy assets, per Reuters.
Trump noted last week that he was deeply disappointed, particularly in light of his recent attempts to mediate between Russia and Ukraine to bring an end to the war.
The daily chart shows that Gold eyes more upside as the 14-day Relative Strength Index (RSI) is still not heavily overbought. The leading indicator is currently near 71.
The Bull Cross of the 21-day Simple Moving Average (SMA) and the 50-day SMA also keeps the buoyant tone intact around the bullion.
The immediate topside hurdle is seen at the new record high of $,3509, above which the $3,550 psychological level will be challenged.
Conversely, any pullback will challenge the intraday of $3,475 initially, followed by this week’s low of $3,437.
The $3,400 round level will be attacked on a sustained break below the latter.
The Institute for Supply Management (ISM) Manufacturing Purchasing Managers Index (PMI), released on a monthly basis, is a leading indicator gauging business activity in the US manufacturing sector. The indicator is obtained from a survey of manufacturing supply executives based on information they have collected within their respective organizations. Survey responses reflect the change, if any, in the current month compared to the previous month. A reading above 50 indicates that the manufacturing economy is generally expanding, a bullish sign for the US Dollar (USD). A reading below 50 signals that factory activity is generally declining, which is seen as bearish for USD.
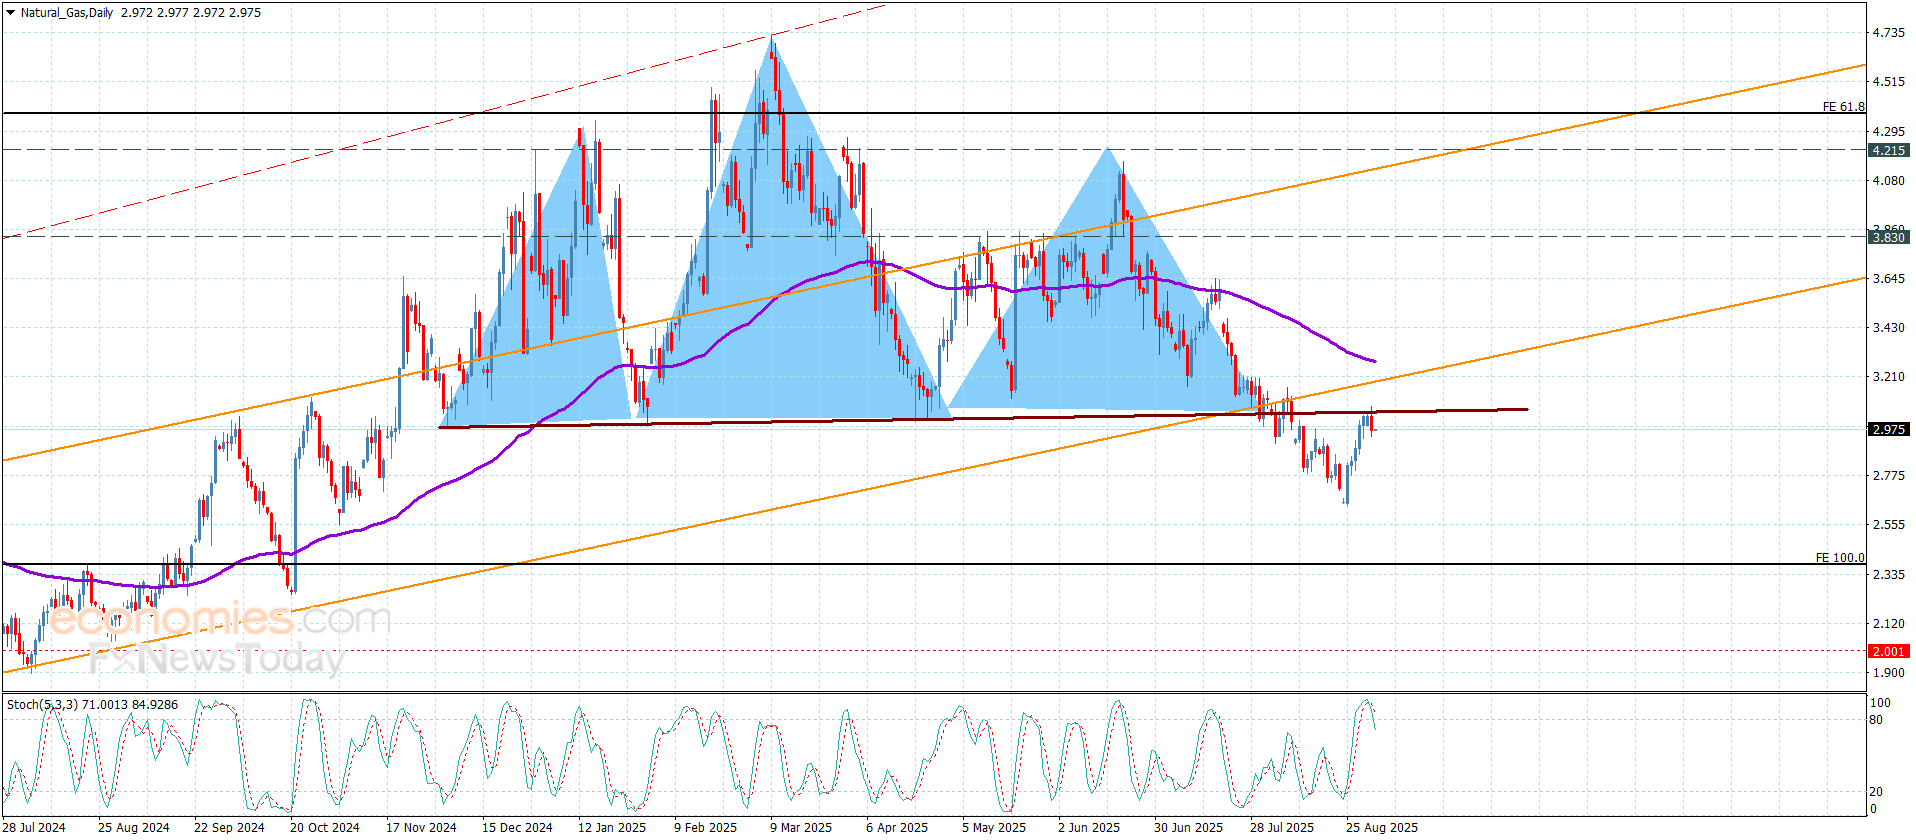
Natural gas price ended its bullish correctional rally by testing the neckline of the head and shoulders that is represented by $3.050 level, taking advantage of providing negative momentum by stochastic, reaching towards $2.950 level.
The main stability below the main resistance to $3.180 represents a main factor to confirm the bearish scenario, keeping our bearish expectation that might target $2.810 level reaching the barrier at $2.620.
The expected trading range for today is between $2.810 and $3.100
Trend forecast: Bearish
The (Brent) price rose in its last intraday trading, preparing to attack the critical resistance level at $68.50, amid the dominance of the bullish correctional trend on the short-term basis and its trading alongside a supportive bias line for this track, taking advantage of the dynamic support that is represented by its trading above EMA50, intensifying the bullish momentum, on the other hand, we notice that the (RSI) reached overbought levels, with the beginning of negative overlapping signals appearance from them, which might reduce its upcoming gains.
Get high-accuracy trading signals delivered directly to your Telegram. Subscribe to specialized packages tailored for the world’s top markets:
Full VIP signals performance report for August 25–29, 2025:
Silver price (XAG/USD) trades near $40.85 per troy ounce, the highest since September 2011, which was marked during the Asian hours on Tuesday. The precious metals like Silver attract buyers amid increased safe-haven demand, driven by US Federal Reserve (Fed) independence concerns, uncertainty surrounding Fed policy outlook, and US President Donald Trump’s tariffs.
United States (US) July’s Personal Consumption Expenditures (PCE) Price Index signaled persistent inflationary pressures and heightened uncertainty over potential Fed rate cuts. However, traders are now pricing in more than 89% of a 25 basis points (bps) rate cut by the Fed at the September policy meeting, up from an 84% chance a week ago, according to the CME FedWatch tool.
Market participants are also awaiting upcoming employment figures due this week that could shape the US Federal Reserve’s (Fed) policy decision in September. Key reports include ADP Employment Change, Average Hourly Earnings, and Nonfarm Payrolls for August.
Safe-haven demand for Silver is further supported by ongoing concerns about the US central bank’s independence. Uncertainty persists over the legality of Trump’s dismissal of Fed Governor Lisa Cook, after a court hearing on Friday concluded without a decision on whether to temporarily halt the move.
US Treasury Secretary Scott Bessent acknowledged that the Federal Reserve should be politically independent, but offered little clarity on his vague claim that the Fed has “made a lot of mistakes”, outside of not obeying President Trump’s demands for lower interest rates.
Meanwhile, the US Court of Appeals for the Federal Circuit upheld a ruling that the sweeping tariffs the US President Donald Trump unilaterally imposed on most other countries were illegal. Trump blasted the decision as “highly partisan” and vowed to appeal to the US Supreme Court.
Silver is a precious metal highly traded among investors. It has been historically used as a store of value and a medium of exchange. Although less popular than Gold, traders may turn to Silver to diversify their investment portfolio, for its intrinsic value or as a potential hedge during high-inflation periods. Investors can buy physical Silver, in coins or in bars, or trade it through vehicles such as Exchange Traded Funds, which track its price on international markets.
Silver prices can move due to a wide range of factors. Geopolitical instability or fears of a deep recession can make Silver price escalate due to its safe-haven status, although to a lesser extent than Gold’s. As a yieldless asset, Silver tends to rise with lower interest rates. Its moves also depend on how the US Dollar (USD) behaves as the asset is priced in dollars (XAG/USD). A strong Dollar tends to keep the price of Silver at bay, whereas a weaker Dollar is likely to propel prices up. Other factors such as investment demand, mining supply – Silver is much more abundant than Gold – and recycling rates can also affect prices.
Silver is widely used in industry, particularly in sectors such as electronics or solar energy, as it has one of the highest electric conductivity of all metals – more than Copper and Gold. A surge in demand can increase prices, while a decline tends to lower them. Dynamics in the US, Chinese and Indian economies can also contribute to price swings: for the US and particularly China, their big industrial sectors use Silver in various processes; in India, consumers’ demand for the precious metal for jewellery also plays a key role in setting prices.
Silver prices tend to follow Gold’s moves. When Gold prices rise, Silver typically follows suit, as their status as safe-haven assets is similar. The Gold/Silver ratio, which shows the number of ounces of Silver needed to equal the value of one ounce of Gold, may help to determine the relative valuation between both metals. Some investors may consider a high ratio as an indicator that Silver is undervalued, or Gold is overvalued. On the contrary, a low ratio might suggest that Gold is undervalued relative to Silver.
The Natural Gas (NG=F) market opened September trading under pressure, failing to hold early gains above the $3.00 threshold and slipping back toward $2.90. Monday’s holiday session in the U.S. exposed how thin volumes magnified volatility, with prices briefly spiking to $3.06 before reversing sharply lower. That reversal pattern has now confirmed a closing price reversal top, signaling that near-term momentum has turned bearish. The market’s inability to sustain moves above $3 reflects both weak institutional conviction and an oversupply narrative that continues to weigh on sentiment.
Natural gas futures are trading within a tight band, with resistance forming near $3.17 and immediate support at $2.88–$2.83. The $3.09 50-day EMA adds further overhead pressure, reinforcing the ceiling that capped Monday’s move. Stochastic indicators now show overbought conditions easing, suggesting that negative momentum could accelerate toward $2.85 and potentially down to $2.65 if support levels crack. The $2.50 zone, which acted as a floor earlier in the summer, remains the key level where buyers are likely to step back in. As of Monday’s close, the market settled at $2.92, down 0.75% on the day, highlighting a decisive rejection of the $3.00 mark.
Fundamentals continue to lean against bulls. U.S. weather has been moderate, reducing electricity demand tied to air conditioning, while domestic production remains strong. Inventories remain well supplied heading into autumn, creating limited urgency for buyers. Without the support of extreme temperatures or sudden supply disruptions, the oversupply theme dominates. Traders are already shifting their focus toward the coming winter heating season, but until colder weather materializes, the bearish tone persists. Analysts suggest that only a sharp draw in storage data or early winter demand could lift NG=F materially above $3.10 in the short term.
In Europe, benchmark natural gas prices at the Dutch TTF hub steadied near €31.9 per MWh after four consecutive sessions of declines. Demand in northwestern Europe topped 100 gigawatt hours per day as softer wind generation cut renewable output, boosting gas burn. LNG imports into Europe are more than 50% higher year-to-date, with storage sites now 77% full and on pace to meet the EU’s 80% target by early November. However, uncertainty looms over Russian Arctic LNG 2 shipments, as potential U.S. objections could tighten supply. While European fundamentals look stable, the global LNG trade adds volatility that directly impacts U.S. natural gas pricing.
The broader commodity complex has also been pressured by currency dynamics. A weaker U.S. dollar usually provides relief for dollar-denominated commodities, but natural gas has struggled to capitalize, reflecting its own supply-heavy fundamentals. Traders note that the dollar index’s slide toward 97.70 offered little support for NG=F compared with oil and metals, where demand-side speculation is stronger. For gas, the heavy domestic production levels and muted near-term demand keep it trading more on storage and weather than macro liquidity shifts.
Cheap natural gas is having ripple effects in the U.S. economy. Louisiana, for example, is attracting new industrial investment, including fertilizer production, thanks to $3.00/MMBtu feedstock costs that undercut European competition. Meta’s $10 billion AI data center project in Richland Parish is expected to drive local job growth, while low natural gas prices keep U.S. petrochemical and ammonia plants globally competitive. This underscores the broader economic advantage of subdued NG=F pricing, even as traders lament its weak price performance.
Natural gas futures remain volatile, with volume spikes near $2.80 suggesting key positioning zones for both bulls and bears. Institutional liquidations have reduced speculative length, leaving more room for short covering rallies but also signaling caution. Traders are watching whether the $2.88–$2.83 retracement zone holds as a higher bottom; a defense of this level could launch NG=F back toward $3.06 and even $3.23. Failure to hold support, however, reopens the path to $2.70 and $2.65, erasing August’s gains. Market sentiment remains skeptical, and analysts warn that without an early seasonal demand catalyst, the bearish narrative will persist through September.
With NG=F trading at $2.92 and repeatedly failing to sustain rallies above $3.00, the technical and fundamental setup leans bearish. Oversupply, weak demand, and thin trading conditions reinforce downside risks toward $2.65, with the possibility of testing $2.50 if momentum accelerates. While longer-term dynamics tied to winter heating could eventually flip sentiment, in the current context natural gas remains a Sell until it establishes a stronger base above $2.90 with volume support.
Silver (XAG/USD) kicks off the week on a strong footing, with spot prices extending their rally for a fifth consecutive session, breaking above the $40.00 mark to hit fresh 14-year highs — levels last seen in September 2011. At the time of writing, the metal is consolidating around $40.70, as thin trading conditions prevail due to the US Labor Day holiday.
The sustained rally in Silver comes on the back of broad US Dollar (USD) weakness and firm expectations of a Federal Reserve (Fed) interest rate cut in September, which continues to support demand for non-yielding assets. Market sentiment remains firmly bullish despite overbought technical signals, as traders weigh safe-haven demand amid mounting global uncertainty. A federal appeals court ruling on Friday declared most of US President Donald Trump’s global tariffs unlawful, casting fresh doubt over the future of US trade policy. Concerns over the Fed’s independence are also adding to market anxiety, further supporting the case for precious metals.
XAG/USD maintains a strong upward trajectory on the 4-hour chart, building on the bullish momentum that began in late July. After finding support near $36.00, the metal has been making higher highs and higher lows, indicating a clear uptrend with buyers consistently stepping in to defend dips and keep the bullish momentum intact.
The August close above the July 23 peak of $39.53 – a multi-year high – confirmed a significant breakout, supported by an 8.29% monthly gain. Price action has now decisively cleared the psychological $40.00 barrier, turning prior resistance at $39.50 into immediate support.
Silver is holding well above key short-term moving averages that continue to slope upward. Momentum indicators are elevated, with the Relative Strength Index (RSI) hovering near overbought territory, suggesting the potential for a brief consolidation or shallow pullback, though no clear signs of trend exhaustion are evident. The Moving Average Convergence Divergence (MACD) also signals strength, with expanding bullish histogram bars and the MACD line comfortably above the signal line.
Looking ahead, immediate resistance is seen at $41.00 and $42.00, with the next upside target at $43.40 — the high from September 5, 2011. On the downside, the $39.50-$39.00 zone remains a key support area, with any pullback toward this region likely to attract fresh buying interest. As long as broader macro and policy drivers remain aligned, XAG/USD appears poised to extend its rally toward new cycle highs.
Silver is a precious metal highly traded among investors. It has been historically used as a store of value and a medium of exchange. Although less popular than Gold, traders may turn to Silver to diversify their investment portfolio, for its intrinsic value or as a potential hedge during high-inflation periods. Investors can buy physical Silver, in coins or in bars, or trade it through vehicles such as Exchange Traded Funds, which track its price on international markets.
Silver prices can move due to a wide range of factors. Geopolitical instability or fears of a deep recession can make Silver price escalate due to its safe-haven status, although to a lesser extent than Gold’s. As a yieldless asset, Silver tends to rise with lower interest rates. Its moves also depend on how the US Dollar (USD) behaves as the asset is priced in dollars (XAG/USD). A strong Dollar tends to keep the price of Silver at bay, whereas a weaker Dollar is likely to propel prices up. Other factors such as investment demand, mining supply – Silver is much more abundant than Gold – and recycling rates can also affect prices.
Silver is widely used in industry, particularly in sectors such as electronics or solar energy, as it has one of the highest electric conductivity of all metals – more than Copper and Gold. A surge in demand can increase prices, while a decline tends to lower them. Dynamics in the US, Chinese and Indian economies can also contribute to price swings: for the US and particularly China, their big industrial sectors use Silver in various processes; in India, consumers’ demand for the precious metal for jewellery also plays a key role in setting prices.
Silver prices tend to follow Gold’s moves. When Gold prices rise, Silver typically follows suit, as their status as safe-haven assets is similar. The Gold/Silver ratio, which shows the number of ounces of Silver needed to equal the value of one ounce of Gold, may help to determine the relative valuation between both metals. Some investors may consider a high ratio as an indicator that Silver is undervalued, or Gold is overvalued. On the contrary, a low ratio might suggest that Gold is undervalued relative to Silver.
The Gold price (XAU/USD) continues its advance, holding at $3,473.77, up 0.83% on the session, after a strong August that lifted the metal nearly 5%. Futures for December delivery surged to $3,551.82, notching a new historical high above $3,550 per ounce, while spot prices climbed to $3,480.56, the strongest level since mid-April. The rally follows five consecutive days of gains, with investors flocking into bullion as a hedge against policy uncertainty, political tensions, and weakening U.S. dollar flows.
Markets are betting heavily on near-term easing. According to the CME FedWatch Tool, traders now price an 89% probability of a 25 bp rate cut at the Fed’s September 16–17 meeting, up from 85% before the latest inflation report. Notably, the U.S. GDP expanded at 3.3% in Q2, topping estimates of 3.1%, while the PCE index, the Fed’s preferred inflation gauge, remained above target. Despite resilient growth, the market is convinced the Fed will prioritize easing financial conditions as unemployment edges higher and labor demand cools. Lower yields reduce the opportunity cost of holding non-yielding gold, turning XAU/USD into a primary beneficiary.
The U.S. Dollar Index (DXY) slid to a five-week low, with particular weakness against the New Zealand dollar (−0.24%) and the euro (−0.05%). Yields on Treasuries softened as investors positioned for dovish policy. Gold has historically shown strong inverse correlation to the dollar, and the latest leg down in DXY has coincided with bullion’s push to record levels. The pricing of two possible cuts before year-end continues to underpin momentum, suggesting that dips in XAU/USD are seen as buying opportunities rather than risk signals.
Beyond U.S. monetary policy, gold is catching bids from global uncertainty. Escalation in the Gaza Strip, coupled with stalled peace efforts in Russia–Ukraine, has strengthened safe-haven flows. In the U.S., Trump’s attempt to remove Fed Governor Lisa Cook stirred fears of political interference in monetary policy, raising questions about central bank independence. Simultaneously, a federal appeals court ruled that most of Trump’s global tariffs are illegal, exposing billions in trade flows to legal uncertainty ahead of a Supreme Court review. Against this backdrop, bullion demand is not purely speculative — it reflects genuine hedging against systemic instability.
Gold’s technical chart shows a decisive breakout from an ascending triangle that had capped the metal since April. The move through $3,470–$3,500 unlocked a measured target near $3,800. Immediate support now lies at $3,450, followed by the 50-day EMA at $3,389. Momentum indicators show mixed signals: RSI remains elevated but not overbought, while MACD confirms bullish alignment. Short-term pullbacks toward $3,500 are likely to be met with buying interest, as traders who missed the breakout re-enter the market. If XAU/USD consolidates above $3,550, technical models suggest an extension toward $3,750–$3,800 in Q4.
Gold’s strength is spilling over into the wider metals complex. Silver (XAG/USD) surged 1.5% to $41.32, its highest since 2011, extending a rally that could test $44 if momentum persists. Platinum futures gained 1.3% to $1,346.65, while copper on the LME held steady at $9,934.65 per tonne. U.S. copper futures dipped marginally to $4.60 per pound, but sentiment remains supported by Chinese data showing industrial activity growing at its fastest pace in five months. For investors, the simultaneous rise across gold, silver, and platinum highlights the broad strength in precious metals as portfolio hedges.
The move above $3,550 per ounce marks the fifth straight monthly advance for gold. In August alone, prices climbed nearly 5%, extending a bullish trend that began after April’s retracement. Safe-haven demand remains relentless — both from retail investors and central banks that continue diversifying reserves away from the dollar. Unlike previous cycles, the sustained rise is not only tied to inflation fears but also to geopolitical and policy instability, which has turned XAU/USD into a barometer of confidence in U.S. governance.
Gold is locked in a powerful trend with clear scenarios. If support at $3,450–$3,500 holds, bulls will target $3,800 as the next milestone. A decisive move above $3,570 would reinforce this breakout trajectory. Conversely, a pullback below $3,450 would shift focus to the 50-day EMA at $3,389 and deeper supports near $3,380. The bearish case is only confirmed under $3,380, which could trigger a slide back toward $3,300. However, given institutional positioning, ETF inflows, Fed rate-cut bets, and geopolitical tailwinds, the weight of evidence favors continued upside.
Based on all factors — macro, technical, and flows — XAU/USD remains bullish, with buy setups favored above $3,500 and long-term targets clustered near $3,750–$3,800.