The main tag of Gold Price Articles.
You can use the search box below to find what you need.
[wd_asp id=1]
The main tag of Gold Price Articles.
You can use the search box below to find what you need.
[wd_asp id=1]
The Gold price (XAU/USD) continues its advance, holding at $3,473.77, up 0.83% on the session, after a strong August that lifted the metal nearly 5%. Futures for December delivery surged to $3,551.82, notching a new historical high above $3,550 per ounce, while spot prices climbed to $3,480.56, the strongest level since mid-April. The rally follows five consecutive days of gains, with investors flocking into bullion as a hedge against policy uncertainty, political tensions, and weakening U.S. dollar flows.
Markets are betting heavily on near-term easing. According to the CME FedWatch Tool, traders now price an 89% probability of a 25 bp rate cut at the Fed’s September 16–17 meeting, up from 85% before the latest inflation report. Notably, the U.S. GDP expanded at 3.3% in Q2, topping estimates of 3.1%, while the PCE index, the Fed’s preferred inflation gauge, remained above target. Despite resilient growth, the market is convinced the Fed will prioritize easing financial conditions as unemployment edges higher and labor demand cools. Lower yields reduce the opportunity cost of holding non-yielding gold, turning XAU/USD into a primary beneficiary.
The U.S. Dollar Index (DXY) slid to a five-week low, with particular weakness against the New Zealand dollar (−0.24%) and the euro (−0.05%). Yields on Treasuries softened as investors positioned for dovish policy. Gold has historically shown strong inverse correlation to the dollar, and the latest leg down in DXY has coincided with bullion’s push to record levels. The pricing of two possible cuts before year-end continues to underpin momentum, suggesting that dips in XAU/USD are seen as buying opportunities rather than risk signals.
Beyond U.S. monetary policy, gold is catching bids from global uncertainty. Escalation in the Gaza Strip, coupled with stalled peace efforts in Russia–Ukraine, has strengthened safe-haven flows. In the U.S., Trump’s attempt to remove Fed Governor Lisa Cook stirred fears of political interference in monetary policy, raising questions about central bank independence. Simultaneously, a federal appeals court ruled that most of Trump’s global tariffs are illegal, exposing billions in trade flows to legal uncertainty ahead of a Supreme Court review. Against this backdrop, bullion demand is not purely speculative — it reflects genuine hedging against systemic instability.
Gold’s technical chart shows a decisive breakout from an ascending triangle that had capped the metal since April. The move through $3,470–$3,500 unlocked a measured target near $3,800. Immediate support now lies at $3,450, followed by the 50-day EMA at $3,389. Momentum indicators show mixed signals: RSI remains elevated but not overbought, while MACD confirms bullish alignment. Short-term pullbacks toward $3,500 are likely to be met with buying interest, as traders who missed the breakout re-enter the market. If XAU/USD consolidates above $3,550, technical models suggest an extension toward $3,750–$3,800 in Q4.
Gold’s strength is spilling over into the wider metals complex. Silver (XAG/USD) surged 1.5% to $41.32, its highest since 2011, extending a rally that could test $44 if momentum persists. Platinum futures gained 1.3% to $1,346.65, while copper on the LME held steady at $9,934.65 per tonne. U.S. copper futures dipped marginally to $4.60 per pound, but sentiment remains supported by Chinese data showing industrial activity growing at its fastest pace in five months. For investors, the simultaneous rise across gold, silver, and platinum highlights the broad strength in precious metals as portfolio hedges.
The move above $3,550 per ounce marks the fifth straight monthly advance for gold. In August alone, prices climbed nearly 5%, extending a bullish trend that began after April’s retracement. Safe-haven demand remains relentless — both from retail investors and central banks that continue diversifying reserves away from the dollar. Unlike previous cycles, the sustained rise is not only tied to inflation fears but also to geopolitical and policy instability, which has turned XAU/USD into a barometer of confidence in U.S. governance.
Gold is locked in a powerful trend with clear scenarios. If support at $3,450–$3,500 holds, bulls will target $3,800 as the next milestone. A decisive move above $3,570 would reinforce this breakout trajectory. Conversely, a pullback below $3,450 would shift focus to the 50-day EMA at $3,389 and deeper supports near $3,380. The bearish case is only confirmed under $3,380, which could trigger a slide back toward $3,300. However, given institutional positioning, ETF inflows, Fed rate-cut bets, and geopolitical tailwinds, the weight of evidence favors continued upside.
Based on all factors — macro, technical, and flows — XAU/USD remains bullish, with buy setups favored above $3,500 and long-term targets clustered near $3,750–$3,800.
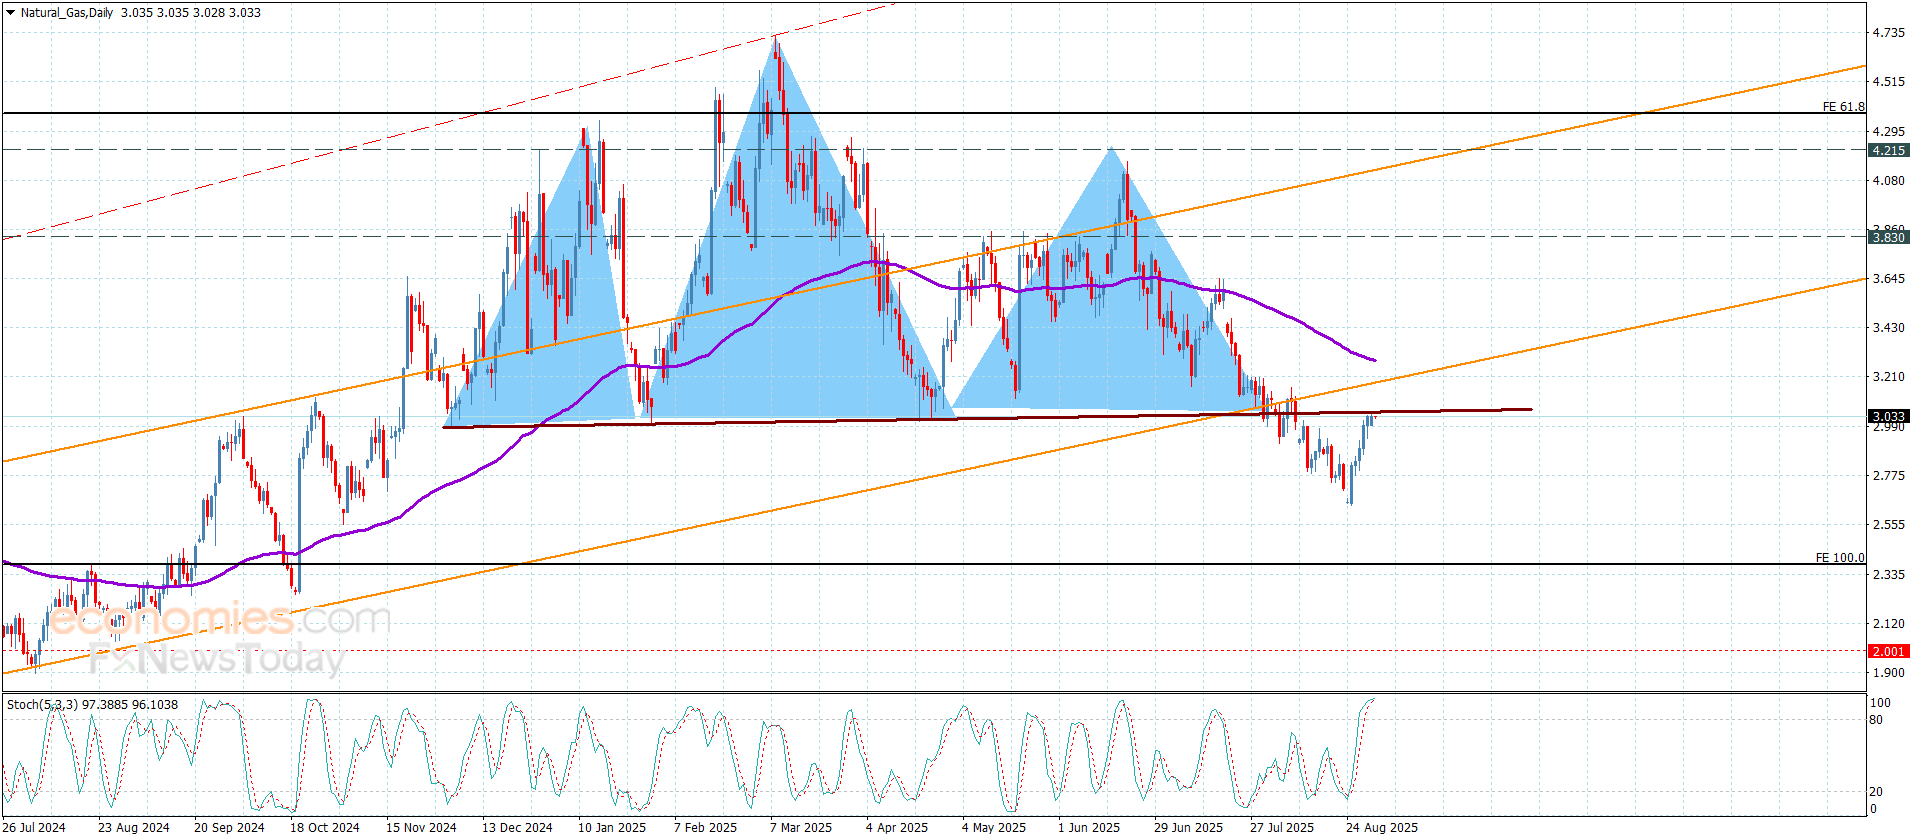
Natural gas price continued forming bullish correctional trading, to test the neckline of the head and shoulders pattern by reaching $3.050, but it will not affect the main bearish track, depending on the resistance at $3.170.
Stochastic reach to the overbought level confirms surpassing the positive pressure, increasing the chances for gaining the required negative momentum, to activate the negative attempts to reach $2.850, to repeat the pressure on $2.650 barrier.
The expected trading range for today is between $2.850 and $3.100
Trend forecast: Bearish
Natural gas price continued forming bullish correctional trading, to test the neckline of the head and shoulders pattern by reaching $3.050, but it will not affect the main bearish track, depending on the resistance at $3.170.
Stochastic reach to the overbought level confirms surpassing the positive pressure, increasing the chances for gaining the required negative momentum, to activate the negative attempts to reach $2.850, to repeat the pressure on $2.650 barrier.
The expected trading range for today is between $2.850 and $3.100
Trend forecast: Bearish
The (silver) price expanded its gains in its last intraday trading, breaching $40.10 resistance, which represents a target in our previous forecast, amid the dominance of the main bullish trend on the short-term basis and its trading alongside main and minor bias line that reinforce the stability of this trend, especially with the continuation of the positive support that comes from its trading above EMA50, with the emergence of the positive signals on the (RSI), despite reaching overbought levels, which might obstacle the continuation of the upside moves on the intraday basis, due to the neediness to offload some of the overbought conditions.
Get high-accuracy trading signals delivered directly to your Telegram. Subscribe to specialized packages tailored for the world’s top markets:
Full VIP signals performance report for August 25–29, 2025:
The (Brent) price settled low in its last intraday trading, after gaining some positive momentum due to its lean on the support of its EMA50, which helped it to stop the losses bleeding in its previous trading, in an attempt to look for a base to support it to rise again, amid the dominance of the bullish correctional trend on the short-term basis and its trading alongside a bias line, noticing that the (RSI) reached oversold levels, exaggeratedly compared to the price move.
Get high-accuracy trading signals delivered directly to your Telegram. Subscribe to specialized packages tailored for the world’s top markets:
Full VIP signals performance report for August 25–29, 2025:
Gold has regained traction early Monday, sitting at the highest levels in five months near $3,480. The US and Canadian markets are closed on Monday due to Labor Day, leaving Gold at the mercy of thin trading conditions.
Gold is seeing a positive start to September, extending its uptrend into a fifth consecutive day, while approaching the record highs of $3,500.
The latest leg north in Gold could be attributed to the revival of safe-haven demand amid the declines across the Asian markets, especially with the Japanese Nikkei 225 index hit hard in the aftermath of Friday’s tech sell-off on Wall Street.
Renewed uncertainty on the trade front adds to the risk-averse market profile. On Friday, a US court ruled that President Donald Trump’s global tariffs, unilaterally imposed, as largely illegal.
However, US Trade Representative Jamieson Greer said in a Fox News interview on Sunday that the Trump administration will likely continue negotiations with its trade partners despite Friday’s US court ruling.
Moreover, a surprise jump in the Chinese Caixin Manufacturing PMI for August adds to the renewed Gold price upside.
The RatingDog China general Manufacturing Purchasing Managers Index rose to 50.5 last month from 49.5 in July, according to data released Monday by S&P Global, beating the estimated 49.5 readout.
Furthermore, expectations of aggressive US Federal Reserve (Fed) easing in the coming months also power the non-yielding Gold. Markets are pricing in a roughly 90% chance of the Fed lowering interest rates this month, according to the CME Group’s FedWatch Tool.
In line with estimates US Core Personal Consumption Expenditures (PCE) Price Index – the Fed’s preferred inflation gauge, released on Friday, strengthened the dovish sentiment around the Fed expectations.
Meanwhile, attention turns to a slew of critical US employment data due later this week for fresh signs on the health of the country’s labor market, which is key to determining the scope and the timing of the next Fed rate cuts.
Additionally, speeches by Fed policymakers and trade headlines will also keep Gold traders entertained.
The daily chart shows that Gold has more room to the upside as the 14-day Relative Strength Index (RSI) is still beneath the overbought region while comfortably in the bullish zone.
Meanwhile, the 21-day Simple Moving Average (SMA) and the 50-day SMA bullish crossover remains in play.
The immediate topside hurdle is seen at the record high of $,3500, above which the $3,550 psychological level will be tested.
On the flip side, any pullback will challenge the intraday of $3,437 initially, below which sellers will attack the $3,400 level.
A sustained break below the latter will expose the 21-day SMA at $3,373.
Nonfarm Payrolls (NFP) are part of the US Bureau of Labor Statistics monthly jobs report. The Nonfarm Payrolls component specifically measures the change in the number of people employed in the US during the previous month, excluding the farming industry.
The Nonfarm Payrolls figure can influence the decisions of the Federal Reserve by providing a measure of how successfully the Fed is meeting its mandate of fostering full employment and 2% inflation.
A relatively high NFP figure means more people are in employment, earning more money and therefore probably spending more. A relatively low Nonfarm Payrolls’ result, on the either hand, could mean people are struggling to find work.
The Fed will typically raise interest rates to combat high inflation triggered by low unemployment, and lower them to stimulate a stagnant labor market.
Nonfarm Payrolls generally have a positive correlation with the US Dollar. This means when payrolls’ figures come out higher-than-expected the USD tends to rally and vice versa when they are lower.
NFPs influence the US Dollar by virtue of their impact on inflation, monetary policy expectations and interest rates. A higher NFP usually means the Federal Reserve will be more tight in its monetary policy, supporting the USD.
Nonfarm Payrolls are generally negatively-correlated with the price of Gold. This means a higher-than-expected payrolls’ figure will have a depressing effect on the Gold price and vice versa.
Higher NFP generally has a positive effect on the value of the USD, and like most major commodities Gold is priced in US Dollars. If the USD gains in value, therefore, it requires less Dollars to buy an ounce of Gold.
Also, higher interest rates (typically helped higher NFPs) also lessen the attractiveness of Gold as an investment compared to staying in cash, where the money will at least earn interest.
Nonfarm Payrolls is only one component within a bigger jobs report and it can be overshadowed by the other components.
At times, when NFP come out higher-than-forecast, but the Average Weekly Earnings is lower than expected, the market has ignored the potentially inflationary effect of the headline result and interpreted the fall in earnings as deflationary.
The Participation Rate and the Average Weekly Hours components can also influence the market reaction, but only in seldom events like the “Great Resignation” or the Global Financial Crisis.
Gold price (XAU/USD) has picked up fresh bids, resuming its uptrend in the Asian trading hours on Monday. The precious metal shrugs off its profit-taking pullback and rebounds to a fresh five-month high near $3,470 on increased dovish US Federal Reserve (Fed) expectations.
The US inflation data reinforced expectations that the Fed could cut interest rates this month.
Markets weigh in fresh US trade uncertainty after a US court on Friday ruled US President Donald Trump’s global tariffs as largely illegal.
A slew of US economic data last week, including US Gross Domestic Product (GDP) and US Initial Jobless Claims reports, underpinned the US Dollar (USD) and weighed on the USD-denominated commodity price. The US GDP grew at an annual rate of 3.3% in Q2, compared to the initial estimate of 3.0%, the US Bureau of Economic Analysis (BEA) showed Thursday. This figure came in better than the estimation of 3.1%.
Nonetheless, the US Personal Consumption Expenditures (PCE) Price Index, the Fed’s preferred inflation measurement, stayed higher than the central bank’s target in July, but it didn’t dash traders’ hopes for a rate cut. The expectation of Fed rate cuts continues to support the yellow metal, as lower interest rates could reduce the opportunity cost of holding Gold.
Traders are now pricing in nearly an 89% chance of a 25 basis points (bps) rate cut by the Fed at the September policy meeting, up from 85% odds before the US PCE data, according to the CME FedWatch tool. “We have expectations of a Fed rate cut, or potentially two, throughout this year, (which is) generally supportive for commodity prices across the board, including gold and silver,” said David Meger, director of metals trading at High Ridge Futures.
The table below shows the percentage change of US Dollar (USD) against listed major currencies today. US Dollar was the weakest against the New Zealand Dollar.
| USD | EUR | GBP | JPY | CAD | AUD | NZD | CHF | |
|---|---|---|---|---|---|---|---|---|
| USD | -0.05% | -0.17% | 0.09% | 0.03% | 0.08% | -0.24% | 0.09% | |
| EUR | 0.05% | -0.12% | 0.07% | 0.09% | 0.13% | -0.19% | 0.15% | |
| GBP | 0.17% | 0.12% | 0.08% | 0.21% | 0.25% | -0.07% | 0.32% | |
| JPY | -0.09% | -0.07% | -0.08% | 0.02% | 0.01% | -0.29% | 0.04% | |
| CAD | -0.03% | -0.09% | -0.21% | -0.02% | 0.06% | -0.28% | 0.11% | |
| AUD | -0.08% | -0.13% | -0.25% | -0.01% | -0.06% | -0.32% | 0.06% | |
| NZD | 0.24% | 0.19% | 0.07% | 0.29% | 0.28% | 0.32% | 0.39% | |
| CHF | -0.09% | -0.15% | -0.32% | -0.04% | -0.11% | -0.06% | -0.39% |
The heat map shows percentage changes of major currencies against each other. The base currency is picked from the left column, while the quote currency is picked from the top row. For example, if you pick the US Dollar from the left column and move along the horizontal line to the Japanese Yen, the percentage change displayed in the box will represent USD (base)/JPY (quote).
Front-month NG=F futures closed August with a sharp rebound, settling at $2.997 per MMBtu after climbing 1.80% on Friday. Despite the late-month rally, the commodity still logged a 5.73% monthly decline, weighed by cooler weather projections and record output levels. Prices had slumped to a 9.5-month low earlier in the week before short covering and bullish storage data ignited a turnaround. With momentum shifting, traders are closely monitoring whether the rebound has legs to clear the next major resistance zone between $3.238 and $3.300.
The latest EIA report provided a critical spark for bulls. U.S. inventories rose only +18 bcf for the week ending August 22, well below expectations for a +27 bcf build and far under the five-year average of +38 bcf. Current storage sits 3.5% below last year’s levels, though still 5% above the five-year seasonal norm. This tighter-than-expected build signaled stronger demand absorption and underpinned the futures rally. In Europe, gas storage levels are 77% full, below the seasonal average of 84%, tightening global balances further ahead of peak heating demand.
While storage draws support prices, U.S. output continues to flood the market. Dry gas production hit 107.4 bcf/day, a 3.8% year-over-year increase, keeping supply near record highs. LNG feedgas flows softened slightly to 15.6 bcf/day, down 1.9% week-over-week, while lower-48 demand slid 11.9% year-over-year to 71.7 bcf/day. Baker Hughes data shows 122 active gas rigs, just below a two-year high, highlighting the persistent oversupply pressure despite recent declines. The EIA lifted its production outlook for 2025 to 106.44 bcf/day, with a further rise projected in 2026 to 106.09 bcf/day.
The market’s technical structure has improved. Natural gas futures reclaimed the 20-Day Moving Average at $2.89 and the AVWAP level near $2.96, turning prior resistance into support. A breakout from a falling wedge pattern added bullish momentum, and the weekly chart is on track to confirm a bullish engulfing candle. The channel midpoint at $2.92 held on recent pullbacks, reinforcing trend strength. Near term, the $3.15–$3.19 range is the immediate target, aligning with both wedge breakout projections and the 50-Day Moving Average at $3.18. A decisive close above $3.238 would mark a structural breakout, opening upside toward $3.40 and beyond.
Weather remains the key swing factor. Forecasts project early-autumn coolness across the eastern U.S., reducing late-summer air-conditioning demand, while the West braces for hotter-than-normal conditions. The NOAA continues to flag 80% probability of above-average heatwaves in the Carolinas and Virginia, implying stronger regional power burn. In July, U.S. power sector demand surged to 49.1 bcfd, setting records in Texas and Louisiana. Meanwhile, Edison Electric Institute data shows U.S. electricity output rose 7.7% y/y in the week ending August 23 and 3.1% y/y over the trailing 52 weeks, underscoring the growing linkage between power demand and gas consumption.
Beyond near-term volatility, the long-term structure remains bullish. IEA forecasts project global gas demand rising 2% annually through 2050, with LNG as the primary growth driver. U.S. exports are expected to expand to 16 bcf/day by 2026, led by major projects like Plaquemines LNG and Corpus Christi Stage 3, which will pull more gas from domestic balances. European LNG imports are forecast to climb 25% in 2025, offsetting Russian pipeline cuts. This structural demand expansion positions NG=F for a sustained upward repricing, especially if U.S. production growth slows from geological or regulatory constraints.
Price volatility has eased, with Henry Hub historical volatility falling from 81% in Q4 2024 to 69% by mid-2025, reflecting normalized seasonal patterns and balanced inventories. Yet the decline in volatility masks the risk of sharp weather-driven spikes. The market remains in a fragile balance, where minor shifts in LNG flows, storage builds, or weather-driven demand could quickly trigger double-digit price swings. Investors are navigating a dual narrative: near-term caution tied to high production and cooler forecasts, versus long-term optimism built on LNG, industrial adoption, and power sector demand.
With NG=F at $2.997, the immediate technical battle is clear. Support holds at $2.92, while resistance tightens near $3.19–$3.238. A breakout opens upside toward $3.40 and $3.65, while a failure exposes downside risk back to $2.74. Fundamentally, tightening storage builds and LNG expansion argue for sustained bullishness into 2026, but record U.S. output remains the dominant headwind. Based on current conditions, natural gas leans cautiously bullish with a Buy bias, contingent on holding above $2.92 and breaking through the $3.238 ceiling.
Silver (XAG/USD) extends its rally for the fourth consecutive day on Friday, with spot prices climbing to fresh 14-year highs. The metal trades around $39.85 at the time of writing, surpassing the July 23 peak of $39.53, as sustained weakness in the US Dollar (USD) and firm safe-haven demand keep buyers firmly in control.
The rally comes as investors continue to bet on an interest rate cut at the Federal Reserve’s (Fed) September monetary policy meeting, even after mixed US inflation data. July’s core Personal Consumption Expenditures (PCE) index rose to 2.9%YoY, its highest in five months, while headline PCE held steady at 2.6%. Although the firmer core reading complicates the policy debate, markets are increasingly focused on the labor market, where signs of cooling hiring momentum and softer wage growth suggest a bigger risk to the economy than lingering inflation pressures.
Swaps are still pricing about an 87% chance of a September cut, keeping the recent dovish tilt in focus. Alongside that, broader factors, including a weaker US Dollar, geopolitical frictions, and steady industrial demand from the solar and green energy sectors, continue to support XAG/USD’s bullish momentum.
Adding to the backdrop, concerns over the Fed’s independence have deepened after US President Donald Trump moved to dismiss Fed Governor Lisa Cook on allegations of mortgage fraud. Cook has responded with a lawsuit seeking an injunction to block the decision, marking an unprecedented legal challenge to the central bank’s autonomy. The episode has unsettled confidence in U.S. monetary policy and further pressured the Dollar, reinforcing safe-haven flows into silver. The move has added pressure to an already broadly weak US Dollar and reinforced safe-haven flows into Silver.
From a technical perspective, Silver’s breakout above $39.50 has shifted the near-term bias firmly higher, with the metal now approaching the $40.00 psychological barrier. The 4-hour chart shows XAG/USD comfortably above the 100-period Exponential Moving Average (EMA) at $38.35, while the Relative Strength Index (RSI) sits near 74 in overbought territory, suggesting strong but stretched momentum. A sustained push through this level would open the door toward the $41.48 high from September 12, 2011, with the next upside target at $43.40, the peak from September 5, 2011. On the downside, immediate support lies at $39.00, followed by the 100-period EMA near $38.35, which should act as a key pivot zone for bulls.
Silver is a precious metal highly traded among investors. It has been historically used as a store of value and a medium of exchange. Although less popular than Gold, traders may turn to Silver to diversify their investment portfolio, for its intrinsic value or as a potential hedge during high-inflation periods. Investors can buy physical Silver, in coins or in bars, or trade it through vehicles such as Exchange Traded Funds, which track its price on international markets.
Silver prices can move due to a wide range of factors. Geopolitical instability or fears of a deep recession can make Silver price escalate due to its safe-haven status, although to a lesser extent than Gold’s. As a yieldless asset, Silver tends to rise with lower interest rates. Its moves also depend on how the US Dollar (USD) behaves as the asset is priced in dollars (XAG/USD). A strong Dollar tends to keep the price of Silver at bay, whereas a weaker Dollar is likely to propel prices up. Other factors such as investment demand, mining supply – Silver is much more abundant than Gold – and recycling rates can also affect prices.
Silver is widely used in industry, particularly in sectors such as electronics or solar energy, as it has one of the highest electric conductivity of all metals – more than Copper and Gold. A surge in demand can increase prices, while a decline tends to lower them. Dynamics in the US, Chinese and Indian economies can also contribute to price swings: for the US and particularly China, their big industrial sectors use Silver in various processes; in India, consumers’ demand for the precious metal for jewellery also plays a key role in setting prices.
Silver prices tend to follow Gold’s moves. When Gold prices rise, Silver typically follows suit, as their status as safe-haven assets is similar. The Gold/Silver ratio, which shows the number of ounces of Silver needed to equal the value of one ounce of Gold, may help to determine the relative valuation between both metals. Some investors may consider a high ratio as an indicator that Silver is undervalued, or Gold is overvalued. On the contrary, a low ratio might suggest that Gold is undervalued relative to Silver.
Earlier in the week crude oil triggered a bull breakout to a five-week high of $71.33. It is on track to end the week in a relatively bullish position, in the upper third of the week’s trading range. If it can close the week above $69.98, the bullish breakout on the weekly timeframe will be confirmed. That would potentially increase the possibility of a continuation to the upside, at least to the next target zone mentioned above.
If the advance can continue, as the weekly chart supports, the 61.8% Fibonacci retracement zone at $73.31 is the next upside target. A downtrend line crosses through that Fibonacci level by August 11. After that a downtrend line will represent potential dynamic resistance prior to the 61.8% level.
Given that there have been signs of short-term resistance over the past couple of days, a pullback might follow. Potential support around the 200-Day MA is a key area to watch for a bounce and bullish reversal. However, if selling persists there is a consolidation zone of potential support down to the recent low at $65.63. That should slow down bearish momentum if it persists. This week’s low of $65.90 is also a potential support area of note, as well as last week’s high of $67.68.
It is important to keep in mind that crude oil remains in a five-day consolidation zone until it confirms the weekly breakout. A rise from the bottom of a large descending channel at the April swing low pointed to a potential test of resistance at the top of the channel. That happened in June. Now that crude is again rising from key support levels, the top of the channel becomes a potential target. Keep this in mind if crude oil gets closer to the top channel line.
For a look at all of today’s economic events, check out our economic calendar.