The main tag of Gold Price Articles.
You can use the search box below to find what you need.
[wd_asp id=1]
The main tag of Gold Price Articles.
You can use the search box below to find what you need.
[wd_asp id=1]
“The Fed appears to be keeping its tightening bias alive, and that makes it difficult for precious metals to build sustained momentum,” said a Singapore-based commodities strategist. The US Dollar extended gains on the hawkish tone, adding to the headwinds for metals priced in the greenback.
The metals market also absorbed geopolitical and political developments that shaped investor sentiment. Optimism surrounding potential progress in Russia-Ukraine peace efforts has eased safe-haven demand. Russian Foreign Minister Sergey Lavrov reiterated that any security arrangement would be incomplete without Moscow’s involvement, underscoring the complexity of negotiations.
Meanwhile, US domestic politics injected uncertainty into markets. Former President Trump’s demand for the resignation of Federal Reserve Governor Lisa Cook over alleged mortgage fraud has stirred debate about central bank independence.
Political instability, while weighing on the US Dollar’s long-term outlook, has provided limited support for gold and silver in the near term.
Looking ahead, investor attention is firmly on Fed Chair Jerome Powell’s upcoming remarks at the Jackson Hole Symposium. Markets expect Powell to offer critical guidance on the policy path, particularly regarding the balance between inflation risks and slowing growth.
Alongside Powell’s speech, flash PMIs, weekly jobless claims, and the Philadelphia Fed Manufacturing Index will provide essential signals on global economic momentum.
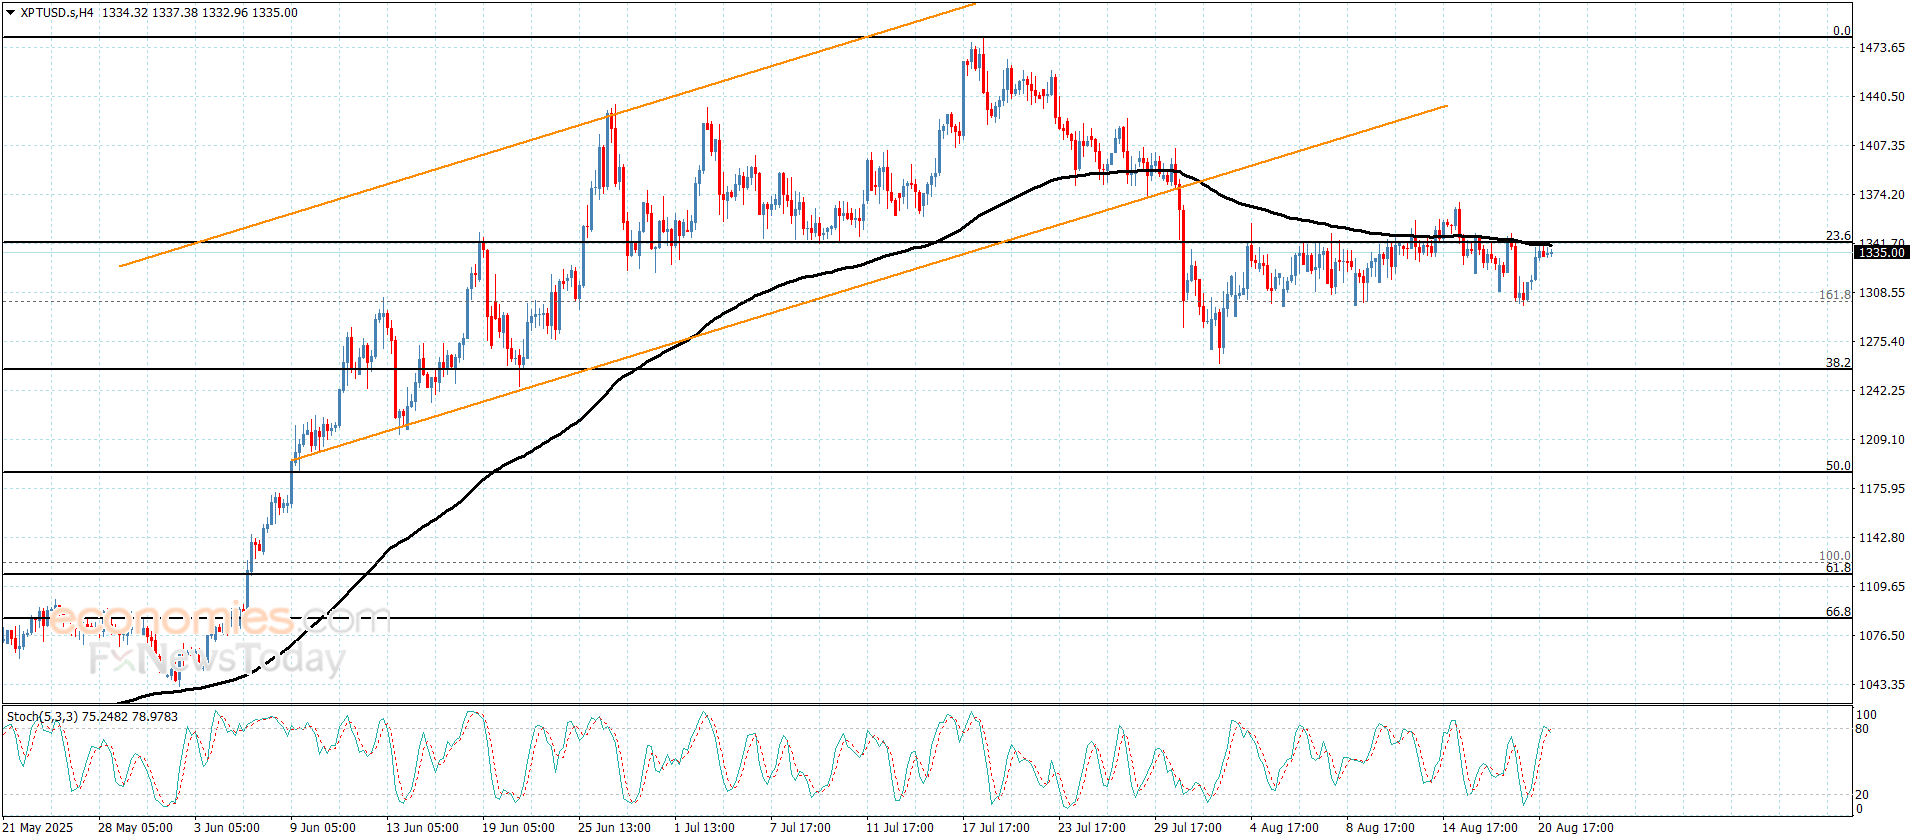
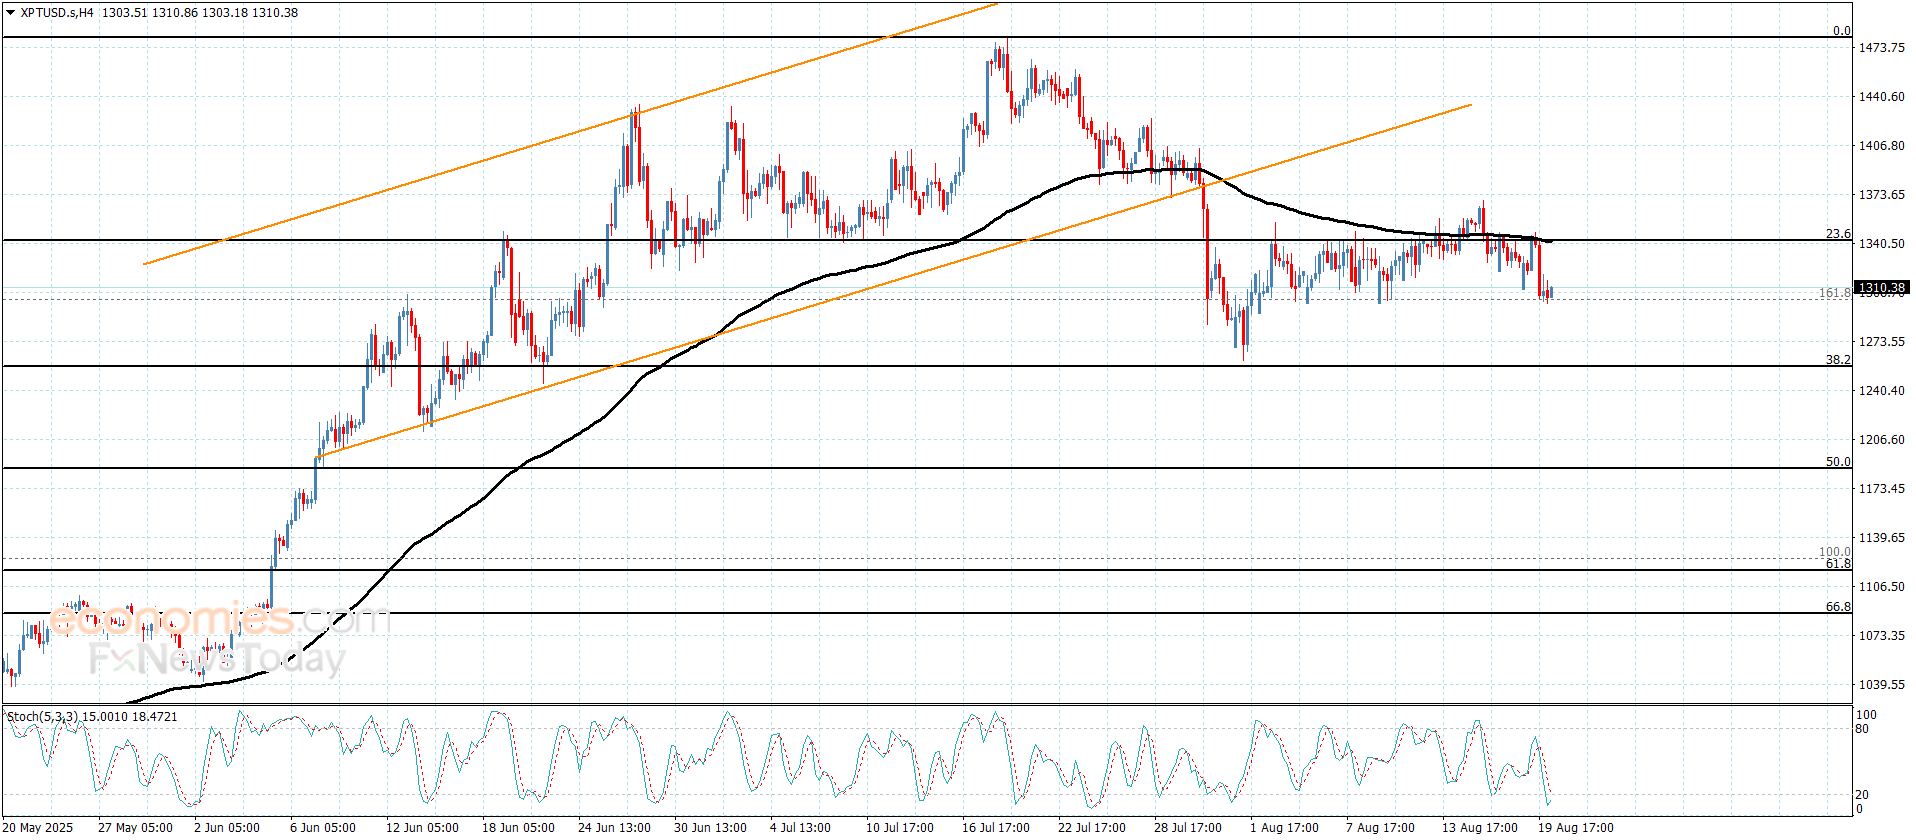
Platinum price surpassed some of the negative pressures by stochastic rally to 80 level, keeping its stability above the support of the sideways track that is represented by $1302.00, to rally to the moving average 55, which reinforces the stability of the barrier at $1342.00.
We will remain neutral, to keep waiting for surpassing one of the main levels to confirm the expected trend in the near and medium period, breaching the barrier will open the way for achieving more of the gains by the price rally to $1365.00 and $1382.00, while breaking the support and holding below it will activate bearish correctional track, and $1281.00 level represents the initial negative target for the bearish track.
The expected trading range for today is between $1302.00 and $1342.00
Trend forecast: Neutral
Wednesday’s reversal established a higher swing low, while reaffirming dynamic support at the triangle’s lower boundary line. A rally above last week’s minor swing high at $3,375 would further confirm strength, putting the upper boundary in sight. Beyond that, $3,409 presents an intermediate hurdle. A decisive breakout above $3,439, however, would clear resistance at the top boundary and signal continuation of the broader bull trend.
The consolidation has compressed price energy, building potential for an eventual surge once a breakout occurs. Any sustained upside move should be accompanied by stronger volume and signs of momentum expansion to validate a bullish continuation.
Importantly, the recent pullback found support around the long-term 20-Week moving average. That level was also tested successfully in late July, confirming its role as dynamic support. It is not unusual for price to retest such a key moving average before breaking higher. This behavior adds weight to the current rebound and strengthens the argument that gold is preparing for another leg higher if resistance is overcome.
For a look at all of today’s economic events, check out our economic calendar.
Natural gas futures NG=F are locked in a bearish setup, trading at $2.75 after multiple failed attempts to break above $2.88, the ceiling reinforced by the 100-day EMA. A descending trendline has capped every rally since late July, keeping bulls sidelined. The current structure shows price action pinned just above short-term support at $2.73, but momentum is weak — the RSI at 36.3 signals that sellers remain in control. Unless there is a rebound above $2.80–$2.83, markets face another leg down toward $2.67, with an extension to $2.61 if selling pressure accelerates.
The rejection at $3.05 earlier this week marked the neckline of a bearish reversal pattern, and the follow-through to $2.76 confirmed that control has shifted to sellers. Analysts tracking price cycles point to $2.61 as the next key station, with further downside risks toward $2.39. The trading range projected for this week is $2.61–$2.85, skewed to the downside. Negative momentum across oscillators — RSI, Stochastic, and MACD — strengthens the case for continued weakness unless a sharp volume-driven recovery develops.
Natural gas inventories remain elevated, keeping storage buffers comfortable heading into late summer. With U.S. temperatures mild, neither air-conditioning demand nor heating demand is stressing the grid. That seasonal lull has coincided with a steep drop from early August highs, as speculative longs unwind positions in the absence of strong consumption catalysts. Traders now eye the $2.50 zone as a likely point of capitulation before the market starts to turn its attention to winter heating demand. Historically, NG=F often finds a seasonal floor in the $2.40–$2.50 band before building pre-winter rallies.
The latest macro shock comes not from energy-specific data but from monetary policy fears. Ahead of Jerome Powell’s Jackson Hole speech, commodities tied to risk sentiment, including natural gas, have been pressured lower. Fears of sticky inflation — reinforced by consumer price signals and warnings from U.S. retailers like Home Depot about cost pressures — have raised the probability that the Fed delays rate cuts. For NG=F, this means speculative capital outflows as traders reduce exposure to volatile assets. In just 24 hours, natural gas lost nearly 0.73%, with the broader commodity complex in the red. If Powell signals higher-for-longer rates, expect NG=F to retest $2.61 quickly, with deeper losses possible.
While natural gas is not as directly tied to OPEC+ as crude, the broader energy complex has been dragged by production increases from OPEC+ members and Russian export flows. Oil benchmarks are down 10% month-to-date, with Brent trading at $66.44 and WTI at $62.47, and this weakness has bled into NG=F sentiment. Traders are increasingly pricing in an oversupplied global market, especially with U.S. LNG export growth failing to offset weaker domestic consumption. Until supply disruptions or unexpected geopolitical risks emerge, NG=F is vulnerable to further downside.
Despite the short-term bearish tilt, the medium-term picture for NG=F is not universally negative. If buyers can force a sustained break above $2.83, it would trigger a relief rally to $2.95, followed by a retest of $3.25 — the upper boundary that would need to be cleared to shift momentum decisively. Such a breakout would require a combination of colder-than-expected September weather forecasts and stronger LNG demand. Until then, short sellers are expected to dominate every rally, with resistance layers thick between $2.80–$2.95.
At $2.75, with clear bearish technical signals, comfortable storage, mild weather, and Powell risk looming, the bias remains bearish in the short term. NG=F is more likely to test $2.61 and even $2.39 before staging a seasonal recovery toward winter. Aggressive traders may see speculative opportunities near $2.50, historically a turnaround level, but without a confirmed catalyst, any long positions remain highly risky. Based on the current balance of evidence, NG=F aligns more with a Sell rating, with opportunistic buys only at deeper support zones closer to $2.50.
The EURJPY pair didn’t settle above 172.00 level, affected by stochastic exit from the overbought level, forming some of the bearish correctional waves and its stability near 171.65.
The continuation of the negative pressures will force it to suffer more of the losses, to expect attacking 170.45 level, to extend the losses towards 169.80 which might form a neckline for the negative double top level, therefore, we recommend monitoring the price behavior when reaching this level to detect the main trend in the upcoming trading.
The expected trading range for today is between 170.45 and 172.30
Trend forecast: Bearish
The gold price index has fallen to a three-week low, with losses taking it to the $3311 support level. Before this decline, we had advised on the live trading recommendations page to close the buy recommendation for gold at the current profit to avoid further selling pressure. The recent drop was fueled by the potential for easing geopolitical tensions and a rising US dollar, both weighing on the yellow metal ahead of the Federal Reserve’s Jackson Hole Symposium.
Yesterday, US President Trump indicated he would not deploy ground troops to Ukraine, but left open the possibility of providing air support as part of efforts to address the conflict with Russia. Ukrainian President Zelenskiy also welcomed the peace talks, but Russia has not yet confirmed its participation, creating uncertainty about the prospects for a swift resolution.
Meanwhile, amid an additional factor influencing the market, all eyes are on Federal Reserve Chairman Powell’s upcoming speech at the Jackson Hole Symposium, seeking guidance on the future direction of the US central bank’s policy. Later today, the release of the minutes from the latest Federal Open Market Committee (FOMC) meeting is expected to provide additional insights. Overall, market prices currently point to two 25 basis point rate cuts this year, with the first likely to occur in September.
Dear reader, based on the performance on the daily chart above, gold prices are still trending down. According to gold analysts’ expectations, bears may have the opportunity to breach the $3,300 per ounce support level if an agreement is reached to end the Russian-Ukrainian war. The US dollar gained ground in response to the Jackson Hole Symposium, and vice versa. With the recent losses, the 14-day RSI has moved around a reading of 48 below the midline, supporting bearish control and signaling a stronger downward move before the index reaches a sell-off. Meanwhile, the MACD indicator remains bearish.
Note that a break of the $3,300 support will increase technical selling activity, but at the same time, it may provide opportunities to establish a new buying base. Conversely, over the same timeframe, bulls will regain confidence in the performance if they return the gold price index to the resistance levels of $3,375 and $3,400 per ounce, respectively.
Traders at TradersUp are advised to wait for gold to move towards and below the $3,300 support level before considering buying again.
According to currency market trading, the US Dollar Index (DXY), which measures the performance of the US currency against a basket of other major currencies, rose above 98.3 today, continuing its winning streak for the third consecutive session. This comes as investors await the minutes of the Federal Reserve’s July meeting for clues on the outlook for monetary policy. The meeting was notable for being the first since 1993, with two dissenting members voting, with Fed Governors Christopher Waller and Michael Bowman favoring a quarter-point cut in US interest rates rather than holding them steady.
Markets will now focus on Fed Chair Jerome Powell’s remarks at the Jackson Hole Symposium for indications of whether the US central bank will resist market expectations for monetary easing. Traders currently price in an 85% chance of a September rate cut and anticipate about 54 basis points of cuts by year-end.
According to trading, the US dollar has generally strengthened, with its largest gains against the Euro, Pound Sterling, and Australian Dollar.
Ready to trade our Gold forecast? We’ve shortlisted the most trusted Gold brokers in the industry for you.
Important DisclaimersThe content provided on the website includes general news and publications, our personal analysis and opinions, and contents provided by third parties, which are intended for educational and research purposes only. It does not constitute, and should not be read as, any recommendation or advice to take any action whatsoever, including to make any investment or buy any product. When making any financial decision, you should perform your own due diligence checks, apply your own discretion and consult your competent advisors. The content of the website is not personally directed to you, and we does not take into account your financial situation or needs.The information contained in this website is not necessarily provided in real-time nor is it necessarily accurate. Prices provided herein may be provided by market makers and not by exchanges.Any trading or other financial decision you make shall be at your full responsibility, and you must not rely on any information provided through the website. FX Empire does not provide any warranty regarding any of the information contained in the website, and shall bear no responsibility for any trading losses you might incur as a result of using any information contained in the website.The website may include advertisements and other promotional contents, and FX Empire may receive compensation from third parties in connection with the content. FX Empire does not endorse any third party or recommends using any third party’s services, and does not assume responsibility for your use of any such third party’s website or services.FX Empire and its employees, officers, subsidiaries and associates, are not liable nor shall they be held liable for any loss or damage resulting from your use of the website or reliance on the information provided on this website.Risk DisclaimersThis website includes information about cryptocurrencies, contracts for difference (CFDs) and other financial instruments, and about brokers, exchanges and other entities trading in such instruments. Both cryptocurrencies and CFDs are complex instruments and come with a high risk of losing money. You should carefully consider whether you understand how these instruments work and whether you can afford to take the high risk of losing your money.FX Empire encourages you to perform your own research before making any investment decision, and to avoid investing in any financial instrument which you do not fully understand how it works and what are the risks involved.
The (silver) price continued the decline in its last intraday trading, affected by the dominance of minor bearish wave, while it moves alongside a support bias line, indicating the strength of the dominant pressure on the trading, resuming its trading below EMA50, intensifying the strength of the bearish trend.
At the same time, the negative signals come from the (RSI), despite reaching sharp oversold levels, opening the way for limited rebounding attempts on an intraday basis, but the overall technical image remains suggesting more of the downside moves unless it manages to breach critical resistance levels that turns some of the positive momentum back.
BestTradingSignal.com – Professional Trading Signals with high accuracy. Subscribe now to tailored packages for the world’s leading markets and receive signals instantly via Telegram from an expert team:
Check full VIP signals performance report for the week of August 11–15, 2025: Full Report
If gold breaks decisively below the triangle’s lower boundary, a bearish signal would be triggered. However, confirmation requires further weakness, specifically a decline through the higher swing low at $3,268. A close below that level would confirm a breakdown from the triangle, setting up a test of the May swing low at $3,121. That level also marks the completion of a 38.2% Fibonacci retracement ($3,149) measured from April’s $3,500 record high.
Should $3,121 fail to hold, volatility could increase sharply, as failed consolidation patterns often lead to extended moves. Given that this triangle has formed at the top of a long-term bull trend, the expectation under normal conditions would be for an eventual upside breakout. If that does not occur, the 200-Day moving average, now at $3,043, becomes the next major downside target. Whether it is reached or not it indicates increasing seller pressure.
While bearish risks dominate in the short term, traders should also remain alert to the potential for false breakdowns. A reversal back into the triangle after a failed move lower could set the stage for renewed bullish momentum. A breakout above the $3,439 swing high, which helps define the triangle’s upper boundary, would confirm such a reversal and signal a return to the longer-term uptrend.
Until gold breaks decisively beyond the symmetrical triangle boundaries, momentum is likely to remain muted. Within this consolidation phase, short-term patterns are less likely to follow through. For now, bears control the short-term picture, but both $3,268 on the downside and $3,439 on the upside remain pivotal levels for the next decisive move.
For a look at all of today’s economic events, check out our economic calendar.
Silver price gains marginally to near $38.00 amid caution ahead of meeting between US President Trump and Ukrainian President Zelenskiy.
The Fed is expected to cut interest rates in September.
Silver price wobbles near the 20-day EMA around $37.90.
Silver price (XAG/USD) edges higher to near $38.00 during the European trading session on Monday. The white metal attracts slight bids as the market sentiment is slightly cautious, with investors awaiting the meeting between United States (US) President Donald Trump and Ukrainian President Volodymyr Zelenskiy at the White House on Monday.
US Secretary of the State Marco Rubio has confirmed that a bunch of European and NATO members are joining Trump and Zelenskyy at the White House to discuss concessions proposed by Russian leader Vladimir Putin for ending war in Ukraine.
Signs of a truce between Russia and Ukraine would be unfavorable for safe-haven assets, such as Silver, which tends to perform strongly in heightened geopolitical tensions.
However, firm expectations that the Federal Reserve (Fed) will reduce interest rates in the September meeting continue to provide support to the Silver price. Lower interest rates by the Fed bode well for non-yielding assets, such as Silver.
According to the CME FedWatch tool, the probability of the Fed to cut interest rates in September is 82.6%. Traders have remained confident about Fed’s interest rate cuts in the policy meeting next month due to cooling labor market conditions.
Silver price gains marginally to near $38.10 on Monday. The white metal demonstrates a sharp contraction in volatility due to the Descending Triangle formation on a daily timeframe. The horizontal support of the above-mentioned chart pattern is plotted from the July 7 low around $36.16, while the downward-sloping border is placed from the July 23 high near $39.53.
The asset wobbles near the 20-day Exponential Moving Average (EMA), which trades around $37.90, suggesting a sideways trend
The 14-day Relative Strength Index (RSI) oscillates inside the 40.00-60.00 range, indicating indecisiveness among market participants.
Looking down, the June 24 low of $35.28 will act as key support for the major. On the upside, the July 23 high near $39.53 will be a critical hurdle for the pair.