The main tag of Gold Price Articles.
You can use the search box below to find what you need.
[wd_asp id=1]
The main tag of Gold Price Articles.
You can use the search box below to find what you need.
[wd_asp id=1]
Today’s weakness follows last Friday’s failed attempt to push higher, where resistance was met at a long-term anchored volume weighted average price (AVWAP) with a peak at $2.97. That test aligned closely with additional resistance near $3.00, and the 20-Day moving average, now at $2.99, which represents dynamic resistance in the broader downtrend. Any rallies from current levels are expected to face headwinds in this $2.97–$2.99 zone, keeping bears in control.
The breakdown has opened the path to lower targets, with $2.63 as the first level of interest. This comes from a smaller descending ABCD pattern, where symmetry between the AB and CD legs projects a 100% match at $2.63.
Beyond $2.63, attention shifts to a lower confluence zone between $2.54 and $2.51. Multiple technical factors point toward this region, strengthening its significance as a potential magnet for price. It includes a 78.6% Fibonacci retracement at $2.54 and aligns with a larger ABCD pattern, measured from this year’s peak, that projects a 78.6% downside target also at $2.54. Combined, these overlapping levels define a high-probability area where natural gas may eventually seek support if the bearish correction continues.
With today’s continuation signal and sellers maintaining control, natural gas remains biased lower. Until the 20-Day average is reclaimed, momentum favors additional downside toward $2.63 initially, and potentially into the $2.54–$2.51 support band.
For a look at all of today’s economic events, check out our economic calendar.
Spot Gold came under selling pressure during American trading hours, easing towards the $3,320 area. The bright metal retreated as the US Dollar (USD) gathered momentum amid fresh optimism about a resolution of the Russian Ukraine war. On Monday, United States (US) President Donald Trump met with the Kyiv leader, Volodymyr Zelenskyy, and different European authorities to discuss the conditions for a peace agreement.
After the meeting, Trump reported progress and said he would help Ukraine get secure conditions for a peace deal, but excluded the country from joining the North Atlantic Treaty Organization (NATO). He also stated the next meeting should be between Zelenskyy and Russian President Vladimir Putin.
Later, Trump offered an interview to FOX News, in which he added that he hopes Putin “will be good,” and if he’s not, it will become a “rough situation.”
Other than that, investors kept an eye on Canadian inflation data. Canada’s headline Consumer Price Index (CPI) recorded an annual 1.7% increase in July, down from the 1.9% posted in June and matching estimates, according to Statistics Canada. The Bank of Canada (BoC) core annual CPI printed at 2.6% for the year to July, slightly below the previous 2.7%.
Market players are now waiting for the Federal Open Market Committee (FOMC) meeting Minutes scheduled for Wednesday, and the Jackson Hole Symposium taking place this week. Policymakers’ words are closely watched for potential hints on upcoming monetary policy decisions.
The XAU/USD pair trades near an intraday low of $3,320.98, and technical readings in the daily chart show that a mildly bearish 20 Simple Moving Average (SMA) keeps offering dynamic resistance, currently at around $3,348.00. At the same time, a bullish 100 SMA is losing its bullish strength at around $3,309.00, providing support. Finally, technical indicators diverge, as the Momentum indicator aims north above its midline, while the Relative Strength Index (RSI) indicator gains downward traction at around 45.
In the near term, and according to the 4-hour chart, the XAU/USD pair is bearish. The 20 SMA accelerated south below converging 100 and 200 SMAs, with the shorter, in line with increased selling interest. At the same time, technical indicators head south within negative levels, in line with lower lows ahead.
Support levels: 3,320.00 3,309.00 3,295.80
Resistance levels: 3,339.20 3,348.00 3,372.30
Weather remains a primary driver, and the latest models are providing little support. According to NatGasWeather, a strong upper ridge remains in control through Tuesday with highs ranging from the upper 80s to 100s across much of the country. However, the forecast turns cooler midweek, especially across the Midwest, Northeast, and Ohio Valley, with highs dropping to the 60s and 70s.
The 8–15 day outlook trends even cooler, showing the dominant ridge weakening and retreating into the southern U.S. That’s keeping national cooling degree days (CDDs) near or slightly below normal—hardly the setup for a late-summer demand surge.
The EIA reported a 56 Bcf injection into storage for the week ending August 8, bringing total inventories to 3,186 Bcf. That’s 79 Bcf below last year’s levels but still 196 Bcf above the five-year average. Regional builds were broad-based, with the East and Midwest adding 21 Bcf each.
Even with stockpiles running slightly behind last year, current levels remain well within the five-year range, muting any urgency for supply-side concerns. Traders are viewing the steady pace of injections—and the likelihood of continued moderate weather—as evidence that end-of-season storage targets can be met without price pressure.
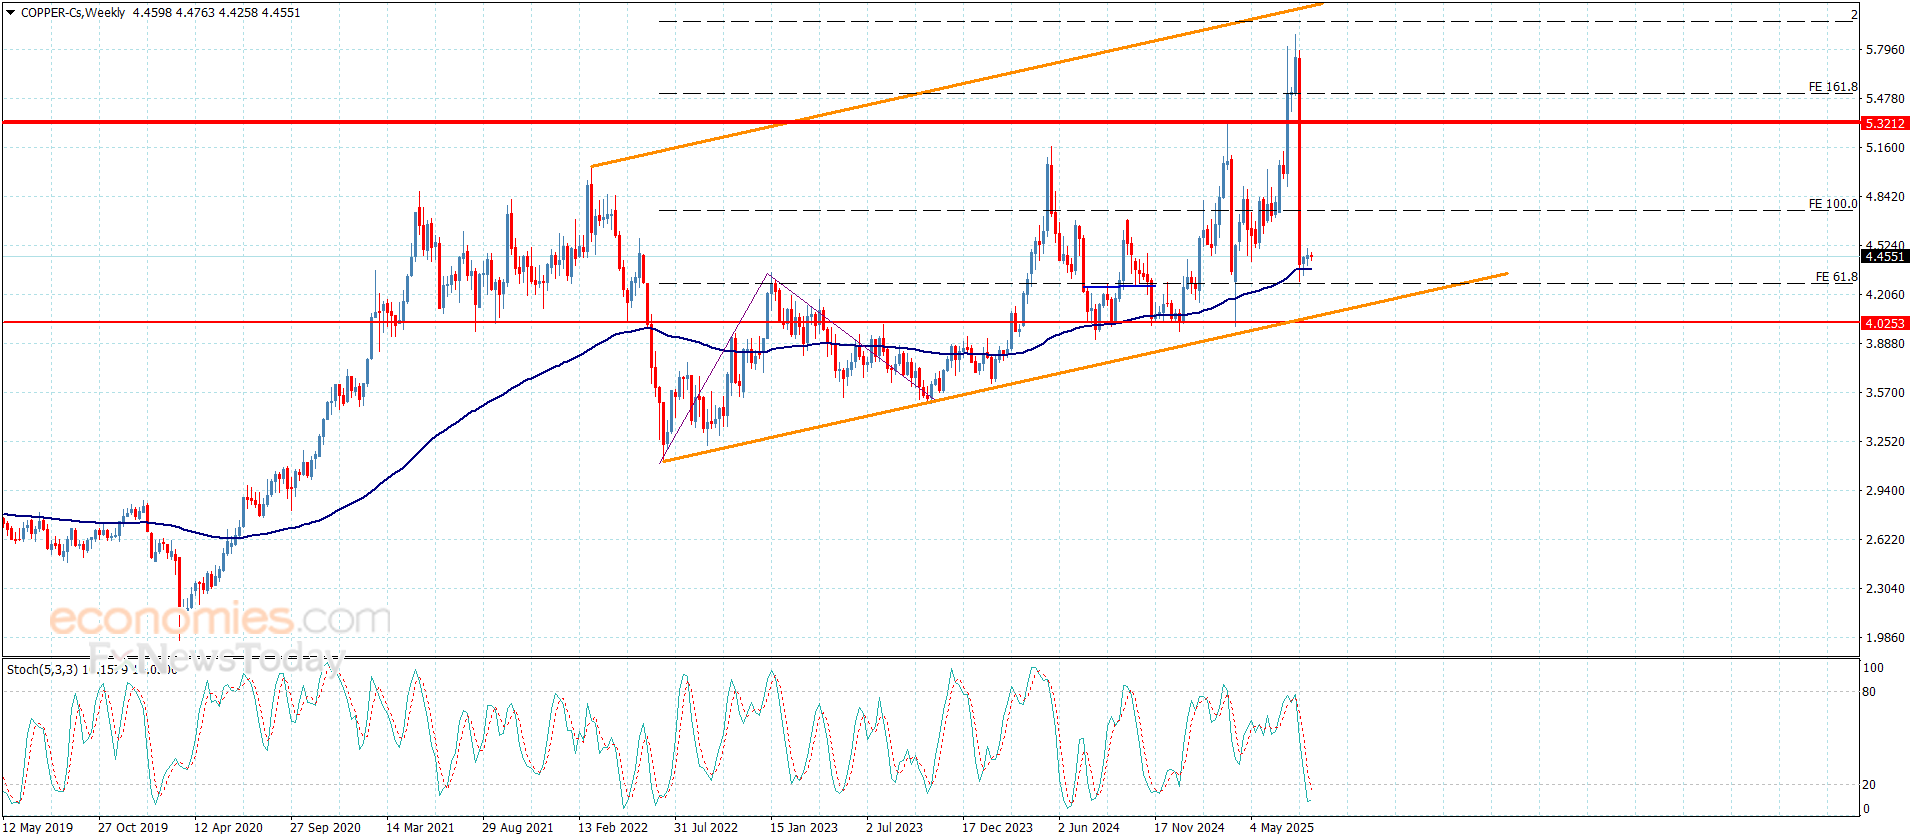
Copper price didn’t move anything, to keep providing slow sideways trading by its fluctuation near $4.4500, affected by the continuation of the main indicators’ contradiction, due to the stability of stochastic within the oversold level, to reduce the chances for renewing the suggested bullish attempts.
The stability above the extra support at $4.2600 assists to confirm the price confinement within the bullish track, to keep waiting for gathering the required positive momentum for reaching the positive stations near $4.6200 and $4.7400.
The expected trading range for today is between $4.330 and $4.6300
Trend forecast: Bullish
Copper price didn’t move anything, to keep providing slow sideways trading by its fluctuation near $4.4500, affected by the continuation of the main indicators’ contradiction, due to the stability of stochastic within the oversold level, to reduce the chances for renewing the suggested bullish attempts.
The stability above the extra support at $4.2600 assists to confirm the price confinement within the bullish track, to keep waiting for gathering the required positive momentum for reaching the positive stations near $4.6200 and $4.7400.
The expected trading range for today is between $4.330 and $4.6300
Trend forecast: Bullish
The $37.51 support zone aligns closely with an uptrend line and the 50-Day moving average, currently at $37.33. This convergence provides a key lower boundary for the bull trend. A breakdown below $37.51 could trigger weakness, but the 50-Day line is likely to act as significant dynamic support if tested, limiting downside momentum. Notably, silver successfully tested this moving average as support across three consecutive sessions recently, reinforcing its importance.
On the upside, resistance remains clearly defined at the $38.74 swing high. That level completed a 78.6% Fibonacci retracement of the most recent short-term advance, and so far, has ended attempts at recovering that level. Until silver can close decisively above $38.74, upward momentum remains limited, leaving the consolidation pattern intact. Traders will be watching closely to see which side of the $37.33–$38.74 band is resolved first.
The broader technical backdrop also carries weight. Silver continues to trade within a large ascending parallel channel that has guided price swings since early 2024. The upper boundary of that channel, which capped rallies in October and again earlier this year, when price briefly broke above the top line before falling back, remains an important marker of potential resistance. Historically, once a reversal occurs from one boundary of the channel, momentum often swings toward the opposite side.
While this remains only a possibility, it highlights the potential for downside pressure should silver fail to hold the 50-Day moving average. A sustained close below $37.33 would increase the likelihood of a deeper retracement within the channel. Until then, traders face a waiting game, as silver remains trapped between Fibonacci resistance above and moving average support below.
For a look at all of today’s economic events, check out our economic calendar.
Despite the stability of the EURJPY pair within the bullish channel’s levels and its fluctuation above the extra support at 172.00, but we notice forming sideways fluctuation by its stability near 172.35 due to stochastic exit from the overbought level and providing negative momentum, to contradict with the suggested bullish scenario.
The stability of the price above the extra support will make it renew the bullish attempts, to target 173.20 and 173.55 level, while the decline below the support will force it to activate the bearish correctional track again, waiting for attacking 170.40 level, which represents the line of confirming the expected trend on the medium period trading.
The expected trading range for today is between 172.00 and 173.55
Trend forecast: Bullish
The short-term picture highlights the 20-Day moving average as a critical resistance line, now sitting near $3.02. A decisive move above today’s $2.92 high would be encouraging, but the real short-term test remains Friday’s $2.97 peak. That level coincided with an anchored VWAP (AVWAP) measured from the long-term 2024 bottom – a line that previously provided support on two occasions during bearish corrections the past year. Its breakdown last week and subsequent test as resistance signals a shift in market control back to sellers. For now, the AVWAP at $2.96 and the declining 20-Day average create a tight overhead resistance zone.
Reclaiming the 20-Day line is essential for bulls to regain momentum, and even then, natural gas would quickly confront another key barrier at the lower swing high of $3.15. A sustained rally above this zone would signal a potential bullish reversal. Until then, the broader structure still leans bearish, with rallies facing headwinds from declining averages and confirmed resistance zones.
On the downside, a drop below Monday’s $2.80 low would indicate fresh weakness, but a confirmed continuation only unfolds if the $2.76 support gives way on a daily close. Should that occur, attention turns to Fibonacci-based targets tied to an extended ABCD pattern from the March peak. The large ABCD projects a 78.6% extension aligning near $2.51, which also matches a 78.6% retracement and a 127.2% target from a smaller ABCD formation. This confluence strengthens the case for $2.51 as the next major bearish objective if support fails.
For a look at all of today’s economic events, check out our economic calendar.
A firmer US Dollar (USD) puts pressure on Gold prices at the beginning of the week. The XAU/USD pair approaches $3,330 early in the American session, down from an intraday peak of $3,358.45. Political uncertainty undermines the mood on Monday, with investors looking at developments around the Russia-Ukraine war.
On Friday, United States (US) President Donald Trump met with Russian leader Vladimir Putin to discuss a potential ceasefire between Moscow and Kyiv. The meeting ended without an agreement, although Trump shared on social media over the weekend that the war could end if Ukrainian President Volodymyr Zelenskyy decides not to go into the North Atlantic Treaty Organization (NATO).
Trump and Zelenskyy are having a meeting later today in Washington, with the focus on a more sustainable peace agreement and not just a ceasefire.
Other than that, investors have little to worry about in the upcoming days. The Federal Open Market Committee (FOMC) will release the Minutes of the latest Federal Reserve (Fed) meeting on Wednesday, and may provide market players with some fresh clues on monetary policy. Additionally, the Kansas Fed will host its annual Jackson Hole meeting by the end of the week, with speeches from central banks’ leaders taking centre stage.
From a technical point of view, the daily chart for the XAU/USD pair shows it’s trading little changed on a daily basis, although the intraday range is wider than that of Friday. At the same time, a directionless 20 Simple Moving Average (SMA) provides dynamic resistance at around $3,352, while the longer moving averages maintain their bullish slopes below the current level. The 100 SMA, in fact, acts as support at around $3,307.10. Finally, technical indicators turned modestly lower within neutral territory, suggesting sellers hold the grip but falling short of anticipating another leg lower.
The 4-hour chart shows that XAU/USD aims to retest an early low at $3,323.60, with an increased bearish potential. The pair is currently trading below all its moving averages, which converge in a tight range in the $3,348 price zone. At the same time, technical indicators develop below their midlines with neutral-to-bearish slopes, in line with lower lows ahead.
Support levels: 3,323.60 3,307.10 3,295.80
Resistance levels: 3,352.00 3,372.30 3,389.85
The GBPJPY pair failed to resume the bearish correctional attack, affected by forming an obstacle at 66.8%Fibonacci correction level at 198.80, forcing it to provide mixed trading by its stability near 199.90.
Note that regaining bullish bias will be by breaching the resistance at 200.65, while holding below it and stochastic attempt to exit the overbought level confirms the dominance of the sideways bias in the current period, to expect the trading confinement between the mentioned main levels, to keep monitoring the price behavior to confirm the trend by surpassing these levels.
The expected trading range for today is between 198.85 and 200.60
Trend forecast: Sideways