The main tag of Gold Price Articles.
You can use the search box below to find what you need.
[wd_asp id=1]
The main tag of Gold Price Articles.
You can use the search box below to find what you need.
[wd_asp id=1]
Gold price is consolidating the previous recovery gains while remaining below $3,400 early Thursday. Traders refrain from placing fresh bets on Gold price amid a likely Russia-Ukraine geopolitical escalation and some optimism on the trade front.
In Thursday’s trading so far, Gold price is struggling for a fresh upside boost amid renewed hopes of a likely trade deal between the US and Canada, EU-US and optimism over a potential call between US President Donald Trump and his Chinese counterpart Xi Jinping on Friday.
The fresh enthusiasm on the trade front seems to be helping the US Dollar (USD) attempt a tepid bounce following Wednesday’s steep decline.
However, the downside in the traditional safe-haven Gold price remains cushioned by simmering geopolitical tensions between Russia and Ukraine.
Ukraine launched a surprise attack using smuggled drones to strike Russian airbases on 1 June, targeting what it said were nuclear-capable long-range bombers.
Responding to Ukraine’s aggression, Russian President Vladimir Putin said that he doubted over any possibility of a ceasefire after these latest attacks.
Speaking after a phone call with the Russian president, Trump said: “President Putin did say, and very strongly, that he will have to respond to the recent attack on the airfields.”
If Russia responds strongly, we could see a re-escalation of the Ukraine conflict, with intense flight to safety propelling Gold price.
Meanwhile, traders will keep a close eye on the speeches from several Federal Reserve (Fed) policymakers and the US Jobless Claims data, especially after the latest weak economic data.
Data published by ADP showed on Wednesday that the US private sector payrolls increased just 37,000 for the month, below the downwardly revised 60,000 in April and the forecast for 115,000.
The US May ISM Services PMI unexpectedly contracted to 49.9, following April’s 51.6 and 52 expected.
Disappointing US economic data revived dovish Fed expectations, boosting the non-yielding Gold price at the expense of the USD.
The near-term technical outlook for Gold price remains more or less the same.
Gold buyers remain hopeful so long as the confluence of the 21-day Simple Moving Average (SMA) and the 38.2% Fibonacci Retracement (Fibo) level of the April record rally at $3,297 is held.
The 14-day Relative Strength Index (RSI) is sitting comfortably above the midline, adding credence to the bullish potential.
Gold buyers must find acceptance above the 23.6% Fibo resistance at $3,377 on a daily candlestick closing basis to resume the recent upswing toward the lifetime highs of $3,500.
Ahead of that, the May high of $3,439 must be taken out.
Alternatively, sellers could attempt control on a break below the falling trendline resistance-turned-support, now at $3,322.
The next support is seen at the abovementioned powerful confluence of $3,297.
Further south, sellers will target support near $3,240, where the 50% Fibo level and the 50-day SMA hang around.
Gold has played a key role in human’s history as it has been widely used as a store of value and medium of exchange. Currently, apart from its shine and usage for jewelry, the precious metal is widely seen as a safe-haven asset, meaning that it is considered a good investment during turbulent times. Gold is also widely seen as a hedge against inflation and against depreciating currencies as it doesn’t rely on any specific issuer or government.
Central banks are the biggest Gold holders. In their aim to support their currencies in turbulent times, central banks tend to diversify their reserves and buy Gold to improve the perceived strength of the economy and the currency. High Gold reserves can be a source of trust for a country’s solvency. Central banks added 1,136 tonnes of Gold worth around $70 billion to their reserves in 2022, according to data from the World Gold Council. This is the highest yearly purchase since records began. Central banks from emerging economies such as China, India and Turkey are quickly increasing their Gold reserves.
Gold has an inverse correlation with the US Dollar and US Treasuries, which are both major reserve and safe-haven assets. When the Dollar depreciates, Gold tends to rise, enabling investors and central banks to diversify their assets in turbulent times. Gold is also inversely correlated with risk assets. A rally in the stock market tends to weaken Gold price, while sell-offs in riskier markets tend to favor the precious metal.
The price can move due to a wide range of factors. Geopolitical instability or fears of a deep recession can quickly make Gold price escalate due to its safe-haven status. As a yield-less asset, Gold tends to rise with lower interest rates, while higher cost of money usually weighs down on the yellow metal. Still, most moves depend on how the US Dollar (USD) behaves as the asset is priced in dollars (XAU/USD). A strong Dollar tends to keep the price of Gold controlled, whereas a weaker Dollar is likely to push Gold prices up.
Notice that there has been only one day since the April bottom that natural gas closed above the neckline, indicating a potential bullish breakout. The current and second test of the neckline may have greater success. Nonetheless, the recent swing high at $3.84 (B) is a key pivot that needs to be reclaimed before higher targets are valid.
At the time of this writing, the high of the day was $3.73 and the low $3.66. Notice that support for today and yesterday was found around two lines. There is a dashed line that marks the halfway point of a rising trend channel (green) and an AVWAP support line (light blue) begun from the trend high in March.
A successful test of support around those lines the past two days is a sign of strength as the lines previously represented dynamic resistance. It is also interesting to note that the weekly 20-period moving average has been converging recently with the AVWAP. Currently, they each mark a similar support level.
A rise above today’s high will trigger a breakout of an inside day, while an advance above yesterday’s high of $3.76 provides a stronger bullish signal. If momentum is retained that should lead to a breakout above the $3.84 swing high and trigger a continuation of a rising ABCD pattern. An initial target from that pattern is at $4.08. But it is joined by the 61.8% Fibonacci retracement at $4.12. They should be looked at as a potential resistance area.
For a look at all of today’s economic events, check out our economic calendar.
Silver price consolidated during Wednesday’s session, trading almost flat near $34.50, as traders seem reluctant to push the metal’s prices outside of the $34.00-$34.50 range.
Technically, Silver remains bullish-biased, though buyers are taking a breather after Monday’s over 5% gain, which pushed XAG/USD from around $33.00 to $34.50, the most significant gain since October 18, 2024, when Silver gained 6.40%.
As Silver makes higher highs and higher lows and has broken the previous two peaks seen near $34.51, the grey metal seems poised to challenge the $35.00 figure. A decisive break could send XAG/USD to challenge 13-year highs at $37.49, the February 29, 2012, daily high.
Conversely, a daily close of XAG/USD below the March 28 peak of $34.58 would likely result in a decline towards $34.00. In the event of further weakness, the next support level would be the May 22 peak, which has since turned into support at $33.69.
Silver is a precious metal highly traded among investors. It has been historically used as a store of value and a medium of exchange. Although less popular than Gold, traders may turn to Silver to diversify their investment portfolio, for its intrinsic value or as a potential hedge during high-inflation periods. Investors can buy physical Silver, in coins or in bars, or trade it through vehicles such as Exchange Traded Funds, which track its price on international markets.
Silver prices can move due to a wide range of factors. Geopolitical instability or fears of a deep recession can make Silver price escalate due to its safe-haven status, although to a lesser extent than Gold’s. As a yieldless asset, Silver tends to rise with lower interest rates. Its moves also depend on how the US Dollar (USD) behaves as the asset is priced in dollars (XAG/USD). A strong Dollar tends to keep the price of Silver at bay, whereas a weaker Dollar is likely to propel prices up. Other factors such as investment demand, mining supply – Silver is much more abundant than Gold – and recycling rates can also affect prices.
Silver is widely used in industry, particularly in sectors such as electronics or solar energy, as it has one of the highest electric conductivity of all metals – more than Copper and Gold. A surge in demand can increase prices, while a decline tends to lower them. Dynamics in the US, Chinese and Indian economies can also contribute to price swings: for the US and particularly China, their big industrial sectors use Silver in various processes; in India, consumers’ demand for the precious metal for jewellery also plays a key role in setting prices.
Silver prices tend to follow Gold’s moves. When Gold prices rise, Silver typically follows suit, as their status as safe-haven assets is similar. The Gold/Silver ratio, which shows the number of ounces of Silver needed to equal the value of one ounce of Gold, may help to determine the relative valuation between both metals. Some investors may consider a high ratio as an indicator that Silver is undervalued, or Gold is overvalued. On the contrary, a low ratio might suggest that Gold is undervalued relative to Silver.
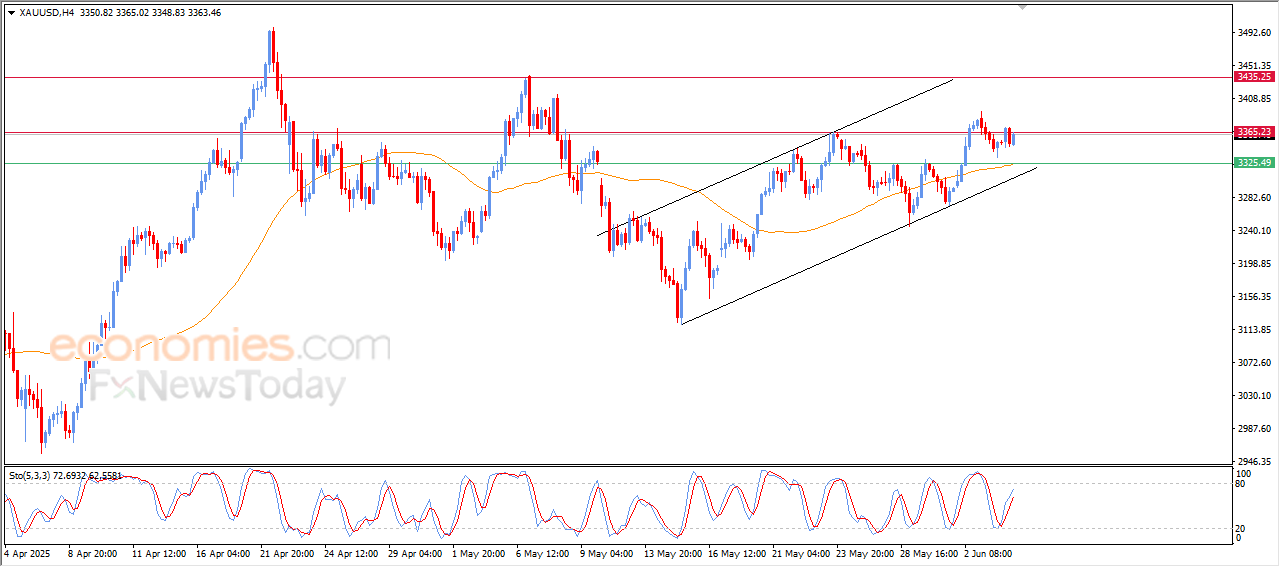
Spot Gold resumed its advance on Wednesday, although XAU/USD trades below the weekly high set at $3,392.22. The bright metal hovers around $3,370, helped by a fresh round of US Dollar (USD) selling after the release of discouraging United States (US) data.
On the one hand, the country reported that the private sector added measly 37K new job positions in May, according to the ADP Employment Change report. Additionally, the ISM Services Purchasing Managers’ Index (PMI) contracted to 49.9 in the same month, down from the 51.6 posted in April and below the 52 anticipated.
The USD came under modest selling pressure with the news, as speculative interest awaits first-tier releases scheduled for the upcoming days. The European Central Bank (ECB) will announce its decision on monetary policy on Thursday, while the US will publish the May Nonfarm Payrolls (NFP) report on Friday.
In the meantime, US President Donald Trump and his Chinese counterpart, Xi Jinping, engaged in another round of mutual accusations. Trump claimed that his Xi Jinping was “extremely hard” to make a deal with, while Beijing’s Foreign Minister Wang Yi called on the US to “meet China halfway.” A hinted call within the next few days between the two leaders partially cooled concerns, which, anyway, keep the mood contained. At the time being, US indexes are marginally up, suggesting market participants are holding on to modest hopes.
The daily chart for the XAU/USD pair shows it keeps consolidating recent gains, and that the risk skews to the upside. It keeps developing above a flat 20 Simple Moving Average (SMA) currently at around $3,293.30. The Momentum indicator eases from its intraday peak but holds well above its midline, while the Relative Strength Index (RSI) indicator consolidates at around 57. Finally, XAU/USD remains far above bullish 100 and 200 SMAs, which reflect the dominant bullish trend regardless of the ongoing consolidation.
The 4-hour chart favors a bullish extension, although the momentum is missing. Technical indicators hold within positive levels, but with uneven strength. At the same time, a bullish 20 SMA keeps providing intraday support while advancing beyond flat 100 and 200 SMAs.
In the near term, and according to the 4-hour chart, XAU/USD maintains its positive bias. The pair bounced from a mildly bullish 20 SMA, which advances beyond directionless 100 and 200 SMAs. Finally, technical indicators eased from their recent peaks, but consolidate within positive levels, far from suggesting a steeper decline.
Support levels: 3,361.20 3,346.55 3,333.10
Resistance levels: 3,382.60 3,394.05 3,408.45
Natural gas prices haven’t moved anything since yesterday’s trading, to repeat forming sideways trading near $3.710, reinforcing the chances for renewing the negative attempts that depend on the stability of the resistance at $3.87.
We recommend waiting for breaking the initial support at $3.600, reinforcing the chances for forming strong bearish waves, to target $3.450 and $3.320 level, while breaching the resistance and holding above it will confirm its move to the bullish track by its rally to $3.960 initially.
The expected trading range for today is between $3.550 and $3.800
Trend forecast: Bearish
Platinum price remains affected by the contradiction between the main indicators, which forces it to delay the negative attack by its repeated fluctuation above the extra support at $950.00, achieving some gains by reaching $973.00.
Reminding you that the stability of the price below $983.00 level, will increase the chances for renewing the negative trading in the current trading, to keep waiting for attacking the support at $950.00, while surpassing the barrier will cancel the negative suggestion, to open the way towards activating the bullish rally, which might target $1000.00 level initially.
The expected trading range for today is between $950.00 and $983.00
Trend forecast: Fluctuated within the bearish track
The EURJPY pair ended yesterday’s trading positively, due to its repeated stability above 163.35 level, attacking the initial barrier near 163.85, which represents one of the keys to regain the bullish bias in the near and medium period trading.
The price needs a new positive momentum, assisting to reinforce the chances for forming more of the bullish waves, to begin targeting bullish stations by its rally towards 164.85 and 165.35, while the price return to fluctuate below 163.35 will force it to activate the bearish correctional track before reaching any on the suggested positive stations.
The expected trading range for today is between 163.50 and 164.85
Trend forecast: Bullish
“The market’s focus has shifted from inflation fear to growth fragility,” noted Thomas Bucher, strategist at DWS. “That’s supportive for metals with defensive characteristics like gold.”
The latest JOLTS data showed 7.39 million job openings in April, beating the 7.34 million estimate. While this suggests labor market resilience, falling bond yields and a softer dollar indicate traders remain focused on Fed easing.
Fed officials remain divided. Atlanta Fed’s Raphael Bostic argued for caution, while Chicago’s Austan Goolsbee cited delayed inflation effects from tariffs. Governor Lisa Cook raised concerns over stagflation, warning that persistent trade disruptions could hinder growth while driving up prices.
These diverging viewpoints have injected uncertainty into markets, limiting directional conviction in gold or silver.
Upcoming economic indicators, including Wednesday’s ADP private payrolls and the ISM Services PMI, are likely to impact short-term demand for the dollar and shape the momentum of precious metals.
However, Friday’s Nonfarm Payrolls (NFP) report remains the decisive catalyst. A strong reading may delay easing expectations, while a miss could fast-track rate cuts, supporting further gains in gold and silver.
The EURJPY pair ended yesterday’s trading positively, due to its repeated stability above 163.35 level, attacking the initial barrier near 163.85, which represents one of the keys to regain the bullish bias in the near and medium period trading.
The price needs a new positive momentum, assisting to reinforce the chances for forming more of the bullish waves, to begin targeting bullish stations by its rally towards 164.85 and 165.35, while the price return to fluctuate below 163.35 will force it to activate the bearish correctional track before reaching any on the suggested positive stations.
The expected trading range for today is between 163.50 and 164.85
Trend forecast: Bullish
Silver (XAG/USD) struggles to capitalize on the overnight bounce from sub-$34.00 levels and oscillates in a narrow trading band during the Asian session on Wednesday. The white metal currently hovers around the $34.50 area, nearly unchanged for the day, though it remains close to the year-to-date peak (YTD) touched on Monday.
From a technical perspective, this week’s breakout through the $33.80 barrier, or the top boundary of a multi-week-old range, was seen as a key trigger for bullish traders. Moreover, oscillators on the daily chart are holding comfortably in positive territory and are still away from being in the overbought zone. This, in turn, suggests that the path of least resistance for the XAG/USD is to the upside and backs the case for a further near-term appreciating move.
Some follow-through buying beyond the $34.8-$34.90 region, or the YTD top and a twelve-year high touched in October 2024, will reaffirm the constructive outlook and pave the way for additional gains. The XAG/USD might then accelerate the momentum towards the next relevant hurdle near the $35.66 area, or March 2012 swing high, before aiming to reclaim the $36.00 mark for the first time since February 2012.
On the flip side, corrective slides below the $34.00 mark could be seen as a buying opportunity and remain limited near the aforementioned trading range resistance breakpoint, around the $33.65 region. A sustained break below the latter, however, could drag the XAG/USD to the $33.00 round figure. This is followed by the $32.75-$32.70 strong horizontal support, which if broken decisively might shift the near-term bias in favor of bearish traders.
Silver is a precious metal highly traded among investors. It has been historically used as a store of value and a medium of exchange. Although less popular than Gold, traders may turn to Silver to diversify their investment portfolio, for its intrinsic value or as a potential hedge during high-inflation periods. Investors can buy physical Silver, in coins or in bars, or trade it through vehicles such as Exchange Traded Funds, which track its price on international markets.
Silver prices can move due to a wide range of factors. Geopolitical instability or fears of a deep recession can make Silver price escalate due to its safe-haven status, although to a lesser extent than Gold’s. As a yieldless asset, Silver tends to rise with lower interest rates. Its moves also depend on how the US Dollar (USD) behaves as the asset is priced in dollars (XAG/USD). A strong Dollar tends to keep the price of Silver at bay, whereas a weaker Dollar is likely to propel prices up. Other factors such as investment demand, mining supply – Silver is much more abundant than Gold – and recycling rates can also affect prices.
Silver is widely used in industry, particularly in sectors such as electronics or solar energy, as it has one of the highest electric conductivity of all metals – more than Copper and Gold. A surge in demand can increase prices, while a decline tends to lower them. Dynamics in the US, Chinese and Indian economies can also contribute to price swings: for the US and particularly China, their big industrial sectors use Silver in various processes; in India, consumers’ demand for the precious metal for jewellery also plays a key role in setting prices.
Silver prices tend to follow Gold’s moves. When Gold prices rise, Silver typically follows suit, as their status as safe-haven assets is similar. The Gold/Silver ratio, which shows the number of ounces of Silver needed to equal the value of one ounce of Gold, may help to determine the relative valuation between both metals. Some investors may consider a high ratio as an indicator that Silver is undervalued, or Gold is overvalued. On the contrary, a low ratio might suggest that Gold is undervalued relative to Silver.