The main tag of Gold Price Articles.
You can use the search box below to find what you need.
[wd_asp id=1]
The main tag of Gold Price Articles.
You can use the search box below to find what you need.
[wd_asp id=1]
Silver (XAG/USD) struggles to capitalize on the overnight bounce from sub-$34.00 levels and oscillates in a narrow trading band during the Asian session on Wednesday. The white metal currently hovers around the $34.50 area, nearly unchanged for the day, though it remains close to the year-to-date peak (YTD) touched on Monday.
From a technical perspective, this week’s breakout through the $33.80 barrier, or the top boundary of a multi-week-old range, was seen as a key trigger for bullish traders. Moreover, oscillators on the daily chart are holding comfortably in positive territory and are still away from being in the overbought zone. This, in turn, suggests that the path of least resistance for the XAG/USD is to the upside and backs the case for a further near-term appreciating move.
Some follow-through buying beyond the $34.8-$34.90 region, or the YTD top and a twelve-year high touched in October 2024, will reaffirm the constructive outlook and pave the way for additional gains. The XAG/USD might then accelerate the momentum towards the next relevant hurdle near the $35.66 area, or March 2012 swing high, before aiming to reclaim the $36.00 mark for the first time since February 2012.
On the flip side, corrective slides below the $34.00 mark could be seen as a buying opportunity and remain limited near the aforementioned trading range resistance breakpoint, around the $33.65 region. A sustained break below the latter, however, could drag the XAG/USD to the $33.00 round figure. This is followed by the $32.75-$32.70 strong horizontal support, which if broken decisively might shift the near-term bias in favor of bearish traders.
Silver is a precious metal highly traded among investors. It has been historically used as a store of value and a medium of exchange. Although less popular than Gold, traders may turn to Silver to diversify their investment portfolio, for its intrinsic value or as a potential hedge during high-inflation periods. Investors can buy physical Silver, in coins or in bars, or trade it through vehicles such as Exchange Traded Funds, which track its price on international markets.
Silver prices can move due to a wide range of factors. Geopolitical instability or fears of a deep recession can make Silver price escalate due to its safe-haven status, although to a lesser extent than Gold’s. As a yieldless asset, Silver tends to rise with lower interest rates. Its moves also depend on how the US Dollar (USD) behaves as the asset is priced in dollars (XAG/USD). A strong Dollar tends to keep the price of Silver at bay, whereas a weaker Dollar is likely to propel prices up. Other factors such as investment demand, mining supply – Silver is much more abundant than Gold – and recycling rates can also affect prices.
Silver is widely used in industry, particularly in sectors such as electronics or solar energy, as it has one of the highest electric conductivity of all metals – more than Copper and Gold. A surge in demand can increase prices, while a decline tends to lower them. Dynamics in the US, Chinese and Indian economies can also contribute to price swings: for the US and particularly China, their big industrial sectors use Silver in various processes; in India, consumers’ demand for the precious metal for jewellery also plays a key role in setting prices.
Silver prices tend to follow Gold’s moves. When Gold prices rise, Silver typically follows suit, as their status as safe-haven assets is similar. The Gold/Silver ratio, which shows the number of ounces of Silver needed to equal the value of one ounce of Gold, may help to determine the relative valuation between both metals. Some investors may consider a high ratio as an indicator that Silver is undervalued, or Gold is overvalued. On the contrary, a low ratio might suggest that Gold is undervalued relative to Silver.
Gold price is staging a tepid turnaround above $3,350 in Asian trading on Wednesday. Gold buyers keenly await the high-impact US data releases and speeches from Federal Reserve (Fed) policymakers for a sustained move higher.
Having retreated from the monthly high of $3,392 on Tuesday, Gold price is recovering some ground amid a renewed selling wave around the US Dollar (USD) as trade concerns return to the fore.
The Trump administration’s deadline for its trading partners to submit their best offers on trade looms this Wednesday while a doubling of levies to 50% on imported steel and aluminium will take effect at 4 GMT.
Additionally, markets remain wary of the likely talks between US President Donald Trump and his Chinese counterpart Xi Jinping on Friday, especially after US Federal Bureau of Investigation (FBI) Director Kash Patel confirmed via a post on X the arrest of two Chinese nationals charged for smuggling potential bioterror fungus into the US.
Last week, both sides accused each other of violating the terms of an agreement in May to lower some tariffs.
The USD-denominated bright metal could receive a brief boost as the Greenback sees a fresh leg down on US steel and aluminium tariffs coming into effect.
Attention will then turn toward the top-tier US ADP Employment Change and ISM Services PMI data due later in the American session for fresh signs on the health of the US economy. This could provide hints on the Fed’s next policy move and direction on the USD.
On Tuesday, the US Dollar found some respite from stronger-than-expected JOLTS Job Openings, which are closely watched by the Fed.
The number of job openings on the last business day of April stood at 7.39 million, following 7.2 million openings recorded in March. The market expectation was for 7.1 million.
The short-term technical outlook remains constructive so long as the confluence of the 21-day Simple Moving Average (SMA) and the 38.2% Fibonacci Retracement (Fibo) level of the April record rally at $3,297 is held.
The 14-day Relative Strength Index (RSI) is pointing north while comfortably above the midline, justifying the renewed upside.
Gold buyers must scale the 23.6% Fibo resistance at $3,377 on a daily candlestick closing basis to resume the recent upswing toward the lifetime highs of $3,500.
Ahead of that, the May high of $3,439 must be taken out.
Gold price stormed through the falling trendline resistance, then at $3,346, to finish Monday at $3,382.
Alternatively, sellers could attempt control on a break below the falling trendline resistance-turned-support, now at $3,325.
The next support is seen at the abovementioned powerful confluence of $3,297.
The last line of defense for buyers is aligned near $3,240, where the 50% Fibo level and the 50-day SMA hang around.
The ADP Employment Change is a gauge of employment in the private sector released by the largest payroll processor in the US, Automatic Data Processing Inc. It measures the change in the number of people privately employed in the US. Generally speaking, a rise in the indicator has positive implications for consumer spending and is stimulative of economic growth. So a high reading is traditionally seen as bullish for the US Dollar (USD), while a low reading is seen as bearish.
Next release:
Wed Jun 04, 2025 12:15
Frequency:
Monthly
Consensus:
115K
Previous:
62K
Source:
ADP Research Institute
The next key upside pivot level is the prior lower swing high at $3.84 (B). A decisive rally above that higher level will trigger the continuation of a rising ABCD pattern with an initial upside target around $4.08. That price level can be considered as the beginning of a price range up the 61.8% Fibonacci retracement at $4.12.
Given recent signs of strength, it looks like there is a good chance the breakout may trigger. Notice that the prior three days found support around the 20-Day MA (purple). A breakout above the 50-Day MA was confirmed yesterday with a daily close above the line. Once reclaimed both the 20-Day and 50-Day lines are potential support and will likely be used by traders as an area to enter or add in anticipation of rising prices.
In addition, support last week was also confirmed by a 50% retracement level and an AVWAP (light blue) support level anchored from the April swing low. Notice that previously, the AVWAP line represented an area of resistance from May 15 to May 27. Again, once a prior resistance line is successfully tested as support the stage is set for the trend to move higher.
The 20-Day and 50-Day lines have been converging, with the faster 20-Day line targeting a rise above the 50-Day soon. That would provide another bullish sign in support of a strengthening trend. If the parameters of the rising trend channel are retained, there is the potential for resistance to be seen near the top line of the channel. The timing could coincide with the approach to the $4.08 target zone. There are three hits of the top channel line thereby confirming the line. If a third hit leads to a bearish reversal the bottom of the channel becomes a potential target.
For a look at all of today’s economic events, check out our economic calendar.
Silver (XAG/USD) price trimmed some of its Monday’s 5% gains, edging down 0.52% on Tuesday, with the grey metal trading near the $34.50 area, stuck to the highs of the current week. Upbeat economic data in the United States (US) pushed XAG/USD under $34.00, but buyers emerged and lifted the non-yielding metal.
Silver price maintains its bullish bias despite retreating somewhat during the session and remains above the October 29 swing high of $34.54, which is seen as the first support level. The Relative Strength Index (RSI) indicates that buyers are in control; however, they need to overcome the next key resistance level, which is seen at $35.00. Once cleared, Silver would be poised to test the February 29, 2012, high of $37.49.
Conversely, a daily close of XAG/USD below the March 28 peak of $34.59 would likely result in a decline towards $34.00. In the event of further weakness, the next support level would be the May 22 peak, which has since turned into support at $33.69.
Silver is a precious metal highly traded among investors. It has been historically used as a store of value and a medium of exchange. Although less popular than Gold, traders may turn to Silver to diversify their investment portfolio, for its intrinsic value or as a potential hedge during high-inflation periods. Investors can buy physical Silver, in coins or in bars, or trade it through vehicles such as Exchange Traded Funds, which track its price on international markets.
Silver prices can move due to a wide range of factors. Geopolitical instability or fears of a deep recession can make Silver price escalate due to its safe-haven status, although to a lesser extent than Gold’s. As a yieldless asset, Silver tends to rise with lower interest rates. Its moves also depend on how the US Dollar (USD) behaves as the asset is priced in dollars (XAG/USD). A strong Dollar tends to keep the price of Silver at bay, whereas a weaker Dollar is likely to propel prices up. Other factors such as investment demand, mining supply – Silver is much more abundant than Gold – and recycling rates can also affect prices.
Silver is widely used in industry, particularly in sectors such as electronics or solar energy, as it has one of the highest electric conductivity of all metals – more than Copper and Gold. A surge in demand can increase prices, while a decline tends to lower them. Dynamics in the US, Chinese and Indian economies can also contribute to price swings: for the US and particularly China, their big industrial sectors use Silver in various processes; in India, consumers’ demand for the precious metal for jewellery also plays a key role in setting prices.
Silver prices tend to follow Gold’s moves. When Gold prices rise, Silver typically follows suit, as their status as safe-haven assets is similar. The Gold/Silver ratio, which shows the number of ounces of Silver needed to equal the value of one ounce of Gold, may help to determine the relative valuation between both metals. Some investors may consider a high ratio as an indicator that Silver is undervalued, or Gold is overvalued. On the contrary, a low ratio might suggest that Gold is undervalued relative to Silver.
Gold price hovers around $3,350 a troy ounce, down on Tuesday as the US Dollar (USD) managed to recover some of the ground shed on Monday. Speculative interest flipped into riskier assets, with US indexes up by the time of writing, reverting from a pre-opening dip.
United States (US) data was mixed, as Factory Orders fell by 3.7% MoM in April, much worse than the 3.4% advance posted in March or the -3% anticipated by market analysts. At the same time, the number of job openings on the last business day of April stood at 7.39 million, according to the Job Openings and Labor Turnover Survey (JOLTS) report. The figure surpassed the 7.2 million openings recorded in March and exceeded the market expectation of 7.1 million.
Also, the Eurozone (EU) reported that Harmonized Index of Consumer Prices (HICP) rose by 1.9% year-on-year (YoY) in May, below the European Central Bank’s (ECB) 2% target. The core annual figure printed at 2.3%, easing from the 2.7% posted in April and below the 2.5% anticipated by market players. The figures lifted the mood ahead of the European Central Bank (ECB) monetary policy decision on Thursday.
Meanwhile, global trade tensions remain the same. The latest from US President Donald Trump was doubling tariffs on aluminium and steel imports into the country to 50%, starting Wednesday. An update on the matter can come later today.
From a technical point of view, XAU/USD seems to be consolidating gains and with the risk still poised to the upside. In the daily chart, the bright metal holds above all its moving averages, with a flat 20 Simple Moving Average (SMA) offering support around $3,292.80, while the 100 and 200 SMAs keep grinding north far below the shorter one. Technical indicators, in the meantime, remain within positive levels, although with uneven directional strength.
In the near term, and according to the 4-hour chart, XAU/USD maintains its positive bias. The pair bounced from a mildly bullish 20 SMA, which advances beyond directionless 100 and 200 SMAs. Finally, technical indicators eased from their recent peaks, but consolidate within positive levels, far from suggesting a steeper decline.
Support levels: 3,333.10 3,316.65 3,292.80
Resistance levels: 3,367.75 3,374.90 3,394.05
The GBPJPY pair formed more of the slow bearish waves, confirming their surrender to the suggested bearish scenario, by moving away from the barrier at 194.55 level, to repeat the pressure on the intraday obstacle at 192.90.
The continuation of providing negative momentum by stochastic will assist in forming an extra decline to target 192.35 level, reaching the main support at 191.70, while breaching the mentioned barrier will cancel the negative suggestion, to provide the price a chance to renew the bullish attempts by its rally towards 195.20 initially.
The expected trading range for today is between 192.35 and 194.20
Trend forecast: Bearish
Silver prices (XAG/USD) are trading lower on Tuesday’s European session, weighed by a somewhat firmer US Dollar, as the risk-off mood witnessed on Monday seems to have eased.
The precious metal hit fresh six-month highs on Monday, with the US Dollar hammered by renewed tariff concerns and downbeat US data. The US Manufacturing PMI confirmed the negative impact of tariffs on factory activity and pushed the US Dollar to fresh multi-month lows.
From a wider perspective, price action remains positive. The reversal from $34.75 has been contained at the 34.00 round level, above the previous resistance, now a potential support area, at $33.70.
On the upside, the area between $34.75 and $35.00 contains several resistance levels (October 23 and June 4 highs), and the 161.8% Fibonacci extension of the Mid may rally, and might be a tough nut to crack.
Above here, a late 2012 peak lies at $35.40. The 261.8% Fiboinnacci retracement is at $37.00.
On the downside, immediate support is at the mentioned $33.70 and then at the $32.65-$32.75 zone.
.
(This story was corrected on June 3 at 08:43 GMT to say that the 261.8% Fiboinnacci retracement is at $37.00, not the 2611.8% retracement.)
Silver is a precious metal highly traded among investors. It has been historically used as a store of value and a medium of exchange. Although less popular than Gold, traders may turn to Silver to diversify their investment portfolio, for its intrinsic value or as a potential hedge during high-inflation periods. Investors can buy physical Silver, in coins or in bars, or trade it through vehicles such as Exchange Traded Funds, which track its price on international markets.
Silver prices can move due to a wide range of factors. Geopolitical instability or fears of a deep recession can make Silver price escalate due to its safe-haven status, although to a lesser extent than Gold’s. As a yieldless asset, Silver tends to rise with lower interest rates. Its moves also depend on how the US Dollar (USD) behaves as the asset is priced in dollars (XAG/USD). A strong Dollar tends to keep the price of Silver at bay, whereas a weaker Dollar is likely to propel prices up. Other factors such as investment demand, mining supply – Silver is much more abundant than Gold – and recycling rates can also affect prices.
Silver is widely used in industry, particularly in sectors such as electronics or solar energy, as it has one of the highest electric conductivity of all metals – more than Copper and Gold. A surge in demand can increase prices, while a decline tends to lower them. Dynamics in the US, Chinese and Indian economies can also contribute to price swings: for the US and particularly China, their big industrial sectors use Silver in various processes; in India, consumers’ demand for the precious metal for jewellery also plays a key role in setting prices.
Silver prices tend to follow Gold’s moves. When Gold prices rise, Silver typically follows suit, as their status as safe-haven assets is similar. The Gold/Silver ratio, which shows the number of ounces of Silver needed to equal the value of one ounce of Gold, may help to determine the relative valuation between both metals. Some investors may consider a high ratio as an indicator that Silver is undervalued, or Gold is overvalued. On the contrary, a low ratio might suggest that Gold is undervalued relative to Silver.
Despite the pullback, gold’s downside was limited. “Persistent concerns about trade disruptions and expectations of Federal Reserve rate cuts have helped stabilize gold prices,” said a commodities strategist at a Hong Kong-based brokerage.
Silver (XAG/USD) traded at $34.79 per ounce, reflecting modest losses as the precious metal followed gold’s trajectory. The dip comes amid an uptick in risk sentiment, as investors rotated into equities. However, expectations of Fed easing and sustained global uncertainties have kept silver’s downside in check.
Market expectations lean toward the Federal Reserve delivering at least two rate cuts in 2025, a view bolstered by recent comments from Fed officials. Traders now await key US economic releases, including the JOLTS Job Openings report and Friday’s Nonfarm Payrolls (NFP) data, which could influence both the dollar and precious metals.
“While stronger-than-expected US jobs data may lift the dollar in the near term, the overarching narrative of a dovish Fed remains supportive for gold and silver,” noted an analyst at a Singapore-based investment firm.
With geopolitical tensions and trade uncertainties persisting, the broader market sentiment remains favorably inclined towards safe-haven assets, positioning gold and silver as key beneficiaries in a volatile global environment.
Gold consolidates near $3,360, eyeing a breakout above $3,365. Silver holds support at $34.41; a push above $34.79 could target $35.50. Key levels hint at swift moves.
Natural gas price took advantage of stochastic attempt to provide positive momentum, to notice surpassing $3.600 level, recording some of the gains by reaching $3.750, but the repeated stability below the barrier at $3.870 represents a main barrier against regaining the bullish bias, to expect forming mixed trading, and there is chance for the decline again below $3.600 level and targeting the negative stations near $3.450 and $3.320.
While facing new bullish pressure and breaching the mentioned barrier will confirm its readiness to form strong bullish waves, to expect achieving several gains by its rally towards $3.950 and $4.150.
The expected trading range for today is between $3.550 and 3.800
Trend forecast: Bearish
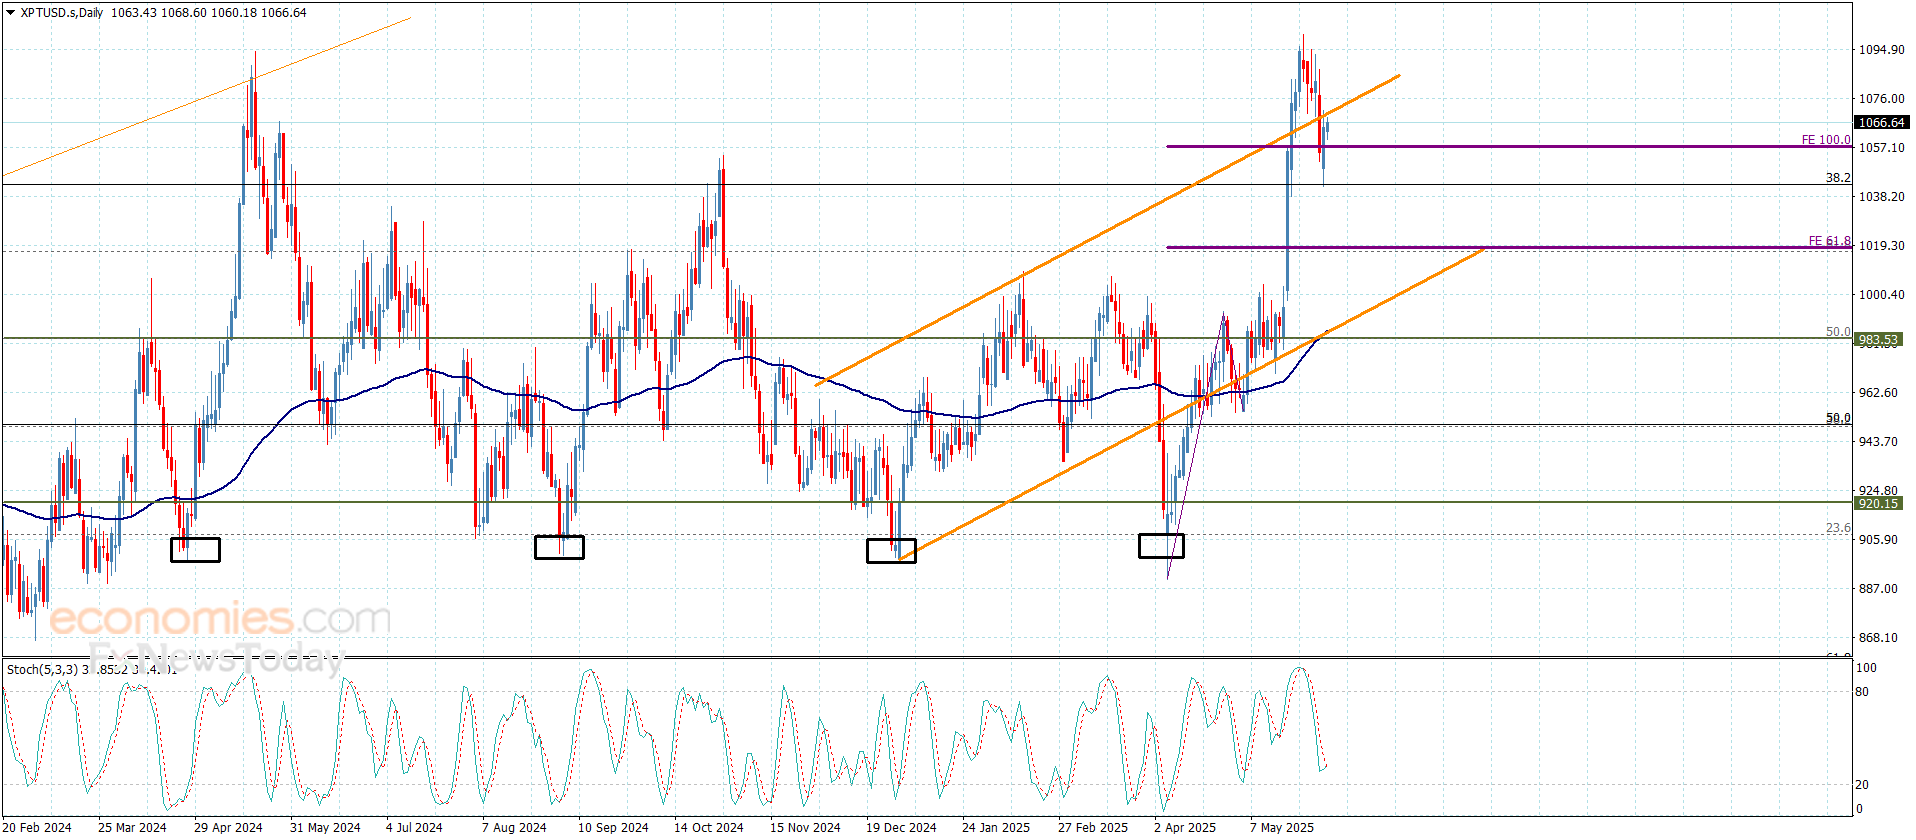
Platinum price took advantage of the repeated stability above the extra support at $1042.00, to notice forming some bullish trading and recording the initial target by hitting $1071.00.
Reminding you that confirming breaching $1070.00 level that represents the extension of the bullish channel’s resistance is important, to confirm its move to a new bullish station that allows it to press on the barrier at $1100.00, while the failure of the breach will force the price to provide mixed trading, and there is chance for renewing the pressure on the support at $1042.00.
The expected trading range for today is between $1052.00 and $1080.00
Trend forecast: Bullish