The main tag of Gold Price Articles.
You can use the search box below to find what you need.
[wd_asp id=1]
The main tag of Gold Price Articles.
You can use the search box below to find what you need.
[wd_asp id=1]
The Gold price (XAU/USD) rebounds to around $3,310 during the early Asian trading hours on Monday. Ongoing tariff uncertainty and persistent geopolitical tensions boost demand for safe-haven assets like gold. Investors will keep an eye on the US May ISM Manufacturing Purchasing Managers’ Index (PMI) report, which is due later on Monday.
The precious metal drifts higher amid renewed tensions between the United States (US) and China. US President Donald Trump claimed on Friday that China had violated their trade agreement. This, in turn, has fueled uncertainty in global markets and provided some support to the Gold price.
However, US Treasury Secretary Scott Bessent said on Sunday that Trump and Chinese President Xi Jinping are likely to speak soon to iron out trade issues, including a dispute over critical minerals. Any positive developments surrounding the US-China trade talks might cap the upside for the yellow metal.
Additionally, the escalating geopolitical tensions in the Middle East underpin the yellow metal. The BBC reported early Monday that Ukraine said it completed its biggest long-range attack of the war with Russia on Sunday, following the use of smuggled drones to launch a series of major strikes on 40 Russian warplanes at four military bases.
A softer US inflation report keeps hopes for a rate cut alive. The US Personal Consumption Expenditures (PCE) Price Index rose 2.1% year on year in April, compared to 2.3% in March, the US Bureau of Economic Analysis showed on Friday. This figure came in below the 2.2% forecast.
Gold has played a key role in human’s history as it has been widely used as a store of value and medium of exchange. Currently, apart from its shine and usage for jewelry, the precious metal is widely seen as a safe-haven asset, meaning that it is considered a good investment during turbulent times. Gold is also widely seen as a hedge against inflation and against depreciating currencies as it doesn’t rely on any specific issuer or government.
Central banks are the biggest Gold holders. In their aim to support their currencies in turbulent times, central banks tend to diversify their reserves and buy Gold to improve the perceived strength of the economy and the currency. High Gold reserves can be a source of trust for a country’s solvency. Central banks added 1,136 tonnes of Gold worth around $70 billion to their reserves in 2022, according to data from the World Gold Council. This is the highest yearly purchase since records began. Central banks from emerging economies such as China, India and Turkey are quickly increasing their Gold reserves.
Gold has an inverse correlation with the US Dollar and US Treasuries, which are both major reserve and safe-haven assets. When the Dollar depreciates, Gold tends to rise, enabling investors and central banks to diversify their assets in turbulent times. Gold is also inversely correlated with risk assets. A rally in the stock market tends to weaken Gold price, while sell-offs in riskier markets tend to favor the precious metal.
The price can move due to a wide range of factors. Geopolitical instability or fears of a deep recession can quickly make Gold price escalate due to its safe-haven status. As a yield-less asset, Gold tends to rise with lower interest rates, while higher cost of money usually weighs down on the yellow metal. Still, most moves depend on how the US Dollar (USD) behaves as the asset is priced in dollars (XAU/USD). A strong Dollar tends to keep the price of Gold controlled, whereas a weaker Dollar is likely to push Gold prices up.
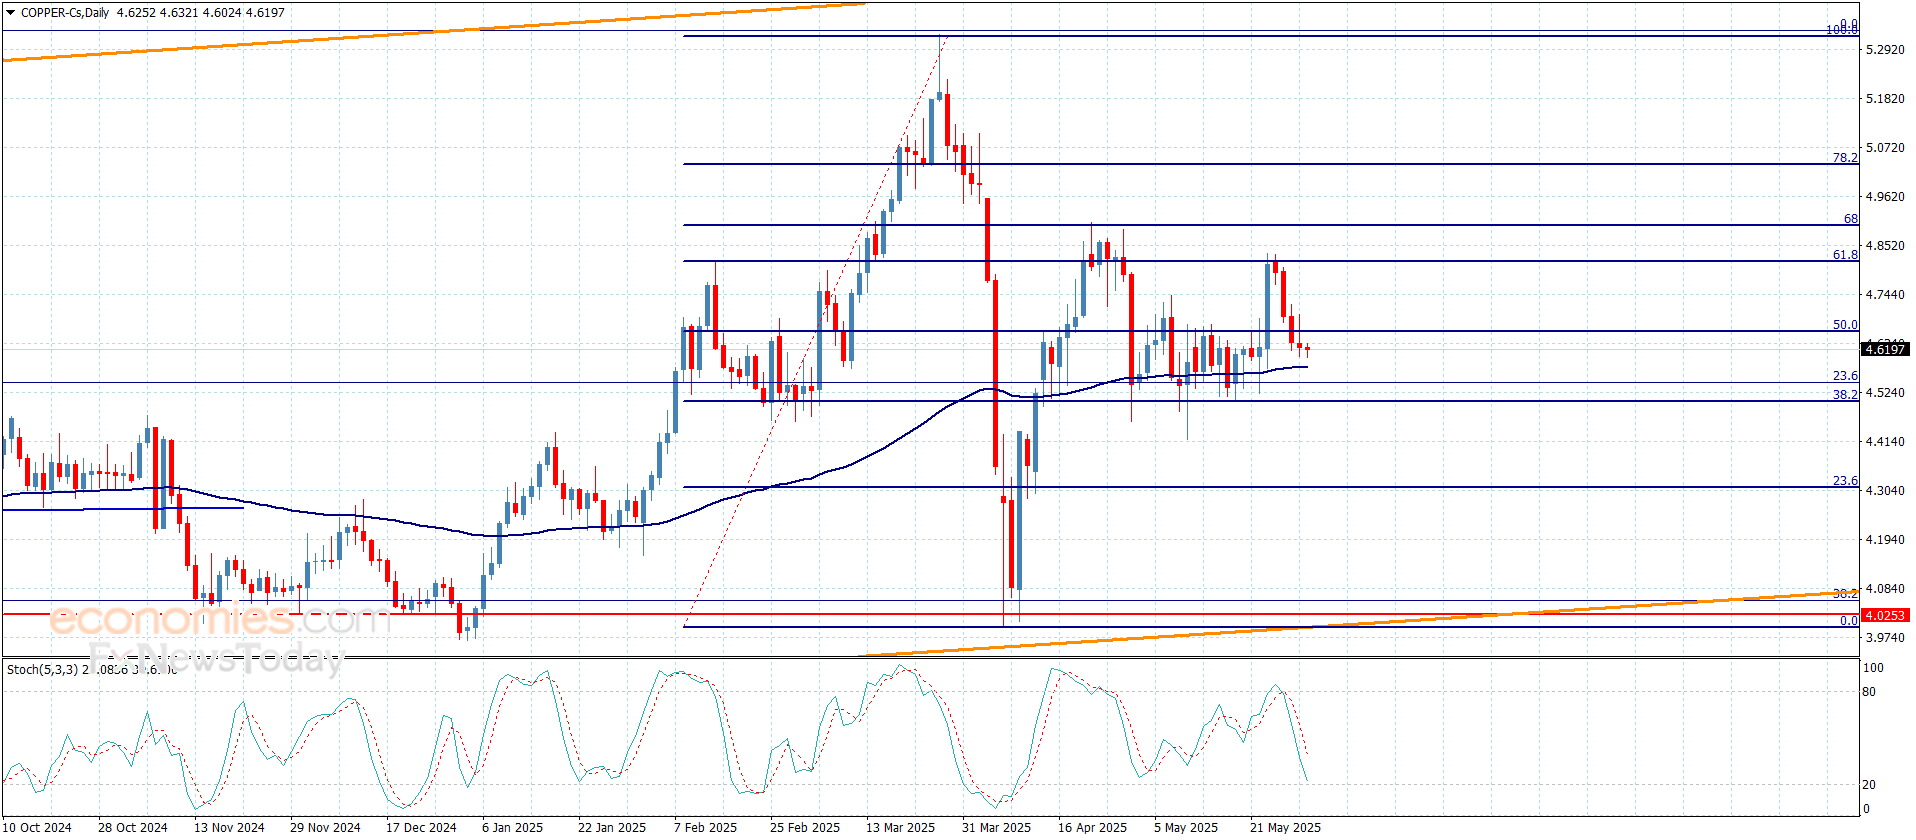
No change on copper price’s current negativity by its repeated fluctuation below 50%Fibonacci correction level at $4.6600, besides the continuation of suffering negative pressure by stochastic approach from 20 level, therefore, we will keep preferring the negative trading in the near period, which might target $4.5500 reaching the support at $4.4900.
Note that regaining the bullish bias is conditioned by forming a strong bullish rally, to succeed to breach 61.8%Fibonacci correction level at $4.8100.
The expected trading range for today is between $4.5000 and $4.6600
Trend forecast: Bearish
Silver price turned negative on Friday during the North American session, poised to end the week with losses of over 1.80% as the dollar staged a recovery during the day. XAG/USD trades at $32.87, down 1.29%.
Silver price trade subdued but formed a ‘bearish harami’ candle chart pattern with bearish implications. Momentum appears to be shifting in favor of sellers, as the Relative Strength Index (RSI) has reached a lower trough at RSI’s neutral line, which, if cleared, could signal that the grey metal is poised for a leg lower.
If XAG/USD remains below $33.00, the next support to breach would be a May 29 swing low of $32.70. In that outcome, the next test would be the 50-day Simple Moving Average (SMA) at $32.68, followed by a test of the 100-day SMA at $32.11 and the 200-day SMA at $31.40.
However, buyers stepping in and cleared $33.00 look for a leg up towards $33.69, which could pave the way for a challenge of $34. On further strength, XAG/USD’s next resistance level would be the March 26 high at $34.58, followed by $35.00.
Silver is a precious metal highly traded among investors. It has been historically used as a store of value and a medium of exchange. Although less popular than Gold, traders may turn to Silver to diversify their investment portfolio, for its intrinsic value or as a potential hedge during high-inflation periods. Investors can buy physical Silver, in coins or in bars, or trade it through vehicles such as Exchange Traded Funds, which track its price on international markets.
Silver prices can move due to a wide range of factors. Geopolitical instability or fears of a deep recession can make Silver price escalate due to its safe-haven status, although to a lesser extent than Gold’s. As a yieldless asset, Silver tends to rise with lower interest rates. Its moves also depend on how the US Dollar (USD) behaves as the asset is priced in dollars (XAG/USD). A strong Dollar tends to keep the price of Silver at bay, whereas a weaker Dollar is likely to propel prices up. Other factors such as investment demand, mining supply – Silver is much more abundant than Gold – and recycling rates can also affect prices.
Silver is widely used in industry, particularly in sectors such as electronics or solar energy, as it has one of the highest electric conductivity of all metals – more than Copper and Gold. A surge in demand can increase prices, while a decline tends to lower them. Dynamics in the US, Chinese and Indian economies can also contribute to price swings: for the US and particularly China, their big industrial sectors use Silver in various processes; in India, consumers’ demand for the precious metal for jewellery also plays a key role in setting prices.
Silver prices tend to follow Gold’s moves. When Gold prices rise, Silver typically follows suit, as their status as safe-haven assets is similar. The Gold/Silver ratio, which shows the number of ounces of Silver needed to equal the value of one ounce of Gold, may help to determine the relative valuation between both metals. Some investors may consider a high ratio as an indicator that Silver is undervalued, or Gold is overvalued. On the contrary, a low ratio might suggest that Gold is undervalued relative to Silver.
The 200-day MA at $3.537 has now shifted from support to resistance, reinforcing bearish sentiment in the short term. While recapturing this technical level would indicate that selling pressure is easing, there’s no clear sign that buyers are actively defending it. Thursday’s close at $3.52 and Friday’s failure to rebound confirm that the market remains technically fragile, with sellers willing to press on if near-term support fails.
Weather remains a headwind for bulls. Updated forecasts from NatGasWeather and Commodity Weather Group show cooling across the central and eastern U.S. through early June. Highs in the 60s to 70s and widespread thunderstorms will limit early summer cooling demand, especially in key markets like Texas. The West remains hot, but it’s not enough to lift national demand, which is expected to stay light for at least the next seven days.
Thursday’s EIA report confirmed a +101 Bcf injection for the week ended May 23, matching consensus but exceeding the five-year average of +98 Bcf. Storage now sits at 2,476 Bcf—93 Bcf above the five-year average and 316 Bcf below last year’s level. Dry gas production hit 106.2 Bcf/day (+3.7% y/y), while demand reached 69.0 Bcf/day (+4.2% y/y). LNG exports rose slightly, but total electricity output declined 4.4% y/y, highlighting weak power burn demand for gas.
LNG flows to U.S. export terminals reached 14.4 Bcf/day, up 2.4% week-over-week, providing modest support. But global signals aren’t encouraging either. European gas storage was just 47% full as of May 26, well below the 58% five-year seasonal average. This suggests limited short-term uplift from overseas demand, keeping the U.S. market heavily reliant on domestic consumption and weather shifts.
With technical momentum pointing lower and bearish catalysts stacking up—from subdued weather-driven demand to healthy storage builds—natural gas prices are likely to face continued downside pressure. Unless bulls reclaim the 200-day MA and weather patterns shift hotter, traders should brace for a retest of $3.381 and potentially deeper lows.
More Information in our Economic Calendar.
Important DisclaimersThe content provided on the website includes general news and publications, our personal analysis and opinions, and contents provided by third parties, which are intended for educational and research purposes only. It does not constitute, and should not be read as, any recommendation or advice to take any action whatsoever, including to make any investment or buy any product. When making any financial decision, you should perform your own due diligence checks, apply your own discretion and consult your competent advisors. The content of the website is not personally directed to you, and we does not take into account your financial situation or needs.The information contained in this website is not necessarily provided in real-time nor is it necessarily accurate. Prices provided herein may be provided by market makers and not by exchanges.Any trading or other financial decision you make shall be at your full responsibility, and you must not rely on any information provided through the website. FX Empire does not provide any warranty regarding any of the information contained in the website, and shall bear no responsibility for any trading losses you might incur as a result of using any information contained in the website.The website may include advertisements and other promotional contents, and FX Empire may receive compensation from third parties in connection with the content. FX Empire does not endorse any third party or recommends using any third party’s services, and does not assume responsibility for your use of any such third party’s website or services.FX Empire and its employees, officers, subsidiaries and associates, are not liable nor shall they be held liable for any loss or damage resulting from your use of the website or reliance on the information provided on this website.Risk DisclaimersThis website includes information about cryptocurrencies, contracts for difference (CFDs) and other financial instruments, and about brokers, exchanges and other entities trading in such instruments. Both cryptocurrencies and CFDs are complex instruments and come with a high risk of losing money. You should carefully consider whether you understand how these instruments work and whether you can afford to take the high risk of losing your money.FX Empire encourages you to perform your own research before making any investment decision, and to avoid investing in any financial instrument which you do not fully understand how it works and what are the risks involved.
Silver price (XAG/USD) is down almost 1% near the key level of $33.00 during North American trading house on Friday. However, the white metal strives to gain ground as renewed trade tensions between the United States (US) and China are limited the upside in the US Dollar (USD).
The US Dollar Index (DXY), which tracks the Greenback’s value against six major currencies, struggles to extend its early recovery move above the immediate resistance of 99.70.
Historically, global economic tensions improve demand for safe-haven assets, such as Silver. However, it is struggling to find bids as higher US Dollar makes investment in Silver price an expensive bet for investors.
During North American session, US President Donald Trump accused Beijing for non-compliance on the trade agreement in a post on Truth.Social. “The bad news is that China, perhaps not surprisingly to some, has totally violated its agreement with us,” Trump wrote.
Meanwhile, soft US Personal Consumption Expenditure Price Index (PCE) data for April has weighed some pressure on the Silver. The US core PCE inflation, a Federal Reserve’s (Fed) preferred inflation gauge, rose by 2.5% on year, as expected, slower than 2.7% in March. Precious metals underperform in a low-inflation environment.
Silver price ranges between $31.65 and $33.70 from over a month. The near-term trend of the white metal is uncertain as it wobbles around the 20-period Exponential Moving Average (EMA), which trades near $32.90.
The 14-period Relative Strength Index (RSI) oscillates inside the 40.00-60.00 range, indicating a sideways trend.
Looking up, the March 28 high of $34.60 will act as key resistance for the metal. On the downside, the April 11 low of $30.90 will be the key support zone.
Silver is a precious metal highly traded among investors. It has been historically used as a store of value and a medium of exchange. Although less popular than Gold, traders may turn to Silver to diversify their investment portfolio, for its intrinsic value or as a potential hedge during high-inflation periods. Investors can buy physical Silver, in coins or in bars, or trade it through vehicles such as Exchange Traded Funds, which track its price on international markets.
Silver prices can move due to a wide range of factors. Geopolitical instability or fears of a deep recession can make Silver price escalate due to its safe-haven status, although to a lesser extent than Gold’s. As a yieldless asset, Silver tends to rise with lower interest rates. Its moves also depend on how the US Dollar (USD) behaves as the asset is priced in dollars (XAG/USD). A strong Dollar tends to keep the price of Silver at bay, whereas a weaker Dollar is likely to propel prices up. Other factors such as investment demand, mining supply – Silver is much more abundant than Gold – and recycling rates can also affect prices.
Silver is widely used in industry, particularly in sectors such as electronics or solar energy, as it has one of the highest electric conductivity of all metals – more than Copper and Gold. A surge in demand can increase prices, while a decline tends to lower them. Dynamics in the US, Chinese and Indian economies can also contribute to price swings: for the US and particularly China, their big industrial sectors use Silver in various processes; in India, consumers’ demand for the precious metal for jewellery also plays a key role in setting prices.
Silver prices tend to follow Gold’s moves. When Gold prices rise, Silver typically follows suit, as their status as safe-haven assets is similar. The Gold/Silver ratio, which shows the number of ounces of Silver needed to equal the value of one ounce of Gold, may help to determine the relative valuation between both metals. Some investors may consider a high ratio as an indicator that Silver is undervalued, or Gold is overvalued. On the contrary, a low ratio might suggest that Gold is undervalued relative to Silver.
Natural gas price confirmed its surrender to the bearish correctional bias by reaching below the initial support at $3.600, to settle below the moving average 55, hitting the initial negative target by reaching $3.450.
The stability of stochastic near 20 level will increase the negative pressure on the trading, which assist to renew the negative attempts that might target levels near $3.320, while the price success to regain the bullish bias requires providing a positive close above the barrier near $3.850.
The expected trading range for today is between $3.320 and $3.600
Trend forecast: Bearish temporarily
No change on copper price’s current negativity by its repeated fluctuation below 50%Fibonacci correction level at $4.6600, besides the continuation of suffering negative pressure by stochastic approach from 20 level, therefore, we will keep preferring the negative trading in the near period, which might target $4.5500 reaching the support at $4.4900.
Note that regaining the bullish bias is conditioned by forming a strong bullish rally, to succeed to breach 61.8%Fibonacci correction level at $4.8100.
The expected trading range for today is between $4.5000 and $4.6600
Trend forecast: Bearish
Kremlin spokesperson Dmitry Peskov confirmed receiving Ukraine’s response to peace talks in Istanbul, while the White House announced a tentative ceasefire proposal from Israel, though its acceptance remains uncertain.
Market participants remained cautious ahead of Friday’s US Personal Consumption Expenditure (PCE) Price Index, the Federal Reserve’s preferred inflation gauge. A cooling in inflation could raise expectations for interest rate cuts, potentially weakening the dollar and lifting gold.
Conversely, stronger inflation data could reinforce a hawkish Fed stance, strengthening the dollar and capping gold’s upside. Federal Reserve minutes revealed a “wait-and-see” approach, with policymakers balancing risks to inflation and employment.
Chicago Fed President Austan Goolsbee and San Francisco Fed President Mary Daly suggested two potential rate cuts this year, contingent on continued disinflation and labor market resilience.
Dallas Fed President Lorie Logan emphasized balanced risks, while Fed Chair Jerome Powell reiterated that future rate moves hinge on incoming data.
Meanwhile, silver (XAG/USD) prices traded steadily near $33.20, supported by underlying geopolitical uncertainty and consolidation patterns. The market’s focus remains split between inflation data and global tensions, keeping silver’s technical levels in play.
The EURJPY pair kept positive stability, taking advantage of forming extra support at 163.35 level, to begin achieving some of the gains by its rally towards the initial target by hitting 164.20 level.
The positive factors are represented by the continuation of forming main support at 162.00 level, and providing positive momentum by the main indicators, so that confirms the continuation of the positivity, which might target 164.80 level, to attempt to breach the obstacle near 165.20, to reinforce the continuation of the positivity in the upcoming period.
The expected trading range for today is between 163.30 and 165.20
Trend forecast: Bullish