The main tag of Gold Price Articles.
You can use the search box below to find what you need.
[wd_asp id=1]
The main tag of Gold Price Articles.
You can use the search box below to find what you need.
[wd_asp id=1]
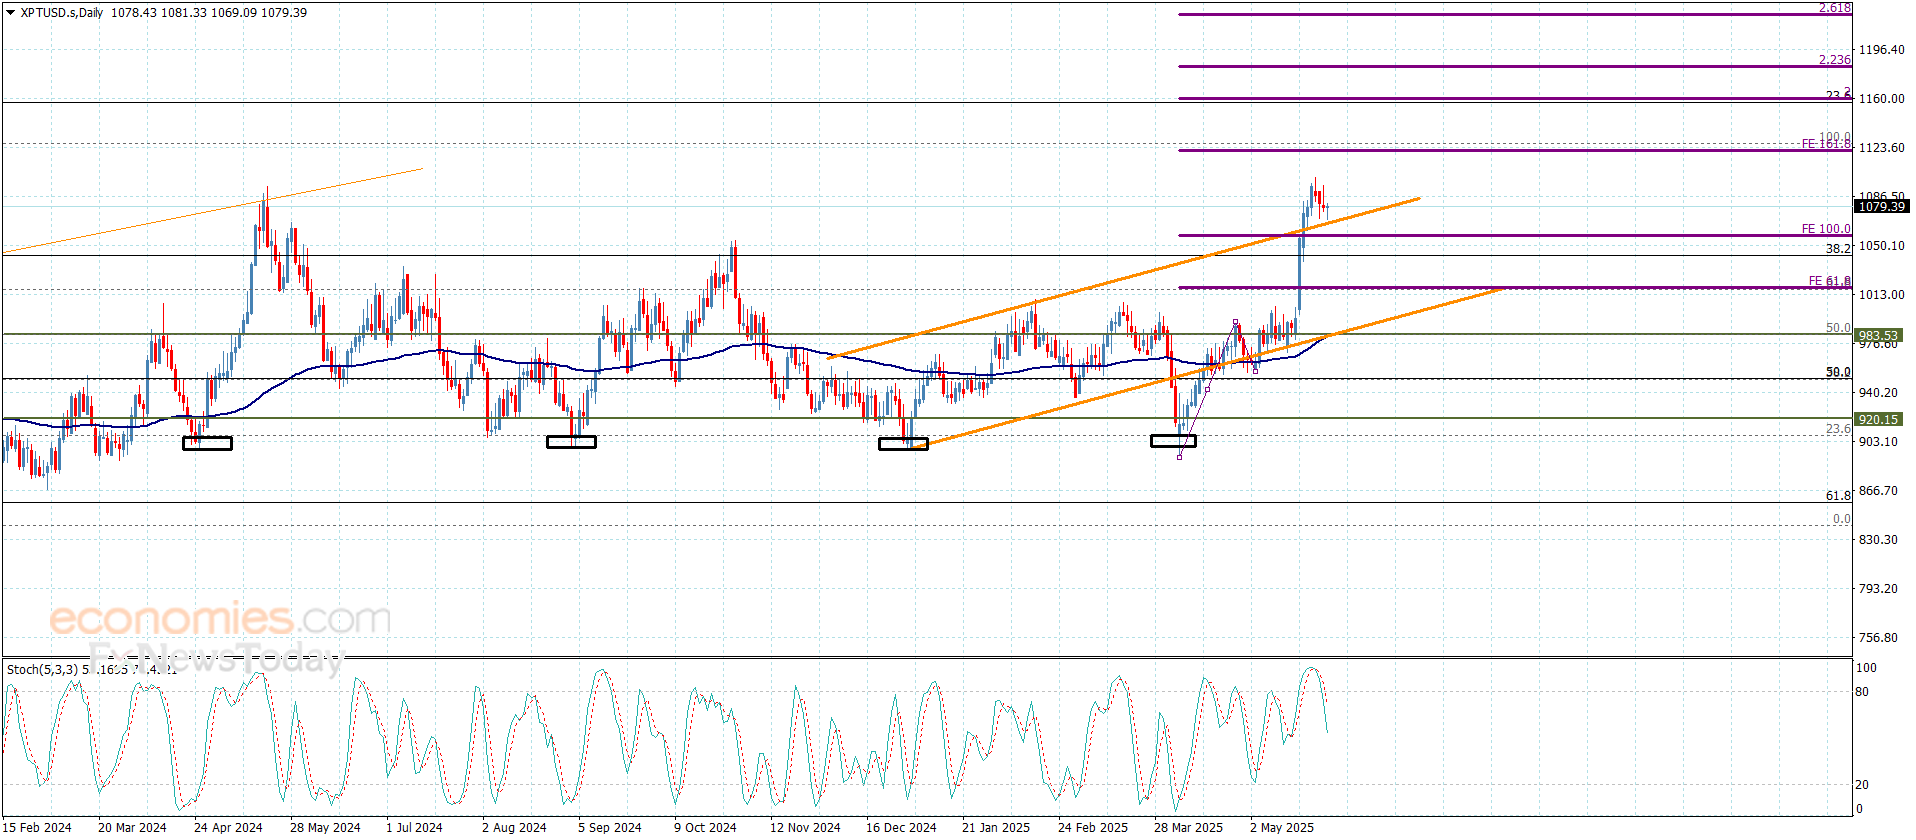
Platinum price continued to resist stochastic negativity by its continuous fluctuation above $1056.00 level, which represents an important support as appears in the above image, as it represents 100% Fibonacci extension, and its stability reinforces the chances of the bullish scenario domination again.
Gathering the positive momentum is important to lead the price begin forming bullish waves to surpass $1100.00 level, then begin achieving new gains by its rally to $1125.00 reaching $1158.00 in the medium period trading.
The expected trading range for today is between $1068.00 and $1100.00
Trend forecast: Bullish
The GBPAUD ended its bullish rally by recording the initial target at 2.1035, facing 161.8%Fibonacci extension level, to form an intraday barrier against the attempts of resuming the bullish attack, which explains the negative rebound to 2.0915.
Note that the attempt of forming extra support at 2.0780 level will reinforce the chances for gathering the required positive momentum, to surpass the mentioned barrier, then begin targeting new bullish stations by its rally towards 2.1085 and 2.1150.
The expected trading range for today is between 2.0865 and 2.1035
Trend forecast: Fluctuated
The EURJPY pair kept positive stability, taking advantage of forming extra support at 163.35 level, to begin achieving some of the gains by its rally towards the initial target by hitting 164.20 level.
The positive factors are represented by the continuation of forming main support at 162.00 level, and providing positive momentum by the main indicators, so that confirms the continuation of the positivity, which might target 164.80 level, to attempt to breach the obstacle near 165.20, to reinforce the continuation of the positivity in the upcoming period.
The expected trading range for today is between 163.30 and 165.20
Trend forecast: Bullish
The EURJPY pair kept positive stability, taking advantage of forming extra support at 163.35 level, to begin achieving some of the gains by its rally towards the initial target by hitting 164.20 level.
The positive factors are represented by the continuation of forming main support at 162.00 level, and providing positive momentum by the main indicators, so that confirms the continuation of the positivity, which might target 164.80 level, to attempt to breach the obstacle near 165.20, to reinforce the continuation of the positivity in the upcoming period.
The expected trading range for today is between 163.30 and 165.20
Trend forecast: Bullish
Copper price delayed the bullish rally due to the negative pressure that comes by a stochastic approach from 50 level, suffering some extra losses by hitting $4.6000 level, attempting to settle above the moving average 55.
The contradiction between the main indicators might force the price to provide sideways trading, but the repeated stability below 6.8%Fibonacci correction level at $4.8100 represents a main factor that confirms the bearish correctional bias dominance, to keep waiting for resuming the decline and targeting $4.5000 level in the near period.
The expected trading range for today is between $4.5000 and $4.7000
Trend forecast: Bearish
Do you need help in trading decisions? Do you want to learn how to start trading?
Join Economies.com VIP Club and benefit from over 15 years of market analysis expertise and get:
Special Offer: Subscribe to the Economies.com VIP channel and get also a free subscription to a trusted trading signals channel provided by Best Trading Signal.
Copper price delayed the bullish rally due to the negative pressure that comes by a stochastic approach from 50 level, suffering some extra losses by hitting $4.6000 level, attempting to settle above the moving average 55.
The contradiction between the main indicators might force the price to provide sideways trading, but the repeated stability below 6.8%Fibonacci correction level at $4.8100 represents a main factor that confirms the bearish correctional bias dominance, to keep waiting for resuming the decline and targeting $4.5000 level in the near period.
The expected trading range for today is between $4.5000 and $4.7000
Trend forecast: Bearish
Do you need help in trading decisions? Do you want to learn how to start trading?
Join Economies.com VIP Club and benefit from over 15 years of market analysis expertise and get:
Special Offer: Subscribe to the Economies.com VIP channel and get also a free subscription to a trusted trading signals channel provided by Best Trading Signal.
Gold price is extending its four-day bearish streak early Thursday, flirting with the lowest level in a week near $3,250.
The buying interest around the US Dollar (USD) remains unabated so far this week, with the latest leg up powered by the cautious Minutes of the US Federal Reserve’s (Fed) May policy meeting and a US federal court’s ruling that blocked President Donald Trump’s “Liberation Day” tariffs.
The court deemed such tariffs illegal, citing that Trump didn’t have the authority to impose across-the-board duties on imports from nations that sell more to the United States (US) than they buy, per Reuters.
Meanwhile, the Fed Minutes read, “participants agreed that uncertainty about the economic outlook had increased further, making it appropriate to take a cautious approach until the net economic effects of the array of changes to government policies become clearer.”
Furthermore, the upbeat market mood on the back of encouraging earnings report from the American artificial intelligence (AI) pioneer Nvidia, showing a strong revenue forecast.
The earnings showed a $44.06bn of revenue for last quarter, beating industry estimates of $43.2bn, earnings per share also beat estimates at $0.96, vs. $0.93.
The market optimism helped the US Dollar bolster its recovery, offsetting any impact of the ongoing US-China trade tension.
According to the latest report, by the New York Times (NYT) the Trump administration is moving to restrict the sale of critical US technologies, including those related to jet engines, semiconductors, and certain chemicals, to China.
Attention now turns to the mid-tier US economic data releases and speeches from a slew of Fed policymakers for some respite to Gold buyers.
A bout of profit-taking in the Greenback could be on the cards ahead of Friday’s US core Personal Consumption Expenditure (PCE) Price Index, the Fed’s preferred inflation measure.
The data could pour cold water on the Fed’s recent hawkish stance and likely trigger a fresh pullback in the USD, allowing Gold price to stage a comeback.
In the meantime, US weekly Jobless Claims and the revision to Gross Domestic Product (GDP) data could provide some trading incentives to the USD and Gold traders.
Trade headlines and geopolitical updates will also continue to play a critical role in the Gold price performance.
The tide seems to have turned in favor of sellers in the near term as the 14-day Relative Strength Index (RSI) tests waters below the midline, currently near 49.50.
Also, Gold buyers failed to defend a powerful demand area near $3,295, which was the confluence of the 21-day Simple Moving Average (SMA) and the 38.2% Fibo of the April record rally, to keep the upside potential intact.
The next test for them is the 50% Fibo support near $3,230, where the 50-day SMA closes in, making that zone a tough nut to crack.
A daily candlestick closing below that level could put the focus back on the 61.8% Fibo support at $3,168, from where Gold price rebounded to two-week highs of $3,366 last week.
Alternatively, if Gold price bounces off the abovementioned critical support area near $3,230, buyers could recapture the 21-day SMA, now at $3,287.
The next immediate resistance is aligned near $3,300 where the 38.2% Fibo level and the round level coincide.
Further up, a sustained break above the $3,350 psychological level is needed to resume the uptrend.
Gold has played a key role in human’s history as it has been widely used as a store of value and medium of exchange. Currently, apart from its shine and usage for jewelry, the precious metal is widely seen as a safe-haven asset, meaning that it is considered a good investment during turbulent times. Gold is also widely seen as a hedge against inflation and against depreciating currencies as it doesn’t rely on any specific issuer or government.
Central banks are the biggest Gold holders. In their aim to support their currencies in turbulent times, central banks tend to diversify their reserves and buy Gold to improve the perceived strength of the economy and the currency. High Gold reserves can be a source of trust for a country’s solvency. Central banks added 1,136 tonnes of Gold worth around $70 billion to their reserves in 2022, according to data from the World Gold Council. This is the highest yearly purchase since records began. Central banks from emerging economies such as China, India and Turkey are quickly increasing their Gold reserves.
Gold has an inverse correlation with the US Dollar and US Treasuries, which are both major reserve and safe-haven assets. When the Dollar depreciates, Gold tends to rise, enabling investors and central banks to diversify their assets in turbulent times. Gold is also inversely correlated with risk assets. A rally in the stock market tends to weaken Gold price, while sell-offs in riskier markets tend to favor the precious metal.
The price can move due to a wide range of factors. Geopolitical instability or fears of a deep recession can quickly make Gold price escalate due to its safe-haven status. As a yield-less asset, Gold tends to rise with lower interest rates, while higher cost of money usually weighs down on the yellow metal. Still, most moves depend on how the US Dollar (USD) behaves as the asset is priced in dollars (XAU/USD). A strong Dollar tends to keep the price of Gold controlled, whereas a weaker Dollar is likely to push Gold prices up.
Gold prices are threatening key technical layers of support on Wednesday, with Bullion searching for a fresh catalyst to drive prices out of the confines of the bull flag pattern.
After erasing 1.25% on Tuesday, the momentum of the downtrend has temporarily paused. At the time of writing, Gold prices are trading above the $3,300 psychological level with the 20-day Simple Moving Average (SMA) providing additional support at $3,289.
The current zone of price action remains technically significant, as it aligns with the upper bound of the bull flag and the 23.60% Fibonacci Retracement level of the January-April move at $3,290.
With the descending trendline from the bull flag providing an additional barrier of resistance for bulls near $3,320, bears have struggled to gain momentum below the Fibonacci support.
With the Relative Strength Index (RSI) flattening around 52, the next big move for the yellow metal hinges on whether bulls or bears can break free from their relative zones of restriction.
A breakdown below $3,200 could open the door toward the 38.2% retracement level at $3,161, followed by deeper support near the 50% and 61.8% Fibonacci levels at $3,057 and $2,952, respectively.
On the upside, a decisive breakout above the descending wedge, particularly a close above $3,350-$3,360, would likely attract bullish momentum. Such a breakout would target a retest of April’s all-time high just below $3,500.
Gold has played a key role in human’s history as it has been widely used as a store of value and medium of exchange. Currently, apart from its shine and usage for jewelry, the precious metal is widely seen as a safe-haven asset, meaning that it is considered a good investment during turbulent times. Gold is also widely seen as a hedge against inflation and against depreciating currencies as it doesn’t rely on any specific issuer or government.
Central banks are the biggest Gold holders. In their aim to support their currencies in turbulent times, central banks tend to diversify their reserves and buy Gold to improve the perceived strength of the economy and the currency. High Gold reserves can be a source of trust for a country’s solvency. Central banks added 1,136 tonnes of Gold worth around $70 billion to their reserves in 2022, according to data from the World Gold Council. This is the highest yearly purchase since records began. Central banks from emerging economies such as China, India and Turkey are quickly increasing their Gold reserves.
Gold has an inverse correlation with the US Dollar and US Treasuries, which are both major reserve and safe-haven assets. When the Dollar depreciates, Gold tends to rise, enabling investors and central banks to diversify their assets in turbulent times. Gold is also inversely correlated with risk assets. A rally in the stock market tends to weaken Gold price, while sell-offs in riskier markets tend to favor the precious metal.
The price can move due to a wide range of factors. Geopolitical instability or fears of a deep recession can quickly make Gold price escalate due to its safe-haven status. As a yield-less asset, Gold tends to rise with lower interest rates, while higher cost of money usually weighs down on the yellow metal. Still, most moves depend on how the US Dollar (USD) behaves as the asset is priced in dollars (XAU/USD). A strong Dollar tends to keep the price of Gold controlled, whereas a weaker Dollar is likely to push Gold prices up.
BHP’s Escondida copper mine in Chile. (Image: Wikimedia Commons)
Chile’s state copper commission Cochilco raised its average copper price forecast for 2025 to $4.30 per pound, citing an improved global outlook following a tariff agreement between the US and China, mining minister Aurora Williams said on Wednesday.
The commission also increased its average price projection for 2026 to $4.30 per pound. Both estimates were previously $4.25 in its February report.
Separately, the agency projected that Chilean copper production will increase by 3% this year and again in 2026, when it is expected to reach 5.84 million metric tons.
The production guidance reflects a downgrade from Cochilco’s February estimate of 4.6% growth in 2025 and 3.6% growth in 2026.
(By Fabian Cambero and Brendan O’Boyle; Editing by Natalia Siniawski)
Silver prices (XAG/USD) are posting moderate losses on Wednesday, weighed by the upbeat market sentiment, which is undermining demand for safe assets, and a firmer US Dollar.
The Greenback is trading higher across the board, on the back of easing trade tensions, after Trump’s decision to delay tariffs to Europe, and the upbeat Consumer Sentiment figures seen on Tuesday.
The risk-on mood offset the weak US Durable Goods Orders data and pushed debt concerns to the back seat, at least for now. The highlight today is the release of the minutes of the Fed’s May meeting that will provide further clues about the bank’s next steps.
XAU USD was capped at the top of the last two months’ trading range, at $33.70, and is now correcting lower. Last week’s lower high confirms the immediate bearish trend, although the support at the $32.80 area seems to be a strong one.
The pair is struggling to find acceptance above $33.35, and remains moving within Tuesday’s range. Resistance at $33.50 (May 23, 26, and 27 highs) is likely to hold bulls ahead of the mentioned horizontal channel’s top at $33.70.
On the downside, a bearish reaction below $32.80 would bring $32.15 into focus.
Silver is a precious metal highly traded among investors. It has been historically used as a store of value and a medium of exchange. Although less popular than Gold, traders may turn to Silver to diversify their investment portfolio, for its intrinsic value or as a potential hedge during high-inflation periods. Investors can buy physical Silver, in coins or in bars, or trade it through vehicles such as Exchange Traded Funds, which track its price on international markets.
Silver prices can move due to a wide range of factors. Geopolitical instability or fears of a deep recession can make Silver price escalate due to its safe-haven status, although to a lesser extent than Gold’s. As a yieldless asset, Silver tends to rise with lower interest rates. Its moves also depend on how the US Dollar (USD) behaves as the asset is priced in dollars (XAG/USD). A strong Dollar tends to keep the price of Silver at bay, whereas a weaker Dollar is likely to propel prices up. Other factors such as investment demand, mining supply – Silver is much more abundant than Gold – and recycling rates can also affect prices.
Silver is widely used in industry, particularly in sectors such as electronics or solar energy, as it has one of the highest electric conductivity of all metals – more than Copper and Gold. A surge in demand can increase prices, while a decline tends to lower them. Dynamics in the US, Chinese and Indian economies can also contribute to price swings: for the US and particularly China, their big industrial sectors use Silver in various processes; in India, consumers’ demand for the precious metal for jewellery also plays a key role in setting prices.
Silver prices tend to follow Gold’s moves. When Gold prices rise, Silver typically follows suit, as their status as safe-haven assets is similar. The Gold/Silver ratio, which shows the number of ounces of Silver needed to equal the value of one ounce of Gold, may help to determine the relative valuation between both metals. Some investors may consider a high ratio as an indicator that Silver is undervalued, or Gold is overvalued. On the contrary, a low ratio might suggest that Gold is undervalued relative to Silver.