The main tag of Gold Price Articles.
You can use the search box below to find what you need.
[wd_asp id=1]
The main tag of Gold Price Articles.
You can use the search box below to find what you need.
[wd_asp id=1]
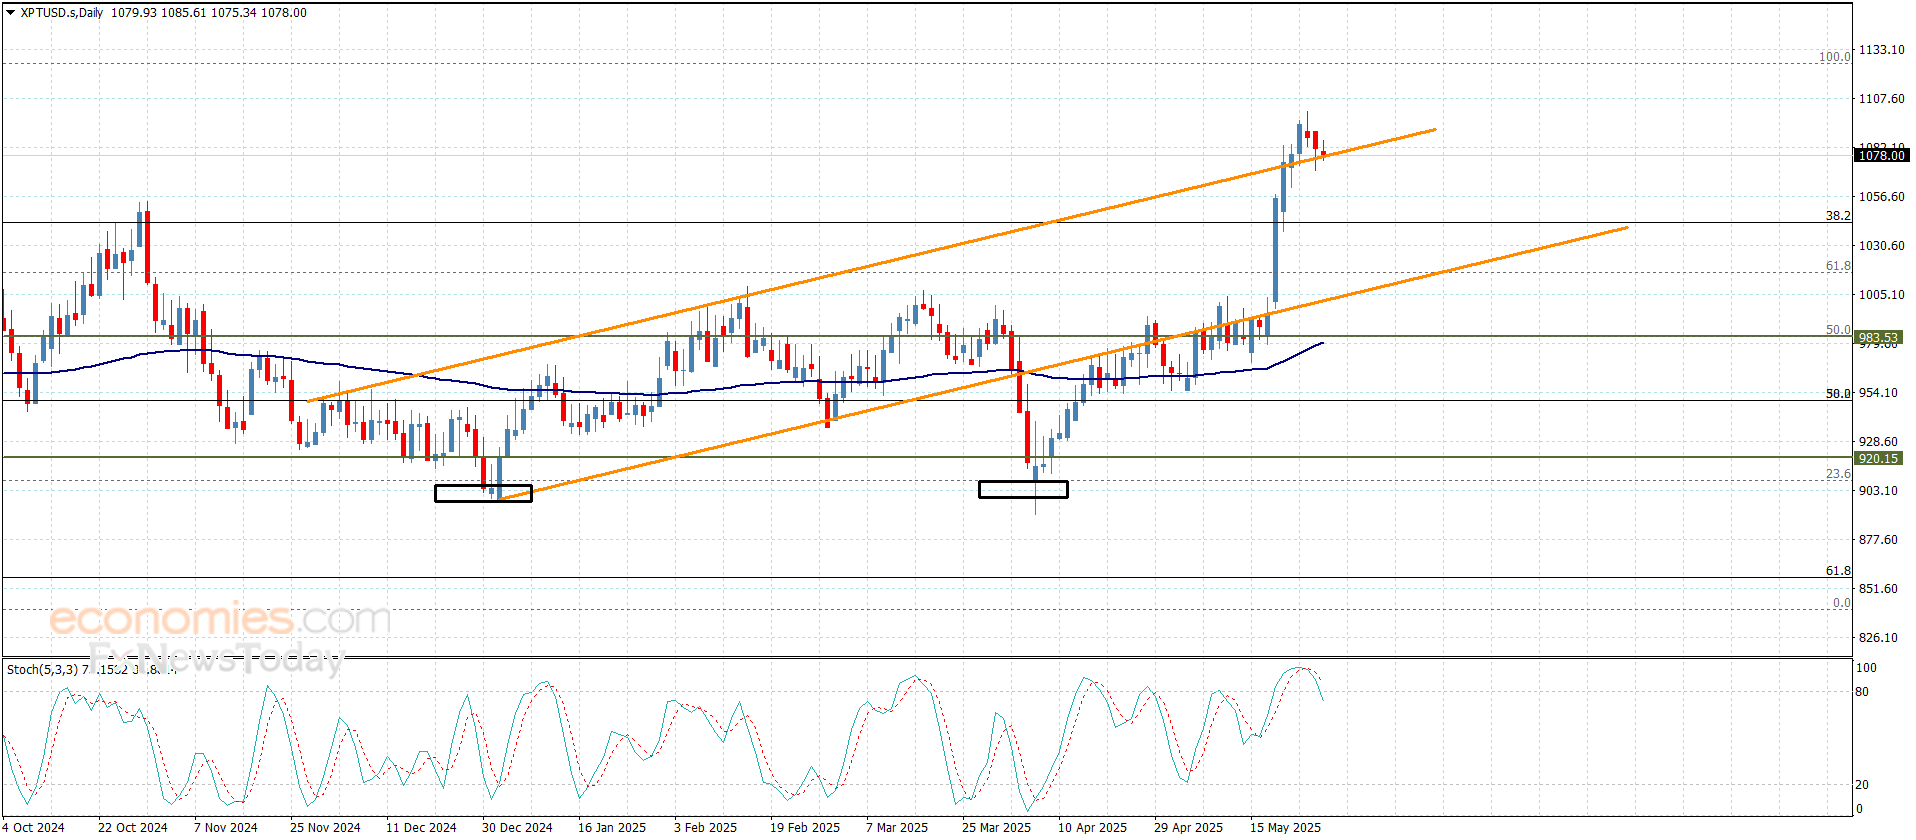
Platinum price continued forming sideways trading since yesterday, attempting to settle above $1080.00, affected by stochastic contradiction, which attempts to exit the overbought level as appears in the above image.
The price might continue forming sideways trading until gathering the required momentum, to ease the mission of recording extra gains by its rally to $1125.00, reaching the next main target near $1156.00, while facing new negative pressures will force it to delay the bullish rally, which forces it to suffer some losses by reaching $1068.00 and $1058.00 by reaching the suggested extra targets.
The expected trading range for today is between $1080.00 and $ 1125.00
Trend forecast: Bullish
Do you need help in trading decisions? Do you want to learn how to start trading?
Join Economies.com VIP Club and benefit from over 15 years of market analysis expertise and get:
Special Offer: Subscribe to the Economies.com VIP channel and get also a free subscription to a trusted trading signals channel provided by Best Trading Signal.
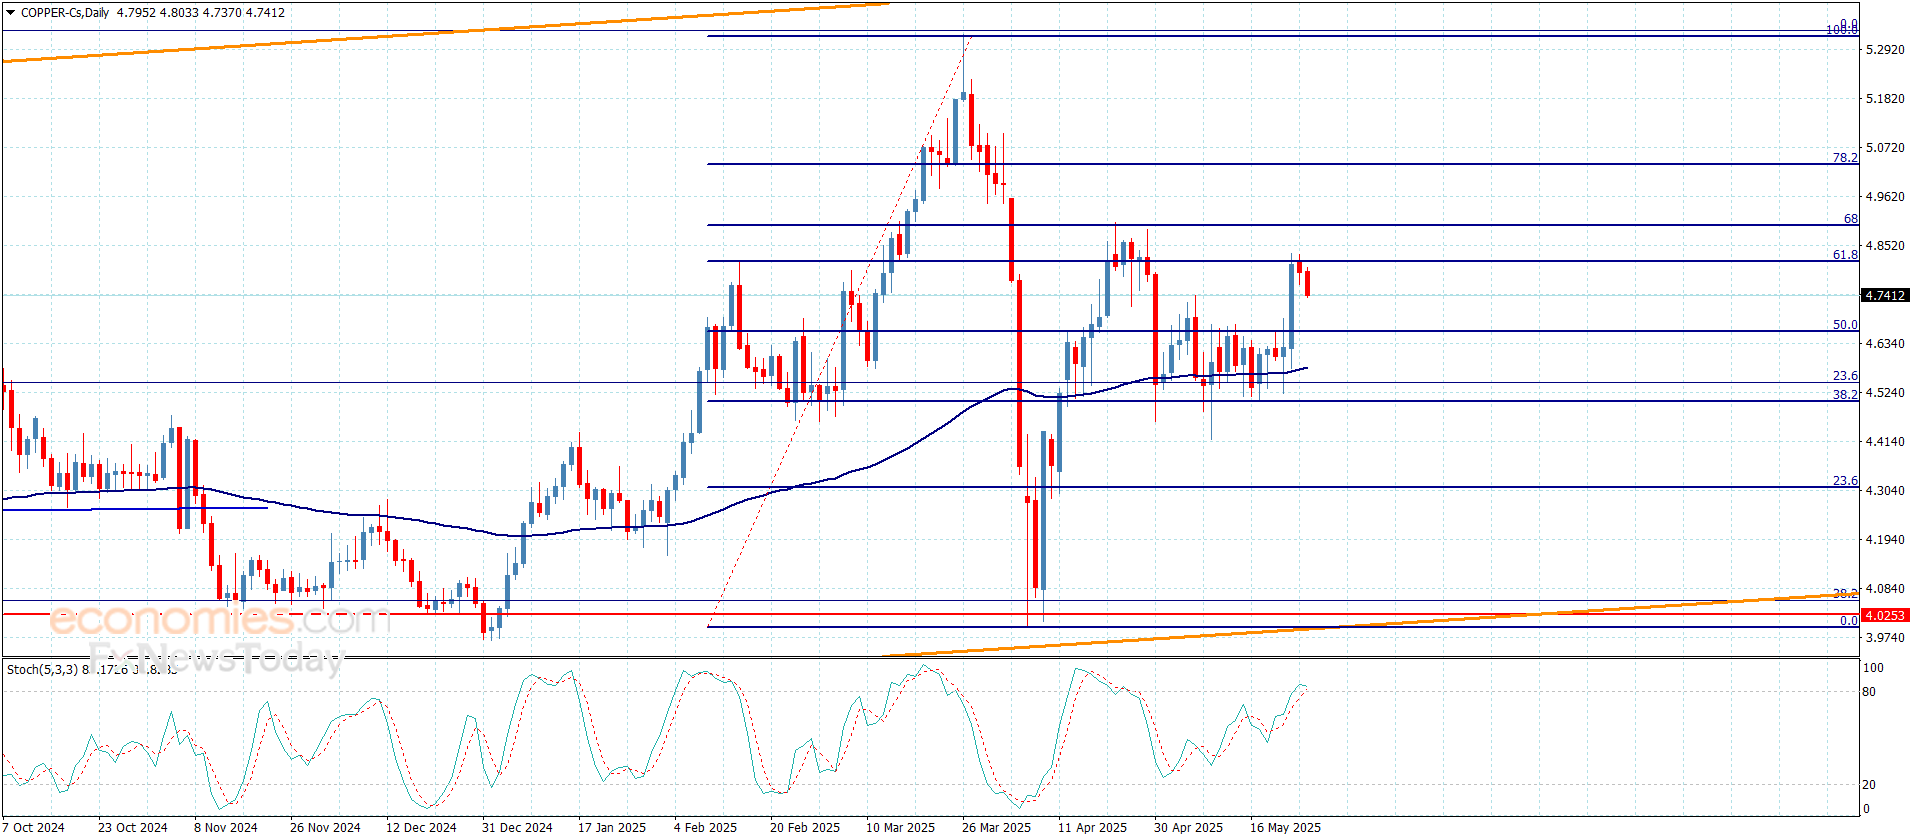
Copper price began moving between Fibonacci correction levels that were measured from the price decline from $5.320 reaching to the bottom at $4.000, to notice its confinement between 50%Fibonacci correction level at $4.6600, which represents an extra barrier against the bullish attempts, while 61.8% Fibonacci correction level at $4.8100 represents a barrier against the bullish rally.
The continuation of the price fluctuations bearishly and forming an extra strong barrier at $4.8900 level, we will return to prefer the negativity in the near trading, to expect reaching the moving average 55 at $4.5650, then attempting to press on $4.5000, while surpassing the bearish scenario requires positive closes above $4.8900 level in the near trading.
The expected trading range for today is between $4.5600 and $4.7400
Trend forecast: Bearish
Do you need help in trading decisions? Do you want to learn how to start trading?
Join Economies.com VIP Club and benefit from over 15 years of market analysis expertise and get:
Special Offer: Subscribe to the Economies.com VIP channel and get also a free subscription to a trusted trading signals channel provided by Best Trading Signal.
Silver price (XAG/USD) recovers its recent losses registered in the previous session, trading around $33.30 per troy ounce during the Asian hours on Wednesday. However, the precious metals, including Silver, faced selling pressure amid a strengthening US Dollar (USD).
The dollar-denominated Silver lost its shine as a higher US Dollar makes it expensive for foreign buyers. The Greenback received support after Japan hinted at potential cuts in government debt issuance, boosting global bond markets and putting downward pressure on US yields. At the time of writing, the 10- and 30-year yields on US Treasury bonds are standing at 4.46% and 4.97%, respectively.
Additionally, the safe-haven demand for Silver weakened due to alleviated trade tension between the United States (US) and the European Union (EU). US President Donald Trump extended the tariff deadline on imports from the EU from June 1 to July 9. On Monday, the Brussels agreed to speed up trade talks with the United States to avoid a transatlantic trade war.
However, the safe-haven Silver gains ground due to rising fears over the US economy amid growing debt issues. US President Donald Trump’s “One Big Beautiful Bill” is set to be voted on in the Senate. The Bill is expected to raise the deficit by $3.8 billion as newly added provisions, including tax cuts, spending increases, and raising the debt ceiling. This could raise the risk of bond yields staying higher and keep borrowing costs higher for consumers, businesses, and governments.
Silver is a precious metal highly traded among investors. It has been historically used as a store of value and a medium of exchange. Although less popular than Gold, traders may turn to Silver to diversify their investment portfolio, for its intrinsic value or as a potential hedge during high-inflation periods. Investors can buy physical Silver, in coins or in bars, or trade it through vehicles such as Exchange Traded Funds, which track its price on international markets.
Silver prices can move due to a wide range of factors. Geopolitical instability or fears of a deep recession can make Silver price escalate due to its safe-haven status, although to a lesser extent than Gold’s. As a yieldless asset, Silver tends to rise with lower interest rates. Its moves also depend on how the US Dollar (USD) behaves as the asset is priced in dollars (XAG/USD). A strong Dollar tends to keep the price of Silver at bay, whereas a weaker Dollar is likely to propel prices up. Other factors such as investment demand, mining supply – Silver is much more abundant than Gold – and recycling rates can also affect prices.
Silver is widely used in industry, particularly in sectors such as electronics or solar energy, as it has one of the highest electric conductivity of all metals – more than Copper and Gold. A surge in demand can increase prices, while a decline tends to lower them. Dynamics in the US, Chinese and Indian economies can also contribute to price swings: for the US and particularly China, their big industrial sectors use Silver in various processes; in India, consumers’ demand for the precious metal for jewellery also plays a key role in setting prices.
Silver prices tend to follow Gold’s moves. When Gold prices rise, Silver typically follows suit, as their status as safe-haven assets is similar. The Gold/Silver ratio, which shows the number of ounces of Silver needed to equal the value of one ounce of Gold, may help to determine the relative valuation between both metals. Some investors may consider a high ratio as an indicator that Silver is undervalued, or Gold is overvalued. On the contrary, a low ratio might suggest that Gold is undervalued relative to Silver.
Spot Gold fell on Tuesday, piercing the $3,300 level during European trading hours and remaining soft after Wall Street’s opening. Upbeat United States (US) data helped the Greenback.
The country reported that Durable Goods Orders declined by 6.3% following a 7.6% increase (revised from 9.2%) reported in March, yet slightly better than the market expectation for a decrease of 7.9%. Additionally, the Conference Board’s Consumer Confidence Index rose to 98.0 in May, following the 86.0 (revised from 85.7) posted in April. The Expectations Index, which measures short-term expectations for income, economic activity, and employment, gained 17.4 points to 72.8, although holding below the 80-point level that signals economic contraction.
Following a dive in pre-opening trading, US indexes are firmly up mid-American session, with the Dow Jones Industrial Average (DJIA) up over 600 points. The better mood can also be attributed to progress in trade talks. US President Trump announced negotiations with the EU will soon take place, expressing confidence in a fair deal coming up.
The focus shifts to the Federal Open Market Committee (FOMC) Minutes, to be out on Wednesday. The FOMC decided to keep the benchmark interest rate on hold when it met early in May, and the document is expected to shed some light on the decisions’ background, while it could also hint at future monetary policy decisions.
From a technical point of view, the daily chart for the XAU/USD pair shows it is pressuring a key dynamic support, which for now holds. A flat 20 Simple Moving Average (SMA) stands at around $3,288, while the pair bottomed for the day at $3,285.64. The same chart shows the 100 and 200 SMAs maintain their firmly bullish slopes far below the shorter one, limiting the longer-term bearish potential. The Momentum indicator crossed its midline into negative territory, but lost its downward strength, while the Relative Strength Index (RSI) indicator turned lower at around 52, reflecting the ongoing slide but falling short of anticipating another leg south.
The 4-hour chart shows XAU/USD fell below its 20 SMA, now providing dynamic resistance at around $3,326, while it bottomed around converging 100 and 200 SMAs. Finally, technical indicators offer neutral-to-bearish slopes within negative levels, skewing the risk towards the downside without confirming it. A recovery beyond the mentioned $3,320 area should see buyers taking back control of the bright metal.
Support levels: 3,285.20 3,272.40 3,258.10
Resistance levels: 3,326.00 3,335.90 3,349.65
Copper price failed to surpass $4.8100, which forces it to activate the attempts to gather the gains, to reach $4.7400 to gather the required extra positive momentum to confirm the bullish scenario in the current period trading.
Depending of forming extra support at $4.6600 level, to wait for renewing the bullish attempts, surpassing $4.8100 level makes us expect to reach 68.1%Fibonacci correction level at $4.8900.
The expected trading range for today is between $4.700 and $4.8100
Trend forecast: Bullish
Do you need help in trading decisions? Do you want to learn how to start trading?
Join Economies.com VIP Club and benefit from over 15 years of market analysis expertise and get:
Special Offer: Subscribe to the Economies.com VIP channel and get also a free subscription to a trusted trading signals channel provided by Best Trading Signal.
Silver price falls by 0.70% on Tuesday, yet it has trimmed some of its earlier losses that pushed the grey metal below $33.00, hitting a two-day low of $32.77. At the time of writing, XAG/USD trades at $33.29.
Silver price is consolidating within a range for the third consecutive day, capped on the upside by resistance at $33.69, the May 22 peak, and on the downside by the 50-day Simple Moving Average (SMA) at $32.73.
Momentum indicates that buyers are in charge, as depicted by the Relative Strength Index (RSI). However, they must clear $33.69, which could pave the way for a challenge of $34. On further strength, XAG/USD next resistance level would be the March 26 high at $34.58, followed by $35.00.
In the bearish scenario, XAG/USD needs to achieve a daily close below the May 23 swing low of $32.90. In that outcome, the next test would be the 50-day Simple Moving Average (SMA) at $32.73. A decisive break will expose the 100-day SMA at $32.11, followed by the 200-day SMA at $31.40.
Silver is a precious metal highly traded among investors. It has been historically used as a store of value and a medium of exchange. Although less popular than Gold, traders may turn to Silver to diversify their investment portfolio, for its intrinsic value or as a potential hedge during high-inflation periods. Investors can buy physical Silver, in coins or in bars, or trade it through vehicles such as Exchange Traded Funds, which track its price on international markets.
Silver prices can move due to a wide range of factors. Geopolitical instability or fears of a deep recession can make Silver price escalate due to its safe-haven status, although to a lesser extent than Gold’s. As a yieldless asset, Silver tends to rise with lower interest rates. Its moves also depend on how the US Dollar (USD) behaves as the asset is priced in dollars (XAG/USD). A strong Dollar tends to keep the price of Silver at bay, whereas a weaker Dollar is likely to propel prices up. Other factors such as investment demand, mining supply – Silver is much more abundant than Gold – and recycling rates can also affect prices.
Silver is widely used in industry, particularly in sectors such as electronics or solar energy, as it has one of the highest electric conductivity of all metals – more than Copper and Gold. A surge in demand can increase prices, while a decline tends to lower them. Dynamics in the US, Chinese and Indian economies can also contribute to price swings: for the US and particularly China, their big industrial sectors use Silver in various processes; in India, consumers’ demand for the precious metal for jewellery also plays a key role in setting prices.
Silver prices tend to follow Gold’s moves. When Gold prices rise, Silver typically follows suit, as their status as safe-haven assets is similar. The Gold/Silver ratio, which shows the number of ounces of Silver needed to equal the value of one ounce of Gold, may help to determine the relative valuation between both metals. Some investors may consider a high ratio as an indicator that Silver is undervalued, or Gold is overvalued. On the contrary, a low ratio might suggest that Gold is undervalued relative to Silver.
The U.S. dollar index reversed early losses to trade 0.3% higher, directly undermining gold’s appeal for non-dollar buyers. The uptick in the greenback coincided with Trump rolling back his threat of fresh tariffs on the EU. Instead of escalating tensions, he reinstated a July 9 deadline for trade talks, which fueled optimism in equity markets and weakened gold’s haven bid.
Ole Hansen of Saxo Bank noted that gold is under pressure from technical selling, with the metal trading below a descending trendline drawn from the April all-time high. “Reduced haven demand and rising stock markets are weighing on gold,” he said. This backdrop of declining geopolitical stress and a firmer dollar creates immediate resistance at Friday’s high of $3366.02, with downside pivots marked at $3310.48 and $3277.91.
Market focus is now shifting to upcoming speeches from Federal Reserve officials and Friday’s release of core PCE inflation data — a key input for rate decisions. Investors currently expect 47 basis points of rate cuts by year-end, likely beginning in October. A weaker inflation print or dovish commentary could reignite support for gold, as lower rates reduce the opportunity cost of holding non-yielding assets like bullion.
Rhona O’Connell of StoneX emphasized that gold remains in a consolidation phase. “The high is likely in, but uncertainty will keep prices supported,” she noted. Still, the technical structure suggests caution, particularly as price action nears the 50-day moving average.
Silver prices (XAG/USD) are dropping beyond 1% on Monday, weighed by a moderately positive market sentiment and a mild US Dollar recovery. Trump’s de-escalation of the tariff rift with Europe has boosted market sentiment, dampening demand for safe assets like precious metals.
The US president delayed a plan to impose 50% tariffs on all Eurozone imports from June 1 after a phone call with EU Commissioner, Ursula von der Leyen. This has calmed investors’ fears about a severe impact on international trade and on the global economic growth prospects.
The US Dollar rebound, however, is likely to face resistance amid the growing concerns about the US fiscal health. Last week’s downgrade of the US debt ratings and the impact of a tax-slashing bill have boosted fears of a debt crisis in the US, which fuelled a “Sell America” trade last week.
Trump’s “big, beautiful tax bill”, which will be discussed by the US senate over the coming weeks, is expected to add $3.8 trillion to a $36,2 trillion debt pile over the next years. This is likely to act as a headwind for the US Dollar and keep Silver dips limited.
The table below shows the percentage change of US Dollar (USD) against listed major currencies today. US Dollar was the strongest against the Australian Dollar.
| USD | EUR | GBP | JPY | CAD | AUD | NZD | CHF | |
|---|---|---|---|---|---|---|---|---|
| USD | 0.27% | 0.13% | 0.40% | 0.09% | 0.48% | 0.47% | 0.29% | |
| EUR | -0.27% | -0.16% | 0.15% | -0.18% | 0.13% | 0.09% | -0.00% | |
| GBP | -0.13% | 0.16% | 0.31% | -0.02% | 0.26% | 0.25% | 0.12% | |
| JPY | -0.40% | -0.15% | -0.31% | -0.31% | 0.06% | -0.03% | -0.13% | |
| CAD | -0.09% | 0.18% | 0.02% | 0.31% | 0.36% | 0.28% | 0.14% | |
| AUD | -0.48% | -0.13% | -0.26% | -0.06% | -0.36% | -0.11% | -0.25% | |
| NZD | -0.47% | -0.09% | -0.25% | 0.03% | -0.28% | 0.11% | -0.17% | |
| CHF | -0.29% | 0.00% | -0.12% | 0.13% | -0.14% | 0.25% | 0.17% |
The heat map shows percentage changes of major currencies against each other. The base currency is picked from the left column, while the quote currency is picked from the top row. For example, if you pick the US Dollar from the left column and move along the horizontal line to the Japanese Yen, the percentage change displayed in the box will represent USD (base)/JPY (quote).
From a technical perspective, XAG/USD is going through a choppy consolidation following April’s rally. The pair has been capped at the range top, 33.70, and is likely to test support at the $32.90 zone.
A break of this level would increase pressure towards the May 20 low, $32.15 ahead of the range bottom, at $31.74. Above $33.70, the next resistances are $34.15 and $34.60.
The EURJPY pair provided a new positive close above the support at 161.90, which gets its strength from the stability of the moving average 55, to support the chances for activating the bullish attack again, so the continuation of gathering the positive momentum will allow it to reach the barrier at 163.35, and breaching it will open the way for recording big gains that might extend to 164.00 and 164.80.
While reaching below the current support and providing a negative close, will force it to form sharp bearish waves due to its return to settle within the bearish channel’s levels, to expect suffering several losses that begin at 160.90.
The expected trading range for today is between 162.00 and 163.35
Trend forecast: Bullish
Do you need help in trading decisions? Do you want to learn how to start trading?
Join Economies.com VIP Club and benefit from over 15 years of market analysis expertise and get:
Special Offer: Subscribe to the Economies.com VIP channel and get also a free subscription to a trusted trading signals channel provided by Best Trading Signal.
“Gold is caught in a tug-of-war between a weaker dollar, potential Fed easing, and geopolitical risks,” said Kelvin Wong, senior market analyst at OANDA Asia Pacific.
Former President Trump’s decision to delay the imposition of 50% tariffs on European Union imports until July 9 provided short-term relief to market nerves, but the broader trade outlook remains uncertain. The combination of muted dollar strength and cautious Fed guidance is keeping gold prices in check.
Silver (XAG/USD) mirrored gold’s consolidation, trading around $33.50 per ounce. The ongoing uncertainty surrounding U.S. fiscal policy and trade negotiations is a key backdrop.
The Congressional Budget Office projects the federal deficit will expand by $4 trillion over the next decade, driven by proposed tax cuts and spending initiatives. This has raised concerns over longer-term dollar stability, indirectly supporting silver’s price floor.
Market participants are now focusing on upcoming economic reports for guidance. Tuesday’s Durable Goods Orders and Consumer Confidence Index will provide short-term cues, while Wednesday’s FOMC minutes and Friday’s Personal Consumption Expenditures Price Index are expected to shape expectations for the Fed’s rate path.
As geopolitical tensions persist and economic signals remain mixed, gold and silver prices are likely to stay range-bound, supported by safe-haven demand but constrained by limited bullish momentum.