The main tag of Gold Price Articles.
You can use the search box below to find what you need.
[wd_asp id=1]
The main tag of Gold Price Articles.
You can use the search box below to find what you need.
[wd_asp id=1]
Furthermore, an outside day will be established today along with a likely bullish hammer candlestick pattern. Wednesday’s high was $3.93 and if natural gas closes above it today, the inside day breakout will be confirmed. Also, notice the relationship to the declining parallel trend channel. There was a breakout above the top of the channel and the day’s closing price may also be above the line.
The prior interim swing low at $3.96 can be used as a proxy for the line. Earlier in the day natural gas reclaimed the 50-Day MA on a move above $3.88. Therefore, the recovery since dropping below the line on Tuesday was relatively quick and therefore a bullish indication.
An initial upside target for natural gas should be around the 20-Day MA, now at $4.11. Since there is also the 38.2% Fibonacci retracement at $4.18, they can be watched together for signs of resistance. A little higher is a prior interim swing low at $4.26, also a weekly high. Since it is part of the recent decline, it represents a key potential resistance level, as a rally above $4.26 will signal a bullish reversal of the bearish correction.
Since there is only one more trading day to the week, today’s advance may establish a bullish weekly candlestick pattern. That would set up a potential bullish reversal on the weekly chart going into next week. If that happens then the higher targets should be more likely to be reached. Of course, there is always the possibility that trading next week is contained within this week’s price range.
For a look at all of today’s economic events, check out our economic calendar.
Platinum price was trapped in a tight range of trading near the $983 barrier on one hand, and the 55-day SMA support of $964 on the other hand, therefore we stand neutral until the price commits to a single path.
A breach of the current support would send the price towards $950.00, while an upward breach would send it towards $1000.00 first then the next major target at $1017.
Expected trading range today is between $964 and $983.
Today’s price forecast: Neutral
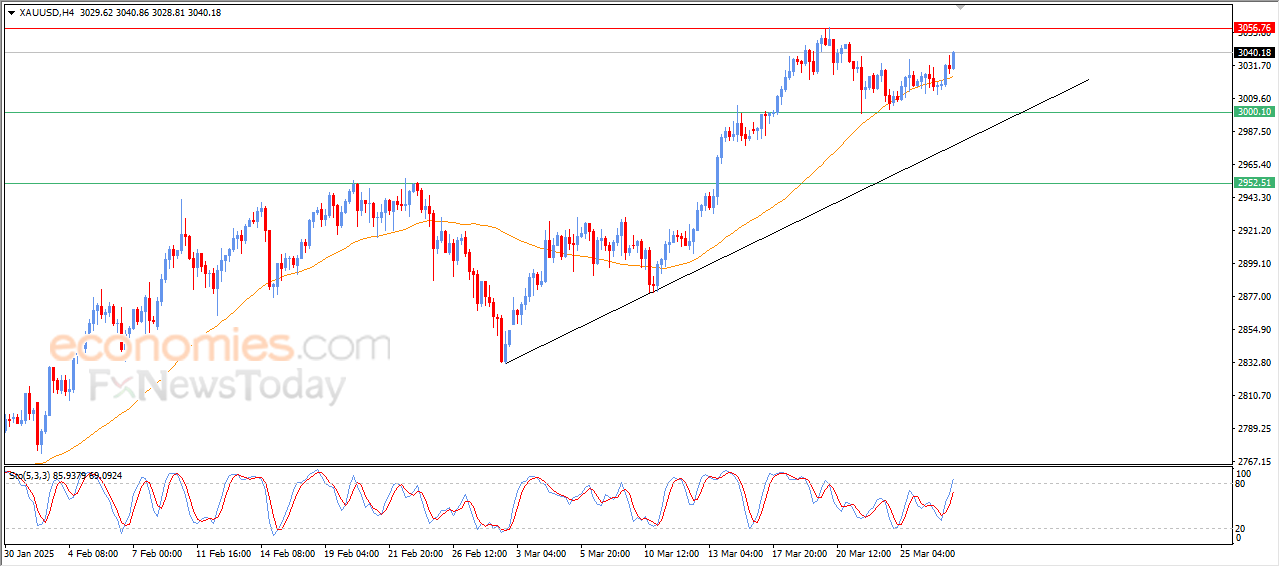
The broad US Dollar (USD) weakness helped XAU/USD resumed its advance, with the bright metal reaching a fresh record high at $3,059.67, in the American session.
Markets rushed away from the USD and into safety after United States (US) President Donald Trump came out with fresh tariffs threats. Trump announced new 25% levies on cars and car parts coming into the US late on Wednesday, while adding more tariffs could be imposed to the Eurozone (EU) and Canada. Taxes on vehicles will come into effect on April 3, while those on auto parts will come in May or later.
Canadian Prime Minister Mark Carney said that Trump’s new auto tariffs are “a direct attack” on the Canadian autoworkers. “We will defend our workers, we will defend our companies, we will defend our country, and we will defend it together,” Carney added.
The news negatively affected stock markets, which struggled to attract investors. Asian indexes ended the day mixed, although European ones ended the day mixed. As for US indexes, they also stand in the red.
Investors will now focus on upcoming US data. On Friday, the country will release the February Personal Consumption Expenditures (PCE) Price Index, the Federal Reserve (Fed )’s favorite inflation gauge. Core annual PCE is foreseen at 2.7%, slightly higher than the 2.6% posted in January.
The XAU/USD pair maintains the upward pressure and aims to extend its advance, according to technical readings in the daily chart. The pair develops above all its moving averages, with a bullish 20 Simple Moving Average (SMA) picking up momentum and currently at around $2,968.40. At the same time, technical indicators resumed their advances within positive levels, in line with a higher high ahead.
The near-term picture is bullish. XAU/USD extended its recovery above a now mildly bullish 20 SMA in the 4-hour chart, while the 100 and 200 SMAs advance below the shorter one. Finally, technical indicators head north above their midlines, with uneven upward strength, yet still reflecting prevalent buying interest.
Support levels: 3,030.50 3,0 23.14 2,999.30
Resistance levels: 3,060.00 3,075.00 3,090.00
Silver (XAG/USD) recovers recent losses from the previous session, trading around $33.70 per troy ounce during Asian hours on Thursday. The metal gains traction as investors seek safe-haven assets following the US auto tariff announcement, which has fueled concerns over potential retaliatory measures next week.
Risk-off sentiment intensified after US President Donald Trump signed an order late Wednesday imposing a 25% tariff on auto imports, effective April 2, with collections starting the next day. However, auto parts imports will receive a one-month reprieve.
Additionally, Silver, a non-yielding asset, could have attracted buyers as US Treasury yields decline, with the 2-year and 10-year yields hovering at 4.0% and 4.34%, respectively. Moreover, a weaker US Dollar (USD) also makes Silver more affordable for foreign buyers, further supporting the demand for the grey metal.
Meanwhile, the Federal Reserve (Fed) reaffirmed its December projection for two rate cuts this year but adopted a cautious stance. Minneapolis Fed President Neel Kashkari stressed the ongoing inflation battle, stating, “The job market has stayed strong, but the biggest challenge is to finish the job,” echoing Chair Powell’s view that rate cuts are not imminent. Kashkari also highlighted policy uncertainty as a complicating factor for the Fed.
Traders are closely monitoring upcoming US economic data, including weekly Initial Jobless Claims and the final Q4 Gross Domestic Product (GDP) Annualized report due Thursday. Additionally, Friday’s release of the Personal Consumption Expenditures (PCE) report—the Fed’s preferred inflation gauge—will provide further policy insights.
Silver is a precious metal highly traded among investors. It has been historically used as a store of value and a medium of exchange. Although less popular than Gold, traders may turn to Silver to diversify their investment portfolio, for its intrinsic value or as a potential hedge during high-inflation periods. Investors can buy physical Silver, in coins or in bars, or trade it through vehicles such as Exchange Traded Funds, which track its price on international markets.
Silver prices can move due to a wide range of factors. Geopolitical instability or fears of a deep recession can make Silver price escalate due to its safe-haven status, although to a lesser extent than Gold’s. As a yieldless asset, Silver tends to rise with lower interest rates. Its moves also depend on how the US Dollar (USD) behaves as the asset is priced in dollars (XAG/USD). A strong Dollar tends to keep the price of Silver at bay, whereas a weaker Dollar is likely to propel prices up. Other factors such as investment demand, mining supply – Silver is much more abundant than Gold – and recycling rates can also affect prices.
Silver is widely used in industry, particularly in sectors such as electronics or solar energy, as it has one of the highest electric conductivity of all metals – more than Copper and Gold. A surge in demand can increase prices, while a decline tends to lower them. Dynamics in the US, Chinese and Indian economies can also contribute to price swings: for the US and particularly China, their big industrial sectors use Silver in various processes; in India, consumers’ demand for the precious metal for jewellery also plays a key role in setting prices.
Silver prices tend to follow Gold’s moves. When Gold prices rise, Silver typically follows suit, as their status as safe-haven assets is similar. The Gold/Silver ratio, which shows the number of ounces of Silver needed to equal the value of one ounce of Gold, may help to determine the relative valuation between both metals. Some investors may consider a high ratio as an indicator that Silver is undervalued, or Gold is overvalued. On the contrary, a low ratio might suggest that Gold is undervalued relative to Silver.
Goldman Sachs’ stock price (GS) tumbled in latest intraday trading, amid the dominance of the downward correctional trend in the short term, with negative pressure due to trading below the 50-day SMA, while a negative divergence forms in the Stochastic after reaching overbought levels compared to the price’s movements.
Therefore we expect more losses for the price, targeting the support of $527.50, provided the resistance of $611.90 holds on.
Today’s price forecast: Bearish
Natural gas price formed weak sideways trading yesterday near $3.880 in an attempt to shake off negative signals from the Stochastic, while holding repeatedly above the support of $3.750.
It’s likely an indication of the strength of the upward trend towards $4.060, thus sending the price even higher to $4.180.
Expected trading range today is between $3.750 and $4.060.
Today’s price forecast: Bullish as the support holds
Silver price (XAG/USD) advances to near $34.00 during European trading hours on Thursday. The white metal strengthens as fresh 25% tariffs on cars entering the United States (US) have stoked fears of global economic uncertainty.
US President Donald Trump said on Wednesday that auto tariffs “will be 25%”, which will come into effect April 2 and will be collected from April 3. Trump added that these tariffs would be permanent.
The impact of Trump’s auto tariffs will be significant on Mexico, Canada, Japan, South Korea, and Germany, which were the top 5 auto exporters to the United States in 2022, according to the Commerce Department.
The Silver price tends to perform better in heightening global economic uncertainty.
US President Trump’s auto tariffs have also weighed on the US Dollar (USD) as its consequences will also be borne by the domestic economy. The automakers of the US would be forced to set up manufacturing facilities in the domestic region. Given high labor cost in the US economy, prices of cars will shoot up, which will diminish the purchasing power of households. The US Dollar Index (DXY), which tracks the Greenback’s value against six major currencies, retraces from its three-week high of 104.68 posted on Wednesday.
Going forward, investors will focus on the US Personal Consumption Expenditure Price Index (PCE) data for February, which will be released on Friday. Economists expect the US core PCE inflation, which is the Federal Reserve’s (Fed) preferred inflation gauge, to have grown at a faster pace of 2.7% year-on-year, compared to the 2.6% increase seen in January.
Silver price advances toward the flat border of the Ascending Triangle chart pattern formation on the daily timeframe near the October 22 high of $34.87. The upward-sloping border of the above-mentioned chart pattern is placed from the August 8 low of $26.45. Technically, the Ascending Triangle pattern indicates indecisiveness among market participants.
The 20-day Exponential Moving Average (EMA) near $33.20 continues to provide support to the Silver price.
The 14-day Relative Strength Index (RSI) rebounds above 60.00, suggesting a resurgence in bullish momentum.
Looking down, the March 6 high of $32.77 will act as key support for the Silver price. While, the October 22 high of $34.87 will be the major barrier.
Silver is a precious metal highly traded among investors. It has been historically used as a store of value and a medium of exchange. Although less popular than Gold, traders may turn to Silver to diversify their investment portfolio, for its intrinsic value or as a potential hedge during high-inflation periods. Investors can buy physical Silver, in coins or in bars, or trade it through vehicles such as Exchange Traded Funds, which track its price on international markets.
Silver prices can move due to a wide range of factors. Geopolitical instability or fears of a deep recession can make Silver price escalate due to its safe-haven status, although to a lesser extent than Gold’s. As a yieldless asset, Silver tends to rise with lower interest rates. Its moves also depend on how the US Dollar (USD) behaves as the asset is priced in dollars (XAG/USD). A strong Dollar tends to keep the price of Silver at bay, whereas a weaker Dollar is likely to propel prices up. Other factors such as investment demand, mining supply – Silver is much more abundant than Gold – and recycling rates can also affect prices.
Silver is widely used in industry, particularly in sectors such as electronics or solar energy, as it has one of the highest electric conductivity of all metals – more than Copper and Gold. A surge in demand can increase prices, while a decline tends to lower them. Dynamics in the US, Chinese and Indian economies can also contribute to price swings: for the US and particularly China, their big industrial sectors use Silver in various processes; in India, consumers’ demand for the precious metal for jewellery also plays a key role in setting prices.
Silver prices tend to follow Gold’s moves. When Gold prices rise, Silver typically follows suit, as their status as safe-haven assets is similar. The Gold/Silver ratio, which shows the number of ounces of Silver needed to equal the value of one ounce of Gold, may help to determine the relative valuation between both metals. Some investors may consider a high ratio as an indicator that Silver is undervalued, or Gold is overvalued. On the contrary, a low ratio might suggest that Gold is undervalued relative to Silver.
BRANDED CONTENT
Finding a broker with low spreads can make a big difference in your trading success. Discover our top picks for low-spread brokers, each offering unique benefits to fit your strategy.
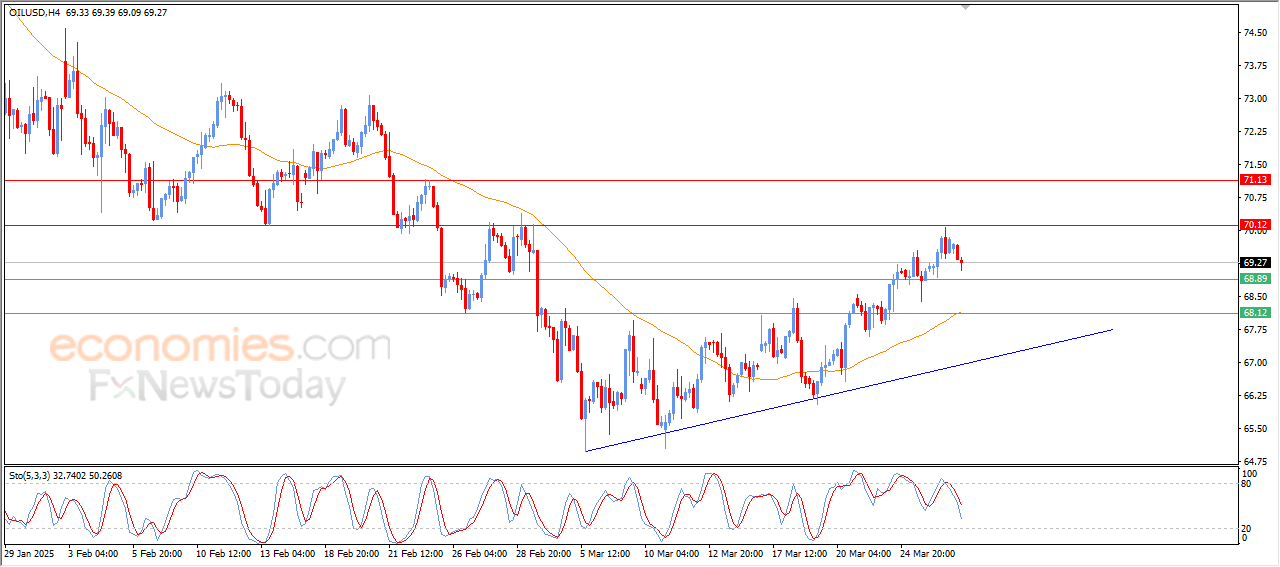
US crude oil price settled higher in latest intraday trading after reaching our price target of $70.000, bouncing off it lower amid negative signals from the Stochastic after reaching overbought levels in a contradiction to the price’s action, thus forming a negative divergence, which could boost the negative scenario.
It comes amid the dominance of the upward correctional trend as the price moves alongside the trend line, with ongoing positive pressure due to trading above the 50-candle SMA.
To get our more detailed analysis and 100% accurate signals provided by Best Trading Signal, subscribe to Economies.com VIP Club through the link below!
Gold price is finding fresh demand above $3,000 early Thursday, following a lacklustre performance on Wednesday. Gold buyers try their luck and aim for the record high of $3,058 once again as they near Friday’s US inflation test.
So far in Thursday’s trading, Gold price is capitalizing on a fresh US Dollar (USD) pullback from three-week highs against its major rivals on reduced haven demand. Markets breathed a sigh of relief after US President Donald Trump announced earlier in the Asian session a one-month tariff exemption for auto parts imports from his new 25% automotive tariffs.
Further, US economic slowdown concerns resurfaced as traders assess the impact on Trump’s tariffs, lifting the traditional store of value Gold at the expense of the US Dollar.
However, it remains to be seen if Gold price sustains the upswing, especially after Wednesday’s subdued price action. The US final Gross Domestic Product (GDP) revision for the fourth quarter and the weekly Jobless Claims data will likely play a second fiddle to developments surrounding US tariffs. Speeches from several Federal Reserve (Fed) policymakers will be closely eyed.
Gold price fluctuated in a narrow range on Wednesday, initially holding ground amid renewed tariff threats from US President Donald Trump. According to reports, Trump was set to impose three escalating levels of tariffs, with Canada likely to be on the lower end of the April 2 tariffs. Bloomberg News reported that the US President “plans to implement copper import tariffs within weeks.”
These reports initially weighed on the USD, allowing Gold price to build on Tuesday’s rebound but the tide turned in favor of the Greenback after Trump late on Wednesday re-announced plans for long-promised 25% tariffs on automotive imports, which are set to go into effect on April 2.
Fresh tariff threats spooked markets and revived the safety bids for the US Dollar. Meanwhile, hawkish commentary from Fed policymakers also underpinned the US Dollar recovery, wiping out the earlier gains in Gold price to settle almost unchanged on the day.
Amid increased upside risks to the inflation outlook, courtesy of Trump’s tariffs, St Louis Fed President Alberto Musalem said on Wednesday the Fed had no urgency to cut rates. Minneapolis Fed President Neel Kashkari said the Fed should stay put amid continued policy uncertainty, per Reuters.
The technical setup on the daily chart favors buyers, with their sights set on the ascending triangle target, measured at $3,080.
The 14-day Relative Strength Index (RSI) is trending higher, currently at 67, backing the upside.
Gold price appears poised to retake the record high of $3,058 on its way to achieving the triangle target of $3,080.
Conversely, the $3,000 round level will emerge as a powerful support. The next downside cap is aligned at the previous week’s low of $2,982.
Further south, the 21-day Simple Moving Average (SMA) and the triangle support confluence at $2,963 will be a tough nut to crack for sellers.
(This story was corrected on March 27 at 5:57 to say that “The US Dollar corrects from three-week highs,” not lows.)
Silver price retreats by 0.32% after reaching a four-day high of $33.92. At the time of writing, XAG/USD trades at $33.60, undermined by the strength of the US Dollar, which has registered solid gains.
After registering a solid rally on Tuesday, Silver failed to break the $34.00 mark, which opened the door for sellers, capping the grey metal’s advance to challenging yearly peaks, near $34.23.
Momentum favors XAG/USD upside as depicted by the Relative Strength Index (RSI), which, is about to surpass the previous peak. Therefore, short-term further upside is seen.
XAG/USD first resistance would be the March 26 high at $33.92. Once cleared the next stop would be the $34.00 figure, followed by last October’s monthly peak at $34.86.
Conversely, if XAG/USD slips beneath $33.00, immediate support emerges at the March 21 low of $32.66. Once hurdled, the next stop is the 50-day Simple Moving Average (SMA) at $32.04.
Silver is a precious metal highly traded among investors. It has been historically used as a store of value and a medium of exchange. Although less popular than Gold, traders may turn to Silver to diversify their investment portfolio, for its intrinsic value or as a potential hedge during high-inflation periods. Investors can buy physical Silver, in coins or in bars, or trade it through vehicles such as Exchange Traded Funds, which track its price on international markets.
Silver prices can move due to a wide range of factors. Geopolitical instability or fears of a deep recession can make Silver price escalate due to its safe-haven status, although to a lesser extent than Gold’s. As a yieldless asset, Silver tends to rise with lower interest rates. Its moves also depend on how the US Dollar (USD) behaves as the asset is priced in dollars (XAG/USD). A strong Dollar tends to keep the price of Silver at bay, whereas a weaker Dollar is likely to propel prices up. Other factors such as investment demand, mining supply – Silver is much more abundant than Gold – and recycling rates can also affect prices.
Silver is widely used in industry, particularly in sectors such as electronics or solar energy, as it has one of the highest electric conductivity of all metals – more than Copper and Gold. A surge in demand can increase prices, while a decline tends to lower them. Dynamics in the US, Chinese and Indian economies can also contribute to price swings: for the US and particularly China, their big industrial sectors use Silver in various processes; in India, consumers’ demand for the precious metal for jewellery also plays a key role in setting prices.
Silver prices tend to follow Gold’s moves. When Gold prices rise, Silver typically follows suit, as their status as safe-haven assets is similar. The Gold/Silver ratio, which shows the number of ounces of Silver needed to equal the value of one ounce of Gold, may help to determine the relative valuation between both metals. Some investors may consider a high ratio as an indicator that Silver is undervalued, or Gold is overvalued. On the contrary, a low ratio might suggest that Gold is undervalued relative to Silver.