The main tag of Gold Price Articles.
You can use the search box below to find what you need.
[wd_asp id=1]
The main tag of Gold Price Articles.
You can use the search box below to find what you need.
[wd_asp id=1]
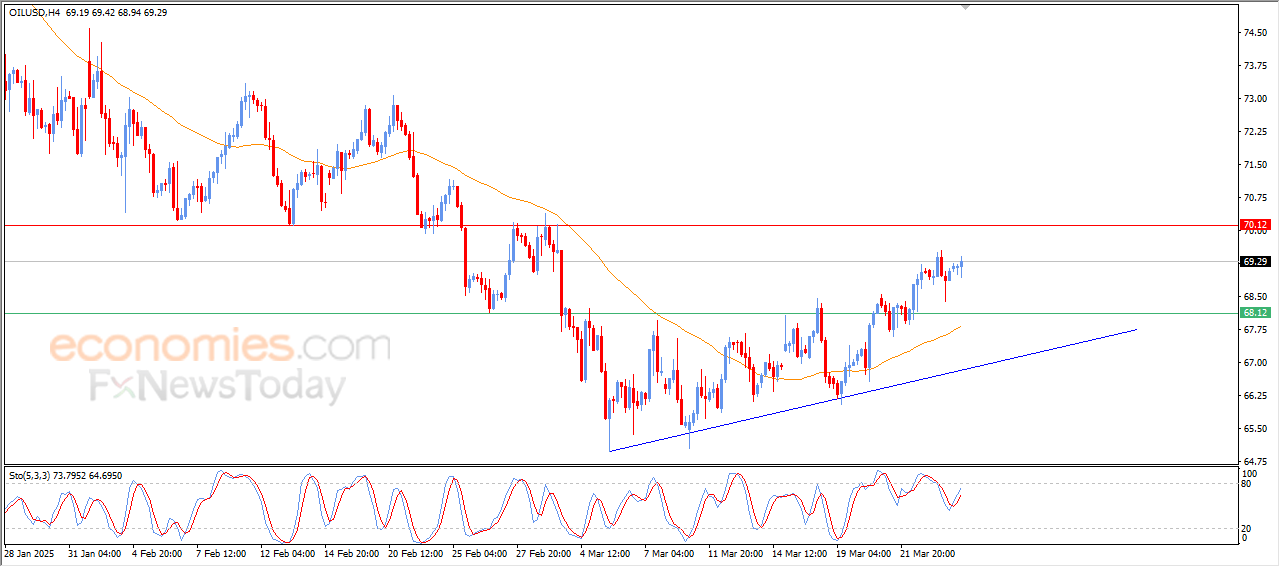
US crude oil price settled higher in latest intraday trading after reaching our price target of $70.000, bouncing off it lower amid negative signals from the Stochastic after reaching overbought levels in a contradiction to the price’s action, thus forming a negative divergence, which could boost the negative scenario.
It comes amid the dominance of the upward correctional trend as the price moves alongside the trend line, with ongoing positive pressure due to trading above the 50-candle SMA.
To get our more detailed analysis and 100% accurate signals provided by Best Trading Signal, subscribe to Economies.com VIP Club through the link below!
Gold price is stable on Wednesday, hovering in a tight range around its daily opening. The bright metal failed to attract fresh buyers despite fresh US Dollar (USD) strength and a generally sour mood. Wall Street turned red after the opening, reflecting the risk-off sentiment.
Concerns gyrate around United States (US) President Donald Trump’s tariff announcements, with the latest on the matter indicating he is preparing auto tariffs and will unveil his plan as soon as today. His massive levies on US imports from around the world have triggered concerns among authorities and representatives from major economies, as such taxes could affect economic growth and inflation levels beyond the US. According to the latest data available, reciprocal tariffs will come into effect on April 2.
Meanwhile, US data was encouraging. The country released February Durable Goods Orders, which rose by 0.9%, beating the -1%. The latest update on the Q4 Gross Domestic Product (GDP) will be out on Thursday, alongside Initial Jobless Claims for the previous week.
Meanwhile, Federal Reserve (Fed) member Neel Kashkari reiterated that there is still job to be done regarding inflation, while adding he is still uncertain about the effects of tariffs. He added that he takes very seriously the hit to confidence, and that the Fed should sit were it is, referring to maintain a wait-and-see stance.
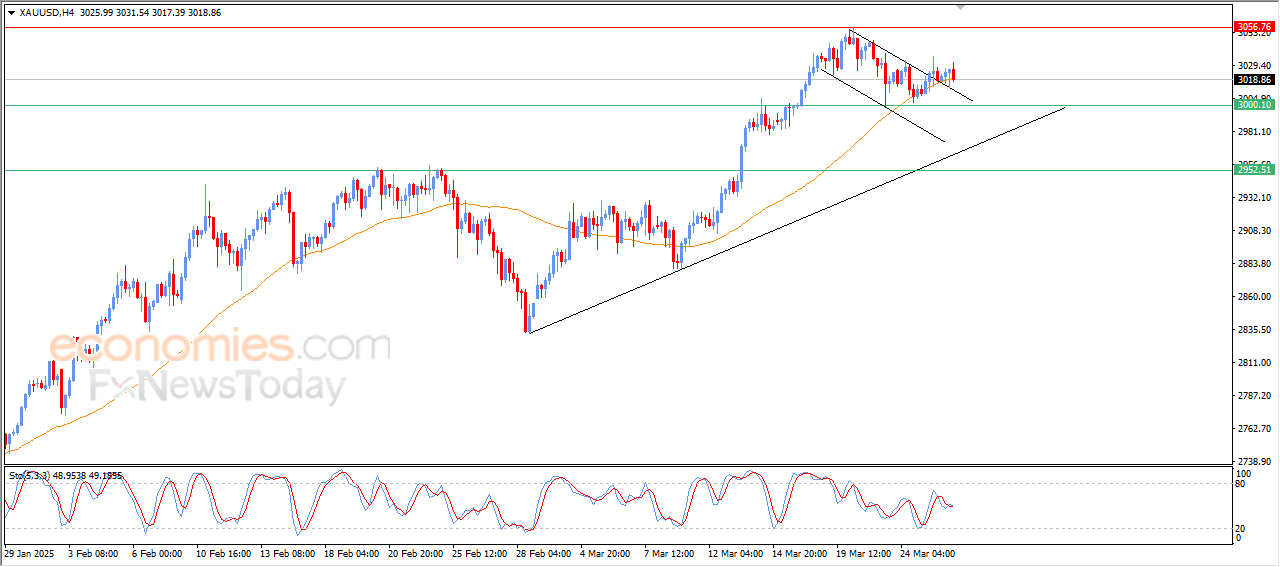
The XAU/USD pair’s daily chart shows it trades around its daily opening, just below $3,020. The upward momentum faded, but the risk remains skewed to the upside, given that technical indicators hold well above their midlines, with modest upward slopes. At the same time, the pair keeps developing above all its moving averages, with a bullish 20 Simple Moving Average (SMA) providing support at around $2,960.
The 4-hour chart shows XAU/USD remains stuck around a mildly bearish 20 SMA while the 100 and 200 SMAs maintain their bullish slopes far below the current level. Technical indicators, in the meantime, head modestly lower just below their midlines, not enough to confirm a steeper decline.
Support levels: 2,999.30 2,984.70 2,970.20
Resistance levels: 3,030.50 3,047.40 3,060.00
Tariffs are customs duties levied on certain merchandise imports or a category of products. Tariffs are designed to help local producers and manufacturers be more competitive in the market by providing a price advantage over similar goods that can be imported. Tariffs are widely used as tools of protectionism, along with trade barriers and import quotas.
Although tariffs and taxes both generate government revenue to fund public goods and services, they have several distinctions. Tariffs are prepaid at the port of entry, while taxes are paid at the time of purchase. Taxes are imposed on individual taxpayers and businesses, while tariffs are paid by importers.
There are two schools of thought among economists regarding the usage of tariffs. While some argue that tariffs are necessary to protect domestic industries and address trade imbalances, others see them as a harmful tool that could potentially drive prices higher over the long term and lead to a damaging trade war by encouraging tit-for-tat tariffs.
During the run-up to the presidential election in November 2024, Donald Trump made it clear that he intends to use tariffs to support the US economy and American producers. In 2024, Mexico, China and Canada accounted for 42% of total US imports. In this period, Mexico stood out as the top exporter with $466.6 billion, according to the US Census Bureau. Hence, Trump wants to focus on these three nations when imposing tariffs. He also plans to use the revenue generated through tariffs to lower personal income taxes.
A descending trend channel has been added to the chart as today’s high was also close to that line. And it will be closer to price action tomorrow. The price area around the line will either show signs of resistance or a breakout through the line will occur. But regardless of which, subsequent price behavior should be more revealing.
Given the pattern within the declining channel and the drop below the 50-Day MA yesterday, it seems like lower prices may be tested as support before the correction is complete. However, the short-term outlook could change if there is a decisive breakout above today’s high and then a daily close above the trendline and the 50% retracement level at $5.95, which represented support recently on the way down.
Notice that the price of natural gas is now near the top of the trend channel. If a decline below today’s low is triggered that could be enough to accelerate the bearish correction. In general, once price reverses from one side of the channel there is a tendency to start to move toward the other side, which is the lower channel line. Regardless of whether natural gas eventually falls to the lower channel line, it implies lower prices.
Although the next potential support zone is around the early-March interim swing low at $3.74, the progression of the bear trend may be strong enough to fall through it. If that occurs, then the next lower uptrend line is the area to watch for support and the integrity of the uptrend that the line is associated with.
For a look at all of today’s economic events, check out our economic calendar.
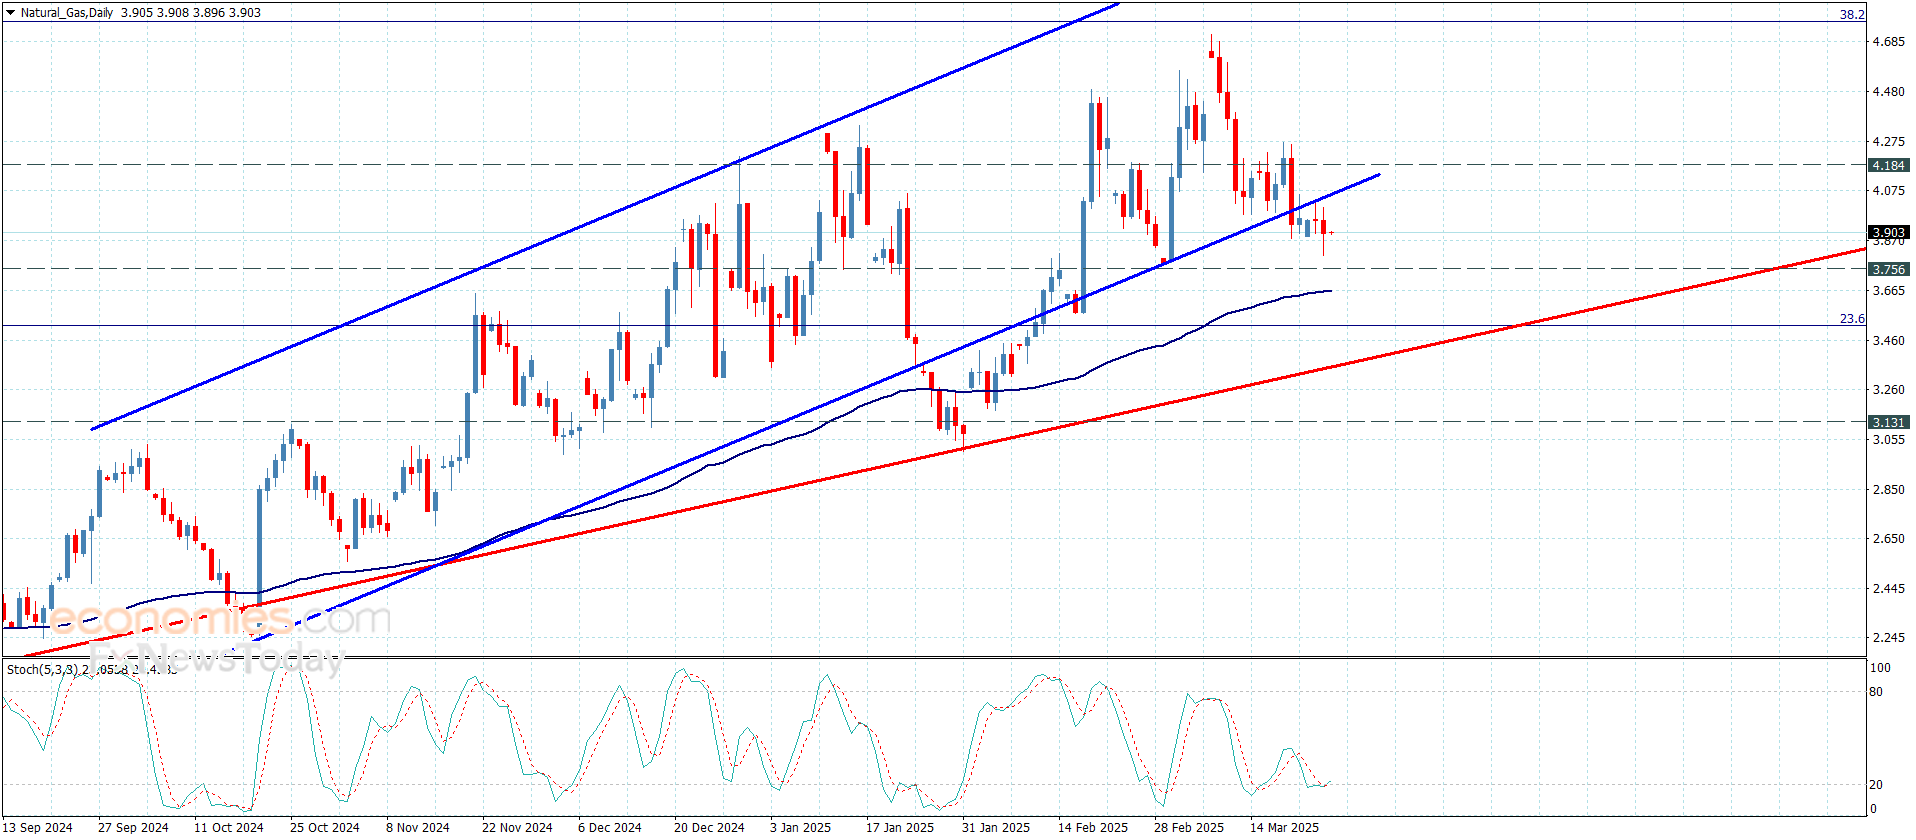
Natural gas prices fell and hit $3.810, thus approaching the support of $3.750, which is the key for deciding the overall trend in the near and medium term.
The price is now approaching the 55-day SMA support, which would reinforce its stability, while the Stochastic sends out positive signals, which boost the price further towards the resistance of $4.050, then $4.180.
Expected trading range today is between $3.750 and $4.050.
Today’s price forecast: Bullish as the support holds
Silver price (XAG/USD) holds onto gains near $33.80 in European trading hours on Wednesday. The white metal shows resilience as market participants are cautious over the United States (US) economic outlook under the leadership of President Donald Trump.
Fears of imposition of potential tariffs by Donald Trump on April 2 have dented the confidence of households in the economy. The US Conference Board reported on Tuesday that the Consumer Confidence, a leading indicator of individuals’ confidence in economic prospects, declined to 92.9, significantly lower than 100.1 seen in February. The scenario of heightened economic uncertainty often leads to an increase in the safe-haven demand of non-yielding assets, such as Silver.
However, Trump has teased that not all impending tariffs will come into effect on April 2 as he may give a “lot of countries” breaks on tariffs.
Meanwhile, the US Dollar Index (DXY), which tracks the Greenback’s value against six major currencies, trades sideways around the three-week high of 104.50. The US Dollar is expected to trade cautiously as investors expect Trump’s economic policies could result in an economic slowdown and a resurgence in inflationary pressures in the US economy.
This week, the major trigger for the US Dollar will be the US Personal Consumption Expenditure Price Index (PCE) data for February, which will be released on Friday. The inflation data will influence market expectations for the Federal Reserve’s (Fed) monetary policy outlook. The Silver price carries an inverse relationship with the degree of US interest rates.
Silver price strives to revisit the flat border of the Ascending Triangle chart pattern formation on the daily timeframe near the October 22 high of $34.87. The upward-sloping border of the above-mentioned chart pattern is placed from the August 8 low of $26.45. Technically, the Ascending Triangle pattern indicates indecisiveness among market participants.
The 20-day Exponential Moving Average (EMA) near $33.10 continues to provide support to the Silver price.
The 14-day Relative Strength Index (RSI) rebounds above 60.00, suggesting a resurgence in bullish momentum.
Looking down, the March 6 high of $32.77 will act as key support for the Silver price. While, the October 22 high of $34.87 will be the major barrier.
Silver is a precious metal highly traded among investors. It has been historically used as a store of value and a medium of exchange. Although less popular than Gold, traders may turn to Silver to diversify their investment portfolio, for its intrinsic value or as a potential hedge during high-inflation periods. Investors can buy physical Silver, in coins or in bars, or trade it through vehicles such as Exchange Traded Funds, which track its price on international markets.
Silver prices can move due to a wide range of factors. Geopolitical instability or fears of a deep recession can make Silver price escalate due to its safe-haven status, although to a lesser extent than Gold’s. As a yieldless asset, Silver tends to rise with lower interest rates. Its moves also depend on how the US Dollar (USD) behaves as the asset is priced in dollars (XAG/USD). A strong Dollar tends to keep the price of Silver at bay, whereas a weaker Dollar is likely to propel prices up. Other factors such as investment demand, mining supply – Silver is much more abundant than Gold – and recycling rates can also affect prices.
Silver is widely used in industry, particularly in sectors such as electronics or solar energy, as it has one of the highest electric conductivity of all metals – more than Copper and Gold. A surge in demand can increase prices, while a decline tends to lower them. Dynamics in the US, Chinese and Indian economies can also contribute to price swings: for the US and particularly China, their big industrial sectors use Silver in various processes; in India, consumers’ demand for the precious metal for jewellery also plays a key role in setting prices.
Silver prices tend to follow Gold’s moves. When Gold prices rise, Silver typically follows suit, as their status as safe-haven assets is similar. The Gold/Silver ratio, which shows the number of ounces of Silver needed to equal the value of one ounce of Gold, may help to determine the relative valuation between both metals. Some investors may consider a high ratio as an indicator that Silver is undervalued, or Gold is overvalued. On the contrary, a low ratio might suggest that Gold is undervalued relative to Silver.
May arabica coffee (KCK25) today is down -4.90 (-1.23%), and May ICE robusta coffee (RMK25) is down -80 (-1.43%).
Coffee prices today erased an early rally and turned lower after meteorologist Climatempo forecast widespread showers for Brazil’s coffee-growing regions later this week.
Commodity Bulletin: From crude oil to coffee, this FREE newsletter is for industry pros and rookies alike
Coffee prices today initially moved higher, with arabica posting a 2-1/2 week high on weather concerns in Brazil and Vietnam. Cooxupe, Brazil’s largest arabica coffee co-operative, said high temperatures and below-normal rainfall last month in Brazil would negatively affect coffee yields this year. Brazil is the world’s largest producer of arabica coffee. Also, the Dak Lak weather office said last Friday that Vietnam’s main coffee-producing region, Central Highlands, is expected to get more hot weather and less rainfall for the March 21-31 period. Vietnam is the world’s largest producer of robusta coffee.
Continued supply fears are supporting coffee prices. On March 13, Cecafe reported that Brazil’s February green coffee exports fell -12% y/y to 3 million bags. Also, on January 28, Conab, Brazil’s government crop forecasting agency, forecasted that Brazil’s 2025/26 coffee crop would fall -4.4% y/y to a 3-year low of 51.81 million bags. Conab also cut its 2024 Brazil coffee crop estimate by -1.1% to 54.2 million bags from a September estimate of 54.8 million bags.
The current coffee inventory situation is mixed. ICE-monitored robusta coffee inventories rose to a 7-week high Tuesday of 4,414 lots. Conversely, ICE-monitored arabica coffee inventories fell to a 1-month low last Friday of 777,708 bags.
On the negative side for coffee, Marex Solutions said on March 7 that they expect the global coffee surplus in the 2025/26 season to widen to 1.2 million bags from +200,000 bags in the 2024/25 season.
Recent higher-than-normal rainfall in Brazil eases dry conditions and is negative for prices. Somar Meteorologia reported Monday that Brazil’s biggest arabica coffee growing area of Minas Gerais received 31.2 mm of rain in the week ended March 22, or 102% of the historical average.
A bearish factor for robusta coffee was the March 6 report from Vietnam’s General Statistics Office that showed Vietnam’s Feb coffee exports rose +6.6% y/y to 169,000 MT.
The impact of dry El Nino weather last year may lead to longer-term coffee crop damage in South and Central America. Rainfall in Brazil has consistently been below average since last April, damaging coffee trees during the all-important flowering stage and reducing the prospects for Brazil’s 2025/26 arabica coffee crop. Brazil has been facing the driest weather since 1981, according to the natural disaster monitoring center Cemaden. Also, Colombia, the world’s second-largest arabica producer, is slowly recovering from the El Nino-spurred drought last year.
Robusta coffee prices are underpinned by reduced robusta production. Due to drought, Vietnam’s coffee production in the 2023/24 crop year dropped by -20% to 1.472 MMT, the smallest crop in four years. The USDA FAS on May 31 projected that Vietnam’s robusta coffee production in the new marketing year of 2024/25 will dip slightly to 27.9 million bags from 28 million bags in the 2023/24 season. In addition, Vietnam’s General Statistics Office reported on January 10 that 2024 Vietnam coffee exports fell -17.1% y/y to 1.35 MMT. Also, the Vietnam Coffee and Cocoa Association on March 12 cut its 2024/25 Vietnam coffee production estimate to 26.5 million bags from a December estimate of 28 million bags.
News of larger global coffee exports is bearish for prices. Conab reported on February 4 that Brazil’s 2024 coffee exports rose +28.8% y/y to a record 50.5 million bags. However, ICO reported on February 6 that Dec global coffee exports fell -12.4% y/y to 10.73 million bags, and Oct-Dec global coffee exports fell -0.8% y/y to 32.25 million bags.
The USDA’s biannual report on December 18 was mixed for coffee prices. The USDA’s Foreign Agriculture Service (FAS) projected that world coffee production in 2024/25 will increase +4.0% y/y to 174.855 million bags, with a +1.5% increase in arabica production to 97.845 million bags and a +7.5% increase in robusta production to 77.01 million bags. The USDA’s FAS forecasts that 2024/25 ending stocks will fall by -6.6% to a 25-year low of 20.867 million bags from 22.347 million bags in 2023/24. Separately, the USDA’s FAS on November 22 projected Brazil’s 2024/25 coffee production at 66.4 MMT, below its previous forecast of 69.9 MMT. The USDA’s FAS projects Brazil’s coffee inventories at 1.2 million bags at the end of the 2024/25 season in June, down -26% y/y.
For the 2025/26 marketing year, Volcafe on December 17 cut its 2025/26 Brazil arabica coffee production estimate to 34.4 million bags, down by about 11 million bags from a September estimate after a crop tour revealed the severity of an extended drought in Brazil. Volcafe projects a global 2025/26 arabica coffee deficit of -8.5 million bags, wider than the -5.5 million bag deficit for 2024/25 and the fifth consecutive year of deficits.
On the date of publication, Rich Asplund did not have (either directly or indirectly) positions in any of the securities mentioned in this article. All information and data in this article is solely for informational purposes. For more information please view the Barchart Disclosure Policyhere.
More news from Barchart
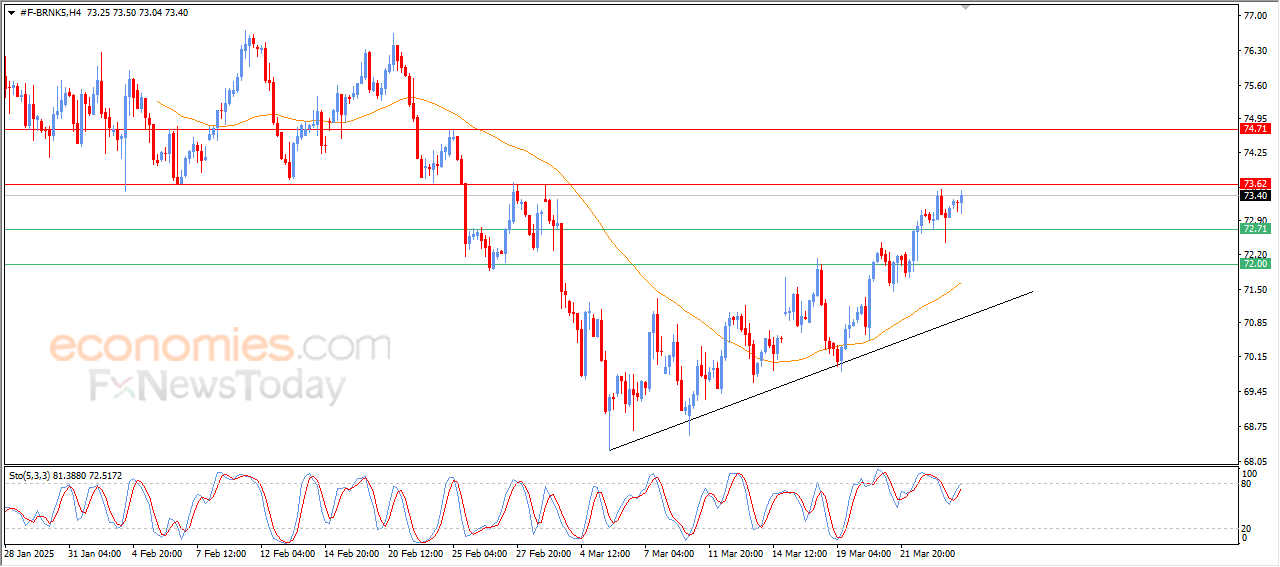
Brent crude oil price rose in latest intraday trading, while readying to attack the pivotal resistance of $73.60, after managing to vent off overbought saturation that was apparent in the Stochastic, with positive signals emerging from it once more, amid the dominance of the upward correctional trend in the short term as the price moves alongside the trend line.
To get our more detailed analysis and 100% accurate signals provided by Best Trading Signal, subscribe to Economies.com VIP Club through the link below!
Gold price is consolidating the previous rebound above $3,000 early Wednesday, gathering pace before the next push higher. The focus is back on US tariffs and their impact on the global economies, enhancing the safe-haven appeal of Gold price.
US President Donald Trump is reportedly set to impose three escalating levels of tariffs, with Canada likely to be on the lower end of the April 2 tariffs, per the Toronto Star. Trump later clarified that “all we’re going to do is reciprocal,” adding that “not many exceptions on April 2 tariffs.”
At the same time, Bloomberg News reported that the US President “plans to implement copper import tariffs within weeks.”
These renewed tariff threats rekindled US economic concerns, keeping the US Dollar (USD) upside in check as investors sought refuge in the traditional safe-haven of Gold price.
Earlier this week, fears over a US economic slowdown were doused after the release of a stronger-than-expected S&P Global flash US Composite PMI Output Index. The gauge which tracks the manufacturing and services sectors, jumped to 53.5 this month from 51.6 in February.
That said, the further upside in Gold price appears intact as markets reposition, bracing for the April 2 reciprocal tariffs. However, if the US Durable Goods Orders data exceeds estimates by a wide margin, it could reinforce expectations for one interest rate cut by the US Federal Reserve (Fed) this year, fuelled by the upbeat PMI data on Monday.
The less dovish Fed narrative could cap the Gold price rebound while taking cues on policy from several Fed officials, who are due to speak later on Wednesday.
Also of note remains the geopolitical developments surrounding the Ukraine peace deal. The US on Tuesday reached deals with Ukraine and Russia to pause their attacks at sea and against energy targets, with Washington agreeing to push to lift some sanctions against Moscow. However, Ukrainian President Volodymyr Zelensky stated that he would seek US President Trump’s support in providing weapons and imposing sanctions on Russia if Moscow violated the agreements.
The technical setup on the daily chart favors buyers, with their sights set on the ascending triangle target, measured at $3,080.
The 14-day Relative Strength Index (RSI) is trending higher, currently at 66, which justifies the bullish momentum.
Gold price remains poised to take out the record high of $3,058 on the way to achieving the triangle target of $3,080.
Alternatively, the $3,000 round level will emerge as a powerful support. The next downside cap is aligned at the previous week’s low of $2,982.
Further south, the 21-day Simple Moving Average (SMA) and the triangle support confluence at $2,958 will be a tough nut to crack for sellers.
Tariffs are customs duties levied on certain merchandise imports or a category of products. Tariffs are designed to help local producers and manufacturers be more competitive in the market by providing a price advantage over similar goods that can be imported. Tariffs are widely used as tools of protectionism, along with trade barriers and import quotas.
Although tariffs and taxes both generate government revenue to fund public goods and services, they have several distinctions. Tariffs are prepaid at the port of entry, while taxes are paid at the time of purchase. Taxes are imposed on individual taxpayers and businesses, while tariffs are paid by importers.
There are two schools of thought among economists regarding the usage of tariffs. While some argue that tariffs are necessary to protect domestic industries and address trade imbalances, others see them as a harmful tool that could potentially drive prices higher over the long term and lead to a damaging trade war by encouraging tit-for-tat tariffs.
During the run-up to the presidential election in November 2024, Donald Trump made it clear that he intends to use tariffs to support the US economy and American producers. In 2024, Mexico, China and Canada accounted for 42% of total US imports. In this period, Mexico stood out as the top exporter with $466.6 billion, according to the US Census Bureau. Hence, Trump wants to focus on these three nations when imposing tariffs. He also plans to use the revenue generated through tariffs to lower personal income taxes.
Natural gas prices fell and hit $3.810, thus approaching the support of $3.750, which is the key for deciding the overall trend in the near and medium term.
The price is now approaching the 55-day SMA support, which would reinforce its stability, while the Stochastic sends out positive signals, which boost the price further towards the resistance of $4.050, then $4.180.
Expected trading range today is between $3.750 and $4.050.
Today’s price forecast: Bullish as the support holds
Natural gas prices fell and hit $3.810, thus approaching the support of $3.750, which is the key for deciding the overall trend in the near and medium term.
The price is now approaching the 55-day SMA support, which would reinforce its stability, while the Stochastic sends out positive signals, which boost the price further towards the resistance of $4.050, then $4.180.
Expected trading range today is between $3.750 and $4.050.
Today’s price forecast: Bullish as the support holds