The main tag of Gold Price Articles.
You can use the search box below to find what you need.
[wd_asp id=1]
The main tag of Gold Price Articles.
You can use the search box below to find what you need.
[wd_asp id=1]
December arabica coffee (KCZ24) today is down -1.05 (-0.39%), and November ICE robusta coffee (RMX24) is down -10 (-0.18%).
Coffee prices today are posting modest losses. Forecasts for substantial showers for the Minas Gerais region in Brazil at the end of this week have eased Brazil’s drought concerns and are undercutting coffee prices.
Last Thursday, Dec arabica coffee soared to a 13-year nearest-futures high, and Nov robusta rose to a contract high. Coffee prices have seen strength as adverse weather in key coffee-producing countries threatens global coffee production.
Brazil has been facing the driest weather since 1981, according to the natural disaster monitoring center Cemaden. Rainfall in Brazil has consistently been below average since April, damaging coffee trees during the all-important flowering stage and reducing the prospects for Brazil’s 2025/26 arabica coffee crop. Somar Meteorologia reported today that Brazil’s Minas Gerais region received no rain over the past week, or 0% of the historical average. Minas Gerais accounts for about 30% of Brazil’s arabica crop.
Robusta coffee prices are underpinned by fears that excessive dryness in Vietnam will damage coffee crops and curb future global robusta production. Vietnam’s agriculture department said on March 26 that Vietnam’s coffee production in the 2023/24 crop year dropped by -20% to 1.472 MMT, the smallest crop in four years, due to drought. The USDA FAS on May 31 projected that Vietnam’s robusta coffee production in the new marketing year of 2024/25 will dip slightly to 27.9 million bags from 28 million bags in the 2023/24 season. Last Wednesday, the General Department of Vietnam Customs reported that Vietnam’s August coffee exports fell -9.9% y/y to 76,214 MT and that Vietnam’s Jan-Aug coffee exports fell -12.1% y/y to 1.06 MMT.
A supportive factor for coffee was the action by Conab, Brazil’s crop forecasting agency, to cut its 2024 Brazil coffee production forecast on September 19 to 54.8 million bags from 58.8 million bags forecast in May.
On September 10, Cecafe reported that Brazil’s Aug green coffee exports rose +1.4% y/y to 3.41 million bags. The rise in Brazil’s green coffee exports was consistent with other recent news showing higher exports. The Brazilian Trade Ministry reported on August 7 that Brazil’s July coffee exports rose +44% y/y to 202,000 MT. Also, Cecafe reported on July 11 that Brazil’s 2023/24 coffee exports rose +33% y/y to a record 47.3 million bags. On a global basis, the International Coffee Organization (ICO) reported on September 6 that global coffee exports rose +12.2% y/y in July to 11.29 million bags and that global exports during Oct-July rose +10.5% y/y to 115.01 million bags.
A rebound in ICE coffee inventories from historically low levels is negative for prices. On September 12, ICE-monitored arabica coffee inventories rose to a 1-1/2 year high of 858,474 bags, up from the 24-year low of 224,066 bags posted in November 2023. Also, ICE-monitored robusta coffee inventories on July 25 rose to a 1-year high of 6,521 lots, up from the record low of 1,958 lots posted in February 2024.
In a bearish factor, the International Coffee Organization (ICO) said on May 3 that 2023/24 global coffee production climbed +5.8% y/y to 178 million bags due to an exceptional off-biennial crop year. ICO also said global 2023/24 coffee consumption rose +2.2% y/y to 177 million bags, resulting in a 1 million bag coffee surplus.
The USDA’s bi-annual report on June 20 was bearish for coffee prices. The USDA’s Foreign Agriculture Service (FAS) projected that world coffee production in 2024/25 will increase +4.2% y/y to 176.235 million bags, with a +4.4% increase in arabica production to 99.855 million bags and a +3.9% increase in robusta production to 76.38 million bags. The USDA’s FAS forecasts that 2024/25 ending stocks will climb by +7.7% to 25.78 million bags from 23.93 million bags in 2023/24. The USDA’s FAS projects that Brazil’s 2024/25 arabica production would climb +7.3% y/y to 48.2 mln bags due to higher yields and increased planted acreage. The USDA’s FAS also forecasts that 2024/54 coffee production in Colombia, the world’s second-largest arabica producer, will climb +1.6% y/y to 12.4 mln bags.
On the date of publication,
did not have (either directly or indirectly) positions in any of the securities mentioned in this article. All information and data in this article is solely for informational purposes. For more information please view the Barchart Disclosure Policy
here.
Gold price is down for a second consecutive day, trading at around $2,635 in the mid-American session. The bright metal eased despite a mixed market mood. Generally speaking, financial markets are optimistic amid easing interest rates among major economies. Investors also welcomed Chinese stimulus measures announced last week aimed at reviving the battered economy.
Nevertheless, stock markets are struggling at the beginning of the new week. Most Asian indexes closed in the green, although Japanese ones edged lower following news that former Defense Chief Shigeru Ishiba won the Liberal Democratic Party’s (LDP) presidential election. The upcoming Prime Minister is expected to favor interest rate hikes by the Bank of Japan (BoJ), hurting stocks demand.
Meanwhile, European indexes edged lower amid tepid news from the automakers´ sector, as big names paint a gloomy earnings picture ahead. As a result, United States (US) indexes trade with losses, supporting US Dollar’s advance against most major rivals.
In the upcoming days, however, the focus will move away from stocks and centre around US employment data. The country will publish the JOLTS Job Opening report and the ADP National Employment Report on private job creation ahead of the Nonfarm Payrolls (NFP) release on Friday. The labor market situation in the US may become less of a concern after the Federal Reserve (Fed) delivered a 50 basis points (bps) rate cut when it met in September.
Finally, it’s worth remembering that China celebrates the Golden Week starting on Tuesday, October 1, which means local markets will remain closed for the rest of the week, limiting price action after Wall Street closes.
From a technical point of view, the daily chart for the XAU/USD pair shows the recent decline could be categorised as corrective, yet with scope to keep declining in the next few days. Technical indicators have abandoned overbought territory and head firmly south, although well into positive territory. At the same time, moving averages maintain their firm bullish slopes far below the current level, limiting the mid-term bearish potential of Gold. The 20 Simple Moving Average (SMA) currently stands at around $2,575, and an approach to it should attract buyers.
In the near term, and according to the 4-hour chart, the risk also skews to the downside. XAU/USD has broken below a now mildly bearish 20 SMA while holding above bullish 100 and 200 SMAs. Technical indicators, in the meantime, have fallen well into negative territory, maintaining uneven bearish strength. The daily low at $2,628.66 offers immediate support.
Support levels: 2,628.60 2,611.90 2,598.70
Resistance levels: 2,653.70 2,665.95 2,685.45
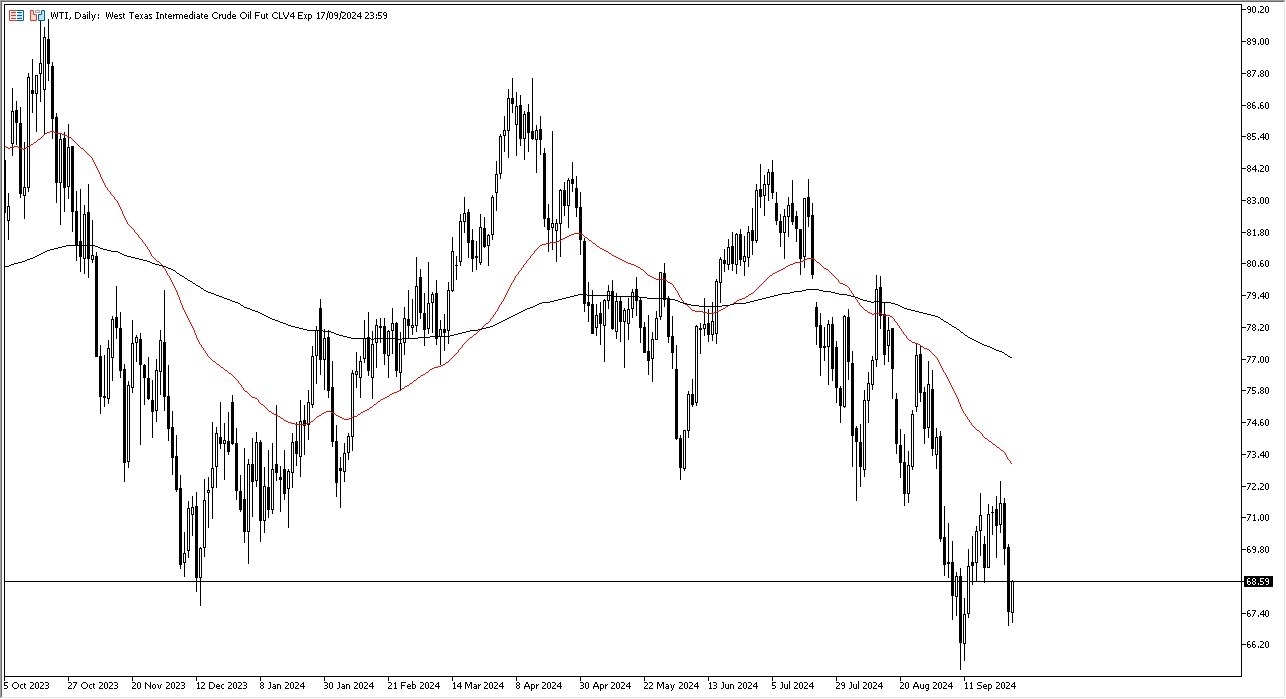
The technical analysis for the crude oil market is a bit of a mixed bag. Quite frankly, we are getting very close to a major support level for the last 2 years, and I think that is something worth paying attention to. However, if we do rally from here the $72.25 level should offer a significant amount of resistance, especially as we have just seen the market selloff from that level. Above there, we have the 50 Day EMA that comes into the picture and offers resistance also, so I think you’ve got a tuition where you could very well see a “fade the rally” type of market.

If we do break down from here, pay close attention to the $66 level. Anything below there could send the market reeling, as the $65 level would suddenly come into focus. After that level, then you have the bottom falling out and that suggests that we could end up having a very negative turn of events when it comes to risk appetite and demand. With that being the case, I think you’ve got a scenario where market participants continue to look at this as a situation where the volatility remains somewhat elevated, but at the end of the day, I don’t think there’s a whole lot here to the downside left, just simply because we are at such extraordinarily low levels for the last couple of years. If we can break above the 50 Day EMA, then I think this market becomes bullish all of the sudden.
Ready to trade Forex daily analysis and predictions? Here are the best Oil trading brokers to choose from.
Gold price is holding the previous corrective downside near $2,650 in Asian trades on Monday, shrugging off another Chinese stimulus-driven upbeat market sentiment. Traders refrain from placing fresh directional bets on Gold price ahead of US Federal Reserve (Fed) Jerome Powell’s speech due later on Monday.
During his last Thursday’s opening remarks at the US Treasury Market Conference, Fed Chair Powell did not speak about the economic and monetary policy outlook. Therefore, traders keenly await Powell’s appearance for fresh hints on the size of the potential interest rate cut in November.
Markets are currently pricing in a 52% chance of a 50 basis points (bps) rate reduction in November, the CME Group’s FedWatch Tool shows, slightly up from a 50% probability seen a week ago. Friday’s core Personal Consumption Expenditures (PCE) Price Index, the Fed’s preferred inflation measure, did little to alter the market’s expectations for the next Fed rate cut.
The headline PCE price index rose 0.1% for the month, putting the annual inflation rate at 2.2%. The core PCE Price Index increased by 2.7% YoY, as expected while the monthly core inflation ticked down to 0.1%, against the previous reading of 0.2%. The annual core PCE moved closer to the central bank’s 2% target in August, exacerbating the US Dollar’s (USD) pain.
However, Gold price failed to take advantage of the USD weakness and corrected from record highs of $2,686 reached last Thursday, as investors resorted to profit-taking heading into the US Nonfarm Payrolls week. Further, the month-end and quarter-end flows came into play, weighing negatively on Gold price.
In Monday’s trading so far, Gold price remains in the red, despite the renewed Middle East geopolitical escalation and additional Chinese stimulus measures.
Over the weekend, Israel continued to strike Lebanon and claimed to have killed another senior Hezbollah figure after the killing of leader Hassan Nasrallah. Iran, which backs the powerful militant group, vowed to strike back, noting that Nasrallah’s killing “will not go unanswered.”
Meanwhile, China announced more stimulus measures, with the nation’s central bank calling on the banks to lower mortgage rates for existing home loans by the end of October, likely by 50 bps on average.
The latest Chinese stimulus-driven optimism was partly dented by disappointing China’s business PMI data for September. China’s official Manufacturing PMI came in at 49.8, slightly better than the 49.5 forecast. However, the country’s Caixin Manufacturing PMI returned to contraction, arriving at 49.3 in the same period vs. August’s 50.4.
Gold price has eased from extremely overbought territory, with the 14-day Relative Strength Index (RSI) currently looks to enter the bullish zone near 71.
If buyers jump back on the bids, the previous high at $2,674 will be the initial content point, above which the record high of $2,686 will be tested.
A strong foothold above the all-time high is needed to take on the $2,700 barrier, followed by the rising trendline resistance at $2,710.
On the flip side, if the correction picks up pace, Gold price will likely test the September 24 low of $2,623, below which the $2,600 threshold will come into play.
Further south, Gold sellers could target the September 20 low of $2,585.
Jerome H. Powell took office as a member of the Board of Governors of the Federal Reserve System on May 25, 2012, to fill an unexpired term. On November 2, 2017, President Donald Trump nominated Powell to serve as the next Chairman of the Federal Reserve. Powell assumed office as Chair on February 5, 2018.
Next release: Mon Sep 30, 2024 17:00
Frequency: Irregular
Consensus: –
Previous: –
Source: Federal Reserve
Throughout the week, economic data releases further supported the case for continued rate cuts. The Personal Consumption Expenditures (PCE) price index—a critical measure of inflation—rose 0.1% month-over-month in August and 2.2% year-over-year, slightly below economists’ expectations of 2.3%. The core PCE index, which excludes food and energy, also rose by 0.1% for the month and 2.7% year-over-year, in line with forecasts. These inflation readings reinforced the outlook that the Fed could cut rates again by the end of the year, as inflation remains close to the central bank’s 2% target.
Meanwhile, jobless claims fell more than expected, and durable goods orders remained flat, further indicating resilience in the U.S. economy despite the Fed’s aggressive rate cuts.
In addition to the Fed’s actions, ongoing geopolitical tensions, particularly in the Middle East, provided strong support for gold prices. Conflict between Israel and Hezbollah escalated last week, with Israeli airstrikes in Lebanon further heightening risk sentiment. Investors seeking refuge from potential global instability increased their exposure to gold, pushing demand higher. Analysts expect these geopolitical risks to persist, keeping gold’s safe-haven appeal intact.
Another key factor driving gold’s rally has been the return of inflows into gold-backed exchange-traded funds (ETFs)
Silver price (XAG/USD) extends its correction to near $31.60 in Friday’s European session after facing selling pressure from fresh highs of $32.70 on Thursday. The white metal comes under pressure as investors turn cautious ahead of the United States (US) Personal Consumption Expenditure Price Index (PCE) for August, which will be published at 12:30 GMT.
Economists estimate the core PCE price index, a Federal Reserve’s (Fed) preferred inflation measure, to have grown by 2.7%, faster than 2.6% in July, with monthly figures rising steadily by 0.2%. Investors keenly await the US inflation data as it will shape market speculation for the Fed’s likely policy action in the final quarter of this year.
According to the CME FedWatch tool, the central bank is expected to reduce its key borrowing rates further by 75 bps in the remaining two meetings this year, suggesting that there will be one 50 bps and one 25 bps rate cut. 30-day Federal fund futures pricing data shows that traders are equally split over a 25 or 50 bps interest rate cut in November.
Meanwhile, the US Dollar Index (DXY), which tracks the Greenback’s value against six major currencies, surrenders its early gains and hovers above 100.50. 10-year US Treasury yields edge lower to 3.79%.
Silver price falls slightly after posting a fresh decade high near $32.70. The white metal is under pressure ahead of key inflation data. However, its near-term outlook is bullish as all short-to-long-term Exponential Moving Averages (EMAs) are sloping higher.
The 14-day Relative Strength Index (RSI) oscillates in the bullish range of 60.00-80.00, suggesting a strong bullish momentum.
(This story was corrected on September 27 at 11:49 GMT to say that US core PCE inflation is expected to accelerate to 2.7%, not accelerated to 2.7%, nor has it grown by 2.37%.)
Silver is a precious metal highly traded among investors. It has been historically used as a store of value and a medium of exchange. Although less popular than Gold, traders may turn to Silver to diversify their investment portfolio, for its intrinsic value or as a potential hedge during high-inflation periods. Investors can buy physical Silver, in coins or in bars, or trade it through vehicles such as Exchange Traded Funds, which track its price on international markets.
Silver prices can move due to a wide range of factors. Geopolitical instability or fears of a deep recession can make Silver price escalate due to its safe-haven status, although to a lesser extent than Gold’s. As a yieldless asset, Silver tends to rise with lower interest rates. Its moves also depend on how the US Dollar (USD) behaves as the asset is priced in dollars (XAG/USD). A strong Dollar tends to keep the price of Silver at bay, whereas a weaker Dollar is likely to propel prices up. Other factors such as investment demand, mining supply – Silver is much more abundant than Gold – and recycling rates can also affect prices.
Silver is widely used in industry, particularly in sectors such as electronics or solar energy, as it has one of the highest electric conductivity of all metals – more than Copper and Gold. A surge in demand can increase prices, while a decline tends to lower them. Dynamics in the US, Chinese and Indian economies can also contribute to price swings: for the US and particularly China, their big industrial sectors use Silver in various processes; in India, consumers’ demand for the precious metal for jewellery also plays a key role in setting prices.
Silver prices tend to follow Gold’s moves. When Gold prices rise, Silver typically follows suit, as their status as safe-haven assets is similar. The Gold/Silver ratio, which shows the number of ounces of Silver needed to equal the value of one ounce of Gold, may help to determine the relative valuation between both metals. Some investors may consider a high ratio as an indicator that Silver is undervalued, or Gold is overvalued. On the contrary, a low ratio might suggest that Gold is undervalued relative to Silver.
Silver prices dropped on Friday, finishing the session down by more than 1% after hitting a yearly record high of $32.71 on September 26. Buyers’ failure to cling to gains above $32.00 exacerbated the drop toward $31.60, but they held to weekly profits of over 1.50%.
Silver is upward biased amid dipping to a four-day low of $31.37, but a daily close below the July 13 peak of $31.75 opens the scope to trade within the $31.00-$31.70 range.
The Relative Strength Index (RSI) remains bullish, but in the short term, sellers could push prices toward the September 23 low of $30.36. On further weakness, the next stop would be the 50-day moving average (DMA) at $29.64.
Conversely, if XAG/USD climbs back above $32.00, this could pave the way to test the YTD high of $32.71 before challenging $33.00 ahead of the October 1, 2012, peak at $35340.
Silver is a precious metal highly traded among investors. It has been historically used as a store of value and a medium of exchange. Although less popular than Gold, traders may turn to Silver to diversify their investment portfolio, for its intrinsic value or as a potential hedge during high-inflation periods. Investors can buy physical Silver, in coins or in bars, or trade it through vehicles such as Exchange Traded Funds, which track its price on international markets.
Silver prices can move due to a wide range of factors. Geopolitical instability or fears of a deep recession can make Silver price escalate due to its safe-haven status, although to a lesser extent than Gold’s. As a yieldless asset, Silver tends to rise with lower interest rates. Its moves also depend on how the US Dollar (USD) behaves as the asset is priced in dollars (XAG/USD). A strong Dollar tends to keep the price of Silver at bay, whereas a weaker Dollar is likely to propel prices up. Other factors such as investment demand, mining supply – Silver is much more abundant than Gold – and recycling rates can also affect prices.
Silver is widely used in industry, particularly in sectors such as electronics or solar energy, as it has one of the highest electric conductivity of all metals – more than Copper and Gold. A surge in demand can increase prices, while a decline tends to lower them. Dynamics in the US, Chinese and Indian economies can also contribute to price swings: for the US and particularly China, their big industrial sectors use Silver in various processes; in India, consumers’ demand for the precious metal for jewellery also plays a key role in setting prices.
Silver prices tend to follow Gold’s moves. When Gold prices rise, Silver typically follows suit, as their status as safe-haven assets is similar. The Gold/Silver ratio, which shows the number of ounces of Silver needed to equal the value of one ounce of Gold, may help to determine the relative valuation between both metals. Some investors may consider a high ratio as an indicator that Silver is undervalued, or Gold is overvalued. On the contrary, a low ratio might suggest that Gold is undervalued relative to Silver.
As discussed previously in this column, natural gas has been tracing out a symmetrical triangle consolidation pattern for over six months. The first lower boundary line rises from the February trend low, but a new and higher bottom line was added once the late-August higher swing low was established.
Once price reverses from the low end of a consolidation pattern, the chance for a move to the opposite side of the pattern increases. Support was successfully tested at the low end of the natural gas symmetrical triangle at the late-August low. The subsequent rally opened the possibility of an eventual test of resistance at the top downtrend line.
Today’s high may be that test as natural gas is very close to the top trendline. So far today, it has found resistance at the interim swing high from May 23. However, given the clear bullish momentum that has followed the drop below yesterday’s low from earlier today, the top trendline may be hit in the coming days or a breakout through the line could occur. Today is likely to end with a wide range green candle and the close is on track to be strong, in the top quarter of the day’s trading range, which also means it closes near the highs for the week.
Since upward momentum began after price was rejected to the upside from the 200-Day MA support area last week, a breakout above the trendline in the coming days may not see enough buying pressure to continue to support higher prices in natural gas before a pause or retracement. There is also a good chance the top line will retain resistance and lead to a retracement before an attempt at an upside breakout occurs. Keep in mind that such a move would also trigger a bullish breakout of the triangle formation as well as a trendline. Nonetheless, other than prior swing highs the first higher target looks to be around 3.45.
For a look at all of today’s economic events, check out our economic calendar.
The natural gas markets have rallied significantly during the course of the trading session on Friday, as we have broken above the $3 level, at least initially. That being said, there is a massive amount of resistance above as we had formed a double top back in June, so it’ll be interesting to see if we can get above there. The Relative Strength Index is in an overbought condition, so that also comes into the picture, but really when I look at this, the thing that I would pay the most attention to isn’t even on the chart. It’s the hurricane that just ripped through the Gulf of Mexico area.
The question is, did that damage and slow down production enough to drive prices higher? Probably in the short term, but I do recognize that we are getting much closer to the end of this run than we were at the beginning. I took profit yesterday, I’m okay with that. I don’t have any reason to chase this. If we break out to the upside, so be it, I’ll wave goodbye to the trend. Ultimately though, I do think we are about to hit a bit of a brick wall when it comes to resistance, and I think in that environment, you have to be very cautious.
Gold price treads water while within a striking distance of the new record high of $2,686, as buyers take a breather and consolidate the weekly gains in the countdown to the US Personal Consumption Expenditures (PCE) Price Index data release later on Friday.
Despite the recent dovish comments from US Federal Reserve (Fed) policymakers and mixed US economic data, market expectations for a 50 basis points (bps) interest rate cut in November ease, with the odds of such a move now standing at 50%, down from about 62% seen a day ago, the CME Group’s FedWatch Tool shows.
Fading bets of an outsized Fed rate cut at the next meeting seem to fuel a fresh US Dollar (USD) recovery, checking the record-setting rally in Gold price. However, Fed Governor Lisa Cook’s dovish remarks overnight and a risk-on market profile, courtesy of fresh Chinese stimulus measures, continue to limit the Gold price downside.
The next directional move in Gold price and the expectations of a large November Fed rate cut hinge on the upcoming Fed’s most preferred inflation gauge, the core PCE Price Index, due later in American trading on Friday. The US core PCE inflation is seen steady at 0.2% MoM in August while annually, the index is likely to tick higher a bit to 2.7% in the same period from July’s 2.6%.
A hotter-than-expected core PCE inflation data could push back expectations against a November rate reduction by the Fed, initiating a sustained recovery in the US Dollar against its major rivals from over one-yeat highs. In that case, a steep corrective decline could ensue in Gold price from near-lifetime highs. Conversely, a downside surprise in the core readings could ramp up the odds for a large Fed rate cut yet again, setting another record high in Gold price at the expense of the USD.
The reaction to the PCE inflation report, however, could be temporary as the end-of-the-month, as well as, the quarter-end flows could come into play and stir markets. Traders are also likely to resort to profit-taking in Gold price ahead of next week’s high-impact US Nonfarm Payrolls data.
Further, a speech by Fed Governor Michelle Bowman could add to the potential volatility around the Gold price.
Nothing changes for Gold price from a short-term technical perspective, as it remains in extremely overbought territory, suggesting that a meaningful correction could be in the offing.
The 14-day Relative Strength Index (RSI) is currently trading above the 76 level, warranting caution to buyers.
If buyers regain lost momentum, acceptance above the record high of $2,686 is critical to unleashing further upside toward the $2,700 barrier, followed by the $2,750 psychological mark.
Conversely, any correction in Gold price will likely test the September 24 low of $2,623, below which the $2,600 threshold will come into play.
Further south, Gold sellers could target the September 20 low of $2,585.
The Core Personal Consumption Expenditures (PCE), released by the US Bureau of Economic Analysis on a monthly basis, measures the changes in the prices of goods and services purchased by consumers in the United States (US). The PCE Price Index is also the Federal Reserve’s (Fed) preferred gauge of inflation. The YoY reading compares the prices of goods in the reference month to the same month a year earlier. The core reading excludes the so-called more volatile food and energy components to give a more accurate measurement of price pressures.” Generally, a high reading is bullish for the US Dollar (USD), while a low reading is bearish.