The main tag of Gold Price Articles.
You can use the search box below to find what you need.
[wd_asp id=1]
The main tag of Gold Price Articles.
You can use the search box below to find what you need.
[wd_asp id=1]
Silver price recovered some ground on Wednesday, advanced some 0.39%, and reclaimed the $31.50 figure as buyers stepped in and pushed the grey’s metal price above its opening price. Higher US Treasury bond yields capped its advance, yet XAG/USD trades at $31.82 as Thursday’s Asian session begins.
Silver price has printed back-to-back bullish days, yet it failed to surpass the $32.00 figure, exposing the grey metal to selling pressure. The Relative Strength Index (RSI) hints that buyers remain in control, but it has turned flat, indicating that consolidation lies ahead.
If XAG/USD clears the October 2 peak of $32.30, it will resume its uptrend and challenge the year-to-date (YTD) high of $32.71. A breach of the latter will push Silver to $33.00 before testing on October 1, 2012, high at $35.40.
On the other hand, if XAG/USD dives beneath the October 2 daily low of $31.00, this would sponsor a leg-down to the psychological $30.50 figure, followed by the 100-day moving average (DMA) at $29.74, ahead of the 50-DMA at $29.32.
Silver is a precious metal highly traded among investors. It has been historically used as a store of value and a medium of exchange. Although less popular than Gold, traders may turn to Silver to diversify their investment portfolio, for its intrinsic value or as a potential hedge during high-inflation periods. Investors can buy physical Silver, in coins or in bars, or trade it through vehicles such as Exchange Traded Funds, which track its price on international markets.
Silver prices can move due to a wide range of factors. Geopolitical instability or fears of a deep recession can make Silver price escalate due to its safe-haven status, although to a lesser extent than Gold’s. As a yieldless asset, Silver tends to rise with lower interest rates. Its moves also depend on how the US Dollar (USD) behaves as the asset is priced in dollars (XAG/USD). A strong Dollar tends to keep the price of Silver at bay, whereas a weaker Dollar is likely to propel prices up. Other factors such as investment demand, mining supply – Silver is much more abundant than Gold – and recycling rates can also affect prices.
Silver is widely used in industry, particularly in sectors such as electronics or solar energy, as it has one of the highest electric conductivity of all metals – more than Copper and Gold. A surge in demand can increase prices, while a decline tends to lower them. Dynamics in the US, Chinese and Indian economies can also contribute to price swings: for the US and particularly China, their big industrial sectors use Silver in various processes; in India, consumers’ demand for the precious metal for jewellery also plays a key role in setting prices.
Silver prices tend to follow Gold’s moves. When Gold prices rise, Silver typically follows suit, as their status as safe-haven assets is similar. The Gold/Silver ratio, which shows the number of ounces of Silver needed to equal the value of one ounce of Gold, may help to determine the relative valuation between both metals. Some investors may consider a high ratio as an indicator that Silver is undervalued, or Gold is overvalued. On the contrary, a low ratio might suggest that Gold is undervalued relative to Silver.
Spot Gold hovers around $2,650 a troy ounce on Wednesday, confined to a tight trading range amid a generally pessimistic market mood favoring both Gold and the US Dollar (USD). The Middle East conflict, with Israel and Iran launching back-and-forth attacks, weighs on investors’ mood. Fears of supply disruptions push crude oil prices higher and speculative interest into safe-haven assets. Stock markets traded mixed in Asia and Europe, as the massive Chinese stimulus announced last week partially offsets geopolitical tensions.
Wall Street opened mixed, with only the Dow Jones Industrial Average (DJIA) trading in positive territory, up a modest 0.02% at the time of writing. The Nasdaq Composite and the S&P500 trade in the red, albeit losses are modest. American traders are digesting United States (US) employment data, as the ADP report on private job creation showed 143,000 new positions were added in September, better than the 120,000 anticipated by market participants.
The encouraging figures back the Greenback ahead of the September Nonfarm Payrolls report to be released on Friday. Federal Reserve (Fed) officials expressed concerns about the employment situation, shifting the focus away from inflation. Generally speaking policymakers are confident about inflation moving towards their 2% goal. However, the once-hot job market has lost steam over the last few months, and softer-than-anticipated figures could prompt the Fed into more aggressive rate cuts. That’s not the case following the ADP release, one of the reasons US indexes stay afloat.
The daily chart for XAU/USD shows it trimmed early losses and hover around its opening. Moving averages head firmly north, far below the current level, maintaining the long-term bullish trend alive. Technical indicators, in the meantime, turned lower, although they stand far above their midlines and with limited downward strength, falling short of suggesting a steeper decline.
In the near term, and according to the 4-hour chart, XAU/USD is aiming to resume its advance. The pair is trading just above a flat 20 SMA, while the 100 and 200 SMAs aim higher far below the shorter one, all supportive of a bullish extension. Finally, technical indicators resumed their advances and are currently crossing their midlines into positive territory, reflecting increased buying interest.
Support levels: 2,652.60 2,638.10 2,623.25
Resistance levels: 2,670.00 2,685.00 2,700.00
Furthermore, you also have to keep in mind that a lot of questions will be asked about the tensions and the combat in Lebanon. So, with all of that being said, the Middle East could continue to be a bit of a tinderbox. Furthermore, you have the Russians and the Ukrainians fighting still, so it does make a certain amount of sense that oil can only fall so far. Adding more credence to the move is the fact that the JOLTS job openings number in the United States came out hotter than anticipated, so while PMI numbers are starting to shrink, the job openings are still pretty robust and that suggests that there could be a bit of demand coming into the picture. And then finally you have a potential port strike throughout the United States which would pretty much cut off imports.

So, with that being said I think you’ve got a situation where we definitely favor the upside over the down but that doesn’t necessarily mean that we break out right away. I think short-term pullbacks continue to be buying opportunities. Why wouldn’t necessarily go so far as to say that this is a “one-way trade”, certainly it seems like it’s going to take a lot of effort to finally break down below the $66 level, and through the bottom of the consolidation range that we have been in over the last couple of years. All things being equal, I think the risks still seem to the upside more than anything else right now.
Ready to trade oil price analysis and predictions? Here are the best Oil trading brokers to choose from.
Gold price is consolidating the previous recovery near $2,660 in Asian trading on Wednesday, aa buyers catch a breather amid the Iran-Israel geopolitical escalation while awaiting the key US ADP Employment Change data and a flurry of speeches from US Federal Reserve (Fed) policymakers.
Despite persisting fears of an Iran-Israel conflict turning into a wider regional war, the Asian markets have calmed down a bit, as they believe that Iran may not pursue a full-fledged war with Israel and that it would urge de-escalation in the same way as it did after the April missile strikes.
Iran’s Revolutionary Guard said early Wednesday that Iranian forces on Tuesday used hypersonic Fattah missiles for the first time and 90% of its missiles successfully hit their targets in Israel.
“Our action is concluded unless the Israeli regime decides to invite further retaliation. In that scenario, our response will be stronger and more powerful,” Iranian Foreign Minister Abbas Araqchi said in a post on X early Wednesday.
Tehran said this attack was in response to Israeli killings of militant leaders and aggression in Lebanon against the Iran-backed armed movement Hezbollah and in Gaza.
If Middle East geopolitical tensions dissipate on no further potential aggression from Israel, the traditional safe-haven, Gold price, will likely come under renewed selling pressure.
However, the US ADP Employment Change data and Fedspeak will be next of note for the US Dollar and Gold price, as the events could provide fresh hints on the size of the next Fed interest rate cut. The US private sector employment is expected to rise by 120K in September, up from a 99K job gain in August.
Tuesday’s mixed US ISM Manufacturing PMI and JOLTS Job Openings data failed to offer any clear signals on the direction of the Fed interest rate outlook. Meanwhile, Atlanta Fed President Raphael Bostic repeated that he is “open to another half-percentage point rate cut if the labor market shows unexpected weakness.”
Markets continue pricing in about a 37% chance that the Fed will lower rates by 50 basis points (bps) in November, down from 53.3% seen at the start of the week, according to CME Group’s FedWatch Tool.
Besides, the news of Iranian bombings on Israel dominated markets and triggered a broad risk-aversion wave, spiking up the safety bets in Gold price, the US Dollar and government bonds.
The daily technical setup for Gold price remains constructive as the 14-day Relative Strength Index (RSI) holds firm near 68.00, despite turning slightly lower.
Gold price needs to yield a daily candlestick closing above the static resistance near $2,670 for a renewed upside. The next resistance is aligned at the record high of $2,686.
Further up, buyers will target the $2,700 round level, followed by the rising trendline resistance at $2,730.
Alternatively, if Gold sellers flex their muscles, acceptance below the September 24 low of $2,623 is critical to unleashing further downside toward the $2,600 threshold.
Gold sellers could then challenge the September 20 low of $2,585, where the 21-day Simple Moving Average (SMA) hangs around.
Gold has played a key role in human’s history as it has been widely used as a store of value and medium of exchange. Currently, apart from its shine and usage for jewelry, the precious metal is widely seen as a safe-haven asset, meaning that it is considered a good investment during turbulent times. Gold is also widely seen as a hedge against inflation and against depreciating currencies as it doesn’t rely on any specific issuer or government.
Central banks are the biggest Gold holders. In their aim to support their currencies in turbulent times, central banks tend to diversify their reserves and buy Gold to improve the perceived strength of the economy and the currency. High Gold reserves can be a source of trust for a country’s solvency. Central banks added 1,136 tonnes of Gold worth around $70 billion to their reserves in 2022, according to data from the World Gold Council. This is the highest yearly purchase since records began. Central banks from emerging economies such as China, India and Turkey are quickly increasing their Gold reserves.
Gold has an inverse correlation with the US Dollar and US Treasuries, which are both major reserve and safe-haven assets. When the Dollar depreciates, Gold tends to rise, enabling investors and central banks to diversify their assets in turbulent times. Gold is also inversely correlated with risk assets. A rally in the stock market tends to weaken Gold price, while sell-offs in riskier markets tend to favor the precious metal.
The price can move due to a wide range of factors. Geopolitical instability or fears of a deep recession can quickly make Gold price escalate due to its safe-haven status. As a yield-less asset, Gold tends to rise with lower interest rates, while higher cost of money usually weighs down on the yellow metal. Still, most moves depend on how the US Dollar (USD) behaves as the asset is priced in dollars (XAU/USD). A strong Dollar tends to keep the price of Gold controlled, whereas a weaker Dollar is likely to push Gold prices up.
Silver price (XAG/USD) extends its gains for the second consecutive day, trading around $31.50 per troy ounce during the European hours on Wednesday. The upside of the Silver prices is attributed to the safe-haven flows amid escalating geopolitical tensions in the Middle East.
Iran launched over 200 ballistic missiles at Israel on Tuesday, shortly after the US had warned that a strike was imminent. The Israel Defense Forces reported that several of the missiles were intercepted, while reports indicated that one person was killed in the West Bank, according to Bloomberg.
Israeli Prime Minister Benjamin Netanyahu vowed to retaliate against Iran following a missile attack on Tuesday. In response, Tehran warned that any counterstrike would lead to “vast destruction,” raising concerns about the potential for a broader conflict.
On Tuesday, the weaker-than-expected ISM Manufacturing PMI made room for the US Federal Reserve (Fed) to continue lowering rates. The index came at 47.2 for September, matching the reading with August’s print but came in below the market expectation of 47.5. However, Fed Chair Jerome Powell said on Monday the central bank is not in a hurry and will lower its benchmark rate gradually ‘over time.’
The CME FedWatch Tool indicates that markets are assigning a 62.7% probability to a 25 basis point rate cut by the Federal Reserve in November, while the likelihood of a 50-basis-point cut is 37.3%, down from 57.4% a week ago. Prolonged higher interest rates keep the opportunity cost higher of holding non-yielding assets like Silver, making it less appealing to investors who seek more attractive, yield-bearing alternatives.
Silver demand has been bolstered by China’s fiscal and monetary stimulus, particularly benefiting industrial applications in one of the world’s largest manufacturing hubs. However, weaker-than-expected demand growth in China, compounded by data indicating a decline in manufacturing activity, might have limited the upside potential of the grey metal.
Silver is a precious metal highly traded among investors. It has been historically used as a store of value and a medium of exchange. Although less popular than Gold, traders may turn to Silver to diversify their investment portfolio, for its intrinsic value or as a potential hedge during high-inflation periods. Investors can buy physical Silver, in coins or in bars, or trade it through vehicles such as Exchange Traded Funds, which track its price on international markets.
Silver prices can move due to a wide range of factors. Geopolitical instability or fears of a deep recession can make Silver price escalate due to its safe-haven status, although to a lesser extent than Gold’s. As a yieldless asset, Silver tends to rise with lower interest rates. Its moves also depend on how the US Dollar (USD) behaves as the asset is priced in dollars (XAG/USD). A strong Dollar tends to keep the price of Silver at bay, whereas a weaker Dollar is likely to propel prices up. Other factors such as investment demand, mining supply – Silver is much more abundant than Gold – and recycling rates can also affect prices.
Silver is widely used in industry, particularly in sectors such as electronics or solar energy, as it has one of the highest electric conductivity of all metals – more than Copper and Gold. A surge in demand can increase prices, while a decline tends to lower them. Dynamics in the US, Chinese and Indian economies can also contribute to price swings: for the US and particularly China, their big industrial sectors use Silver in various processes; in India, consumers’ demand for the precious metal for jewellery also plays a key role in setting prices.
Silver prices tend to follow Gold’s moves. When Gold prices rise, Silver typically follows suit, as their status as safe-haven assets is similar. The Gold/Silver ratio, which shows the number of ounces of Silver needed to equal the value of one ounce of Gold, may help to determine the relative valuation between both metals. Some investors may consider a high ratio as an indicator that Silver is undervalued, or Gold is overvalued. On the contrary, a low ratio might suggest that Gold is undervalued relative to Silver.
U.S. crude oil prices rose more than 2% on Tuesday, coming off session highs as traders assessed whether a missile attack by Iran against Israel would lead to further escalation in Middle East.
“There has been a lot complacency about this war,” Helima Croft, head of global commodity strategy at RBC Capital Markets, told CNBC’s “The Exchange.” Traders have largely dismissed the threat of oil supply disruptions from simmering tensions in the Middle East, she said.
The question now is whether Israel might target Iran’s nuclear facilities or oil infrastructure in response to the attack, Croft said. Iran is producing at a five-year high of over 3 million barrels per day, she said.
“We do need to think about a scenario where Iranian oil supplies are at risk,” Croft said.
Here are Tuesday’s closing energy prices:
The Israel Defense Forces identified about 180 missiles fired from Iran toward Israel. Most of the missiles were intercepted though several hits have been identified, an Israeli security official told NBC News.
The IDF is assessing the situation and is not currently aware of any casualties, said military spokesman Daniel Hagari.
“This attack will have consequences,” Hagari said. A senior White House official told NBC News earlier that the U.S. would help defend Israel and warned Iran that an attack would “carry severe consequences.”
Tensions in the Middle East have dramatically escalated over the past week, as Israel has pounded the Iran-backed militia Hezbollah with airstrikes, killing the group’s leader, Hassan Nasrallah. Israel dispatched ground forces into southern Lebanon on Tuesday.

Crude oil intraday
Oil market and geopolitical analysts have repeatedly warned this year that an Israeli incursion into Lebanon could be the trip wire that leads to a regional war with Iran, increasing the risk of crude supply disruptions.
The impact on the oil market will depend on the “scope and damage” caused by an Iranian attack, which in turn will drive Israel’s response, said Bob McNally, president of Rapidan Energy.
Iran and Israel came to blows in April but ultimately backed away from a full-blown conflict. Iran launched hundreds of ballistic missiles and drones against Israel, after the government of Prime Minster Benjamin Netanyahu struck an Iranian diplomatic compound in Syria.
The U.S., Israel and other allies foiled Iran’s April missile attack, giving the Netanyahu government room for a small retaliatory strike in Iran that did not lead to a further cycle of escalation.
McNally said “the crude risk premium should quickly dissipate” if there is a repeat of “April’s failed Iranian and restrained Israel exchanges.”
The analyst cautioned, however, that Israel has increasingly adopted a “three eyes for an eye” approach to attacks from regional enemies.
“If Iran attacks and causes damage, then the escalatory cycle could leg up quicker to sustain and even increase a geopolitical risk premium,” McNally said.
Silver price (XAG/USD) snaps its two-day losing streak, trading around $31.40 per troy ounce during Tuesday’s European session. Silver prices receive support from safe-haven flows amid rising geopolitical tensions in the Middle East.
Israel has announced a “limited” ground operation targeting Hezbollah positions in the southern Lebanon border region, with troops crossing into the area, according to local news agency Al Jazeera. In addition, Israeli warplanes launched extensive airstrikes on southern Beirut after civilians were instructed to evacuate. On Monday, Israeli attacks in Lebanon resulted in the deaths of at least 95 people.
However, the prices of Silver received downward pressure following the recent remarks from the Federal Reserve (Fed) Chairman Jerome Powell. Powell said the central bank is not in a hurry and will lower its benchmark rate ‘over time.’ He added that the recent 50 basis point interest rate cut should not be seen as an indication of similarly aggressive future actions, noting that upcoming rate changes are likely to be more modest. Prolonged higher interest rates make non-yielding Silver less appealing to investors seeking more attractive alternatives.
Silver prices have been under pressure due to weaker-than-expected demand growth in China, exacerbated by data showing a decline in manufacturing activity. On Monday, China’s Caixin Manufacturing Purchasing Managers’ Index (PMI) fell to 49.3 in September, indicating a contraction, down from 50.4 in August. Given China’s position as one of the world’s largest manufacturing hubs, the country’s industrial demand for Silver is substantial, making these demand concerns particularly impactful.
Silver is a precious metal highly traded among investors. It has been historically used as a store of value and a medium of exchange. Although less popular than Gold, traders may turn to Silver to diversify their investment portfolio, for its intrinsic value or as a potential hedge during high-inflation periods. Investors can buy physical Silver, in coins or in bars, or trade it through vehicles such as Exchange Traded Funds, which track its price on international markets.
Silver prices can move due to a wide range of factors. Geopolitical instability or fears of a deep recession can make Silver price escalate due to its safe-haven status, although to a lesser extent than Gold’s. As a yieldless asset, Silver tends to rise with lower interest rates. Its moves also depend on how the US Dollar (USD) behaves as the asset is priced in dollars (XAG/USD). A strong Dollar tends to keep the price of Silver at bay, whereas a weaker Dollar is likely to propel prices up. Other factors such as investment demand, mining supply – Silver is much more abundant than Gold – and recycling rates can also affect prices.
Silver is widely used in industry, particularly in sectors such as electronics or solar energy, as it has one of the highest electric conductivity of all metals – more than Copper and Gold. A surge in demand can increase prices, while a decline tends to lower them. Dynamics in the US, Chinese and Indian economies can also contribute to price swings: for the US and particularly China, their big industrial sectors use Silver in various processes; in India, consumers’ demand for the precious metal for jewellery also plays a key role in setting prices.
Silver prices tend to follow Gold’s moves. When Gold prices rise, Silver typically follows suit, as their status as safe-haven assets is similar. The Gold/Silver ratio, which shows the number of ounces of Silver needed to equal the value of one ounce of Gold, may help to determine the relative valuation between both metals. Some investors may consider a high ratio as an indicator that Silver is undervalued, or Gold is overvalued. On the contrary, a low ratio might suggest that Gold is undervalued relative to Silver.
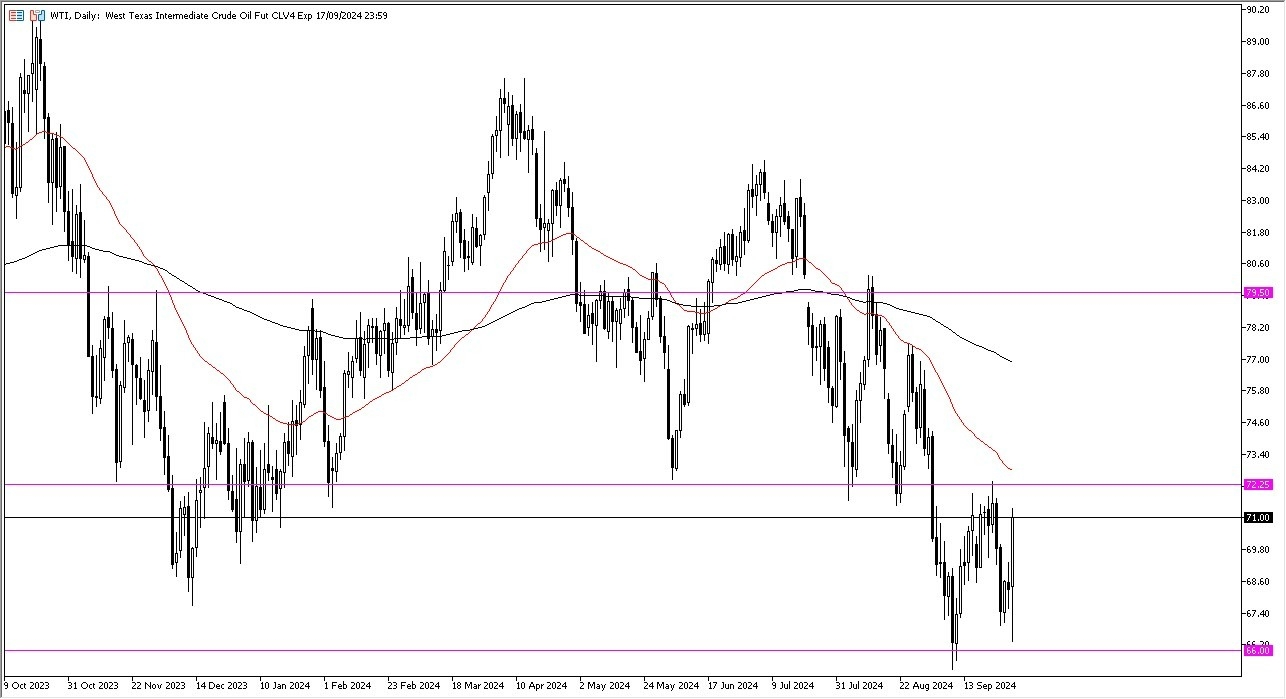
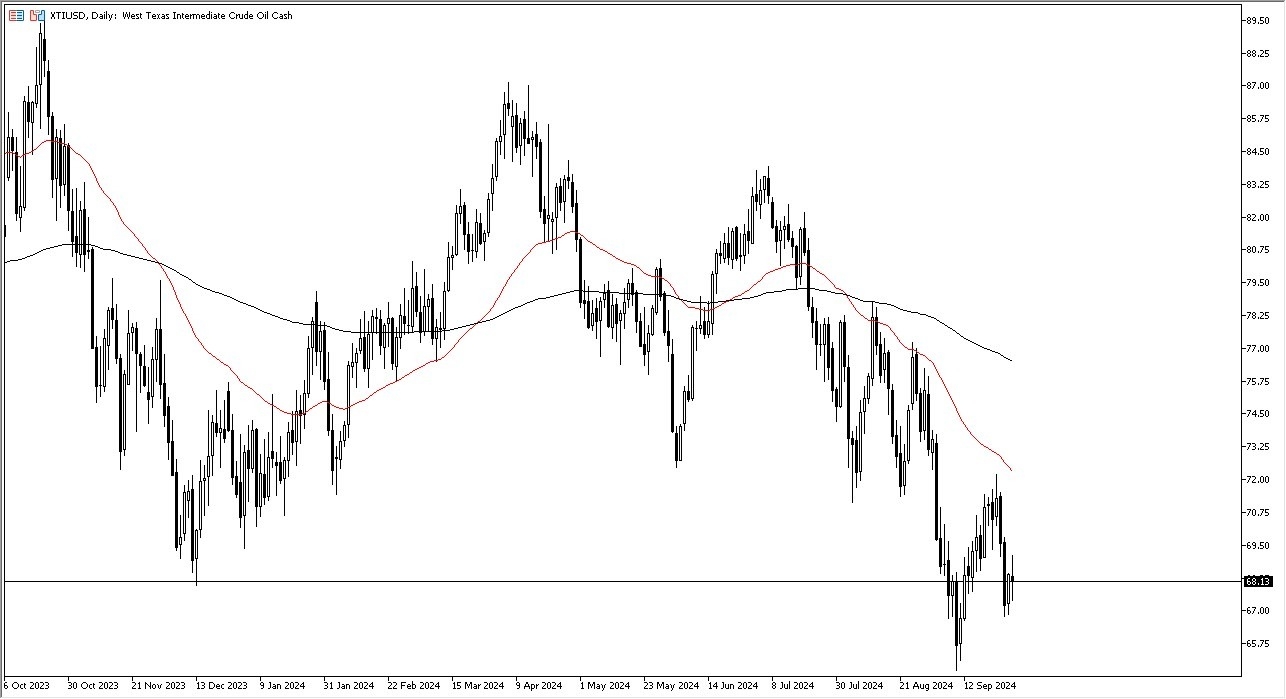
The technical analysis for the crude oil market is absolutely miserable, but you also have to keep in mind that the $65 level is going to continue to be crucial. The fact that we are close to that region suggest that perhaps there should be a certain number of buyers willing to jump in. If we were to break down below the $65 level, the market is likely to completely crater, and at that point time it would probably signal that perhaps we are heading into something rather ugly from an economic standpoint.
On the other hand, if we can break above the $69.50 level, then I suspect that WTI goes looking to the 50 Day EMA, sitting right around the $72 level. The $72 level is an area that has been important multiple times, and if we can break above that level then it’s possible that we could see crude oil goes looking to the 200 Day EMA, sitting right around the $76 level. Ultimately, this is a market that I think continues to see a lot of volatility, and therefore you need to be cautious with your position sizing.
The position size is absolutely everything when it comes to trading this market, due to the fact that we have seen a lot of violent moves, and of course we have a lot of geopolitical concerns in the Middle East, as well as Russia being involved in a hot war, we could see a sudden spike in oil, but quite frankly after this past weekend’s news, I think the world is willing to look past all of this, at least for the short term.
Ready to trade daily Forex analysis? We’ve shortlisted the best Forex Oil trading brokers in the industry for you.
Gold price is back in the green early Tuesday, snapping a two-day correction from record highs of $2,686. Gold buyers capitalize on intensifying Middle East tensions, anticipating the top-tier US ISM Manufacturing PMI and JOLTS Job Openings survey for fresh directives.
Geopolitical tensions mount between Israel and Iran after the former announced a “limited” ground operation against the Iranian-backed militant group – Hezbollah targets in the border area of southern Lebanon, sending its soldiers across the border.
This comes after Iran vowed to strike back against the killing of Hezbollah leader Hassan Nasrallah Nasrallah. Israel continued to strike Lebanon over the weekend and claimed to have killed another senior Hezbollah figure after the killing of leader Nasrallah.
Markets turn cautious amid heightened risks of retaliation by Iran, allowing the traditional safe-haven Gold price to recover some ground. Further, US Dollar buyers take a breather before a fresh batch of US statistics while US Treasury bond yields reverse the previous upswing on deteriorating risk sentiment, capping the downside in Gold price.
Upcoming US ISM Manufacturing PMI data is likely to provide fresh hints on the state of the economy while the JOLTS survey could signal a further cooldown in the US labor market. Discouraging data could revive expectations of a large interest cut by the US Federal Reserve (Fed) in November.
Markets expectations of a 50 basis points (bps) rate cut in November were washed off after Fed Chair Jerome Powell pushed back against increased bets of an outsized rate cut at the next meeting, during his speech at the National Association for Business Economics (NABE) Annual Meeting in Nashville on Monday.
Powell said that “this is not a committee that feels like it’s in a hurry to cut rates quickly.” He added, “if the economy performs as expected, that would mean two more cuts this year,” both by a quarter-point, aligning with the forecasts officials penciled in at the September 18 meeting.
Powell leaning in favor of less aggressive policy easing by the Fed triggered a notable upswing in the US Dollar, as US Treasury bond yields also rebounded across the curve. Gold price tumbled to the lowest level in four days in Powell’s aftermath.
Gold price, however, stalled its correction after Atlanta Fed President Raphael Bostic cautioned that the Fed may have to make further outsized rate moves if the US labor market deteriorates.
Markets now price in only a 36% chance that the Fed will lower rates by 50 bps in November, down from 53.3% a day earlier, according to CME Group’s FedWatch Tool.
Gold price looks north once again, as the 14-day Relative Strength Index (RSI) holds well in the bullish zone, currently near 65.50.
If buyers find footing, the static resistance near $2,670 will need to be scaled in order to retest the record high of $2,686.
Furrther up, the next topside hurdles are seen at the $2,700 level, followed by the rising trendline resistance at $2,720.
On the other hand, if Gold sellers regain control, acceptance below the September 24 low of $2,623 is critical to unleashing further downside toward the $2,600 threshold.
Further south, Gold sellers could target the September 20 low of $2,585 and the 21-day Simple Moving Average (SMA) at $2,578.
Gold has played a key role in human’s history as it has been widely used as a store of value and medium of exchange. Currently, apart from its shine and usage for jewelry, the precious metal is widely seen as a safe-haven asset, meaning that it is considered a good investment during turbulent times. Gold is also widely seen as a hedge against inflation and against depreciating currencies as it doesn’t rely on any specific issuer or government.
Central banks are the biggest Gold holders. In their aim to support their currencies in turbulent times, central banks tend to diversify their reserves and buy Gold to improve the perceived strength of the economy and the currency. High Gold reserves can be a source of trust for a country’s solvency. Central banks added 1,136 tonnes of Gold worth around $70 billion to their reserves in 2022, according to data from the World Gold Council. This is the highest yearly purchase since records began. Central banks from emerging economies such as China, India and Turkey are quickly increasing their Gold reserves.
Gold has an inverse correlation with the US Dollar and US Treasuries, which are both major reserve and safe-haven assets. When the Dollar depreciates, Gold tends to rise, enabling investors and central banks to diversify their assets in turbulent times. Gold is also inversely correlated with risk assets. A rally in the stock market tends to weaken Gold price, while sell-offs in riskier markets tend to favor the precious metal.
The price can move due to a wide range of factors. Geopolitical instability or fears of a deep recession can quickly make Gold price escalate due to its safe-haven status. As a yield-less asset, Gold tends to rise with lower interest rates, while higher cost of money usually weighs down on the yellow metal. Still, most moves depend on how the US Dollar (USD) behaves as the asset is priced in dollars (XAU/USD). A strong Dollar tends to keep the price of Gold controlled, whereas a weaker Dollar is likely to push Gold prices up.
The news means that Aurubis’ premium has remained unchanged for 2023, 2024 and now 2025.
“Due to the expected growing demand for refined copper in Europe, driven by healthy global megatrends like investments in the green transition, in combination with a tight supply market in Europe and our strong sustainability offering, we leave the 2025 Aurubis Copper premium unchanged compared to this year at 228 US$/t,” Martin Sjöberg, Aurubis senior vice president, commercial said.
Some participants had been expecting an increase in the European premium with copper concentrate treatment charges (TCs) at unprecedented lows. Low copper TCs can reduce smelters’ margins as they are the fees smelters charge to process concentrate into copper.
“It’s a bit of a surprise as the rumor was they would increase dramatically because of [low] TCs,” one consumer source told Fastmarkets. Other trader and producer sources Fastmarkets spoke to shared this sentiment.
Fastmarkets’ copper concentrates TC index, cif Asia Pacific fell to $(1.90) per tonne in the latest assessment on September 20, from $0.10 per tonne a week earlier. This compares with a TC of $87.70 per tonne on September 29, 2023, the level before the premium was announced last year.
Some market participants, meanwhile, pointed at weak copper demand in Europe as a reason for an unchanged annual premium.
Fastmarkets’ fortnightly assessment of the copper grade A cathode premium, delivered Germany was $170-190 per tonne on September 17, down from $180-200 per tonne on September 3 and $160-200 per tonne at the start of the year.
To understand the complex market conditions influencing price volatility, download our monthly base metals price forecast, including the latest copper price forecasts today. Get a free sample.