The main tag of Gold Price Articles.
You can use the search box below to find what you need.
[wd_asp id=1]
The main tag of Gold Price Articles.
You can use the search box below to find what you need.
[wd_asp id=1]
As I’m watching this three-day short-covering rally develop, I’m already planning for the pullback. That’s the move I’ll be watching for because that’s when the new buyers tend to show up. If they believe in the rally then they’re going to buy the first correction because they have the bottom at $2.592 to lean on. They aren’t trying to pick the bottom, but they will buy if they see an exit.
If buyers do come in on the first pullback then a secondary higher bottom could form, setting in motion the chances of an even steeper rally. The second rally is usually strong because it’s driven by short-covering and new buying. So this is our near-term plan.
The current near-term range is $2.905 to $2.592. Its pivot is $2.749. I’ll be watching this level to see if a test attracts new buyers.
Our current near-term targets are a minor top at $2.905 and the 50-day moving average at $2.987. The latter is critical because it is resistance, a trend indicator and a potential trigger point for an acceleration to the upside. Overcoming the 50-day MA could extend the rally further into an intermediate 50% level at $3.107.
Essentially, over the short-run we’re not chasing the first leg up, but we will be looking for a 50% pullback of the short-covering rally and playing for a secondary higher bottom formation to fuel an even bigger rally over the near-term.
Below-normal temperatures are sitting across the Midwest through May 13 and that is what got the buyers off the sideline Monday. Cooler forecasts at this time of year pull in heating demand when the market was expecting none. Lower-48 gas consumption came in at 65.5 Bcf per day Monday, up 7.0% year over year. That number tells you the weather is already influencing usage. It is not enough to flip the fundamental picture but it gave traders a reason to cover shorts after April’s beating and that was enough to run the market 3% in a session.
Brent crude continues to post strong gains in its recent intraday trading, approaching the key resistance level at $112.00, this level was one of our previously projected price targets. However, the market is currently showing a phase of relative calm, during which the price is attempting to take profits from its prior gains while building positive momentum that could help it break above this resistance.
The price remains supported by dynamic pressure as it continues to trade above EMA50, reinforcing the stability and dominance of the main short-term bullish trend. This is further supported by movement along an upward trendline, along with ongoing positive signals from relative strength indicators, despite reaching heavily overbought levels.
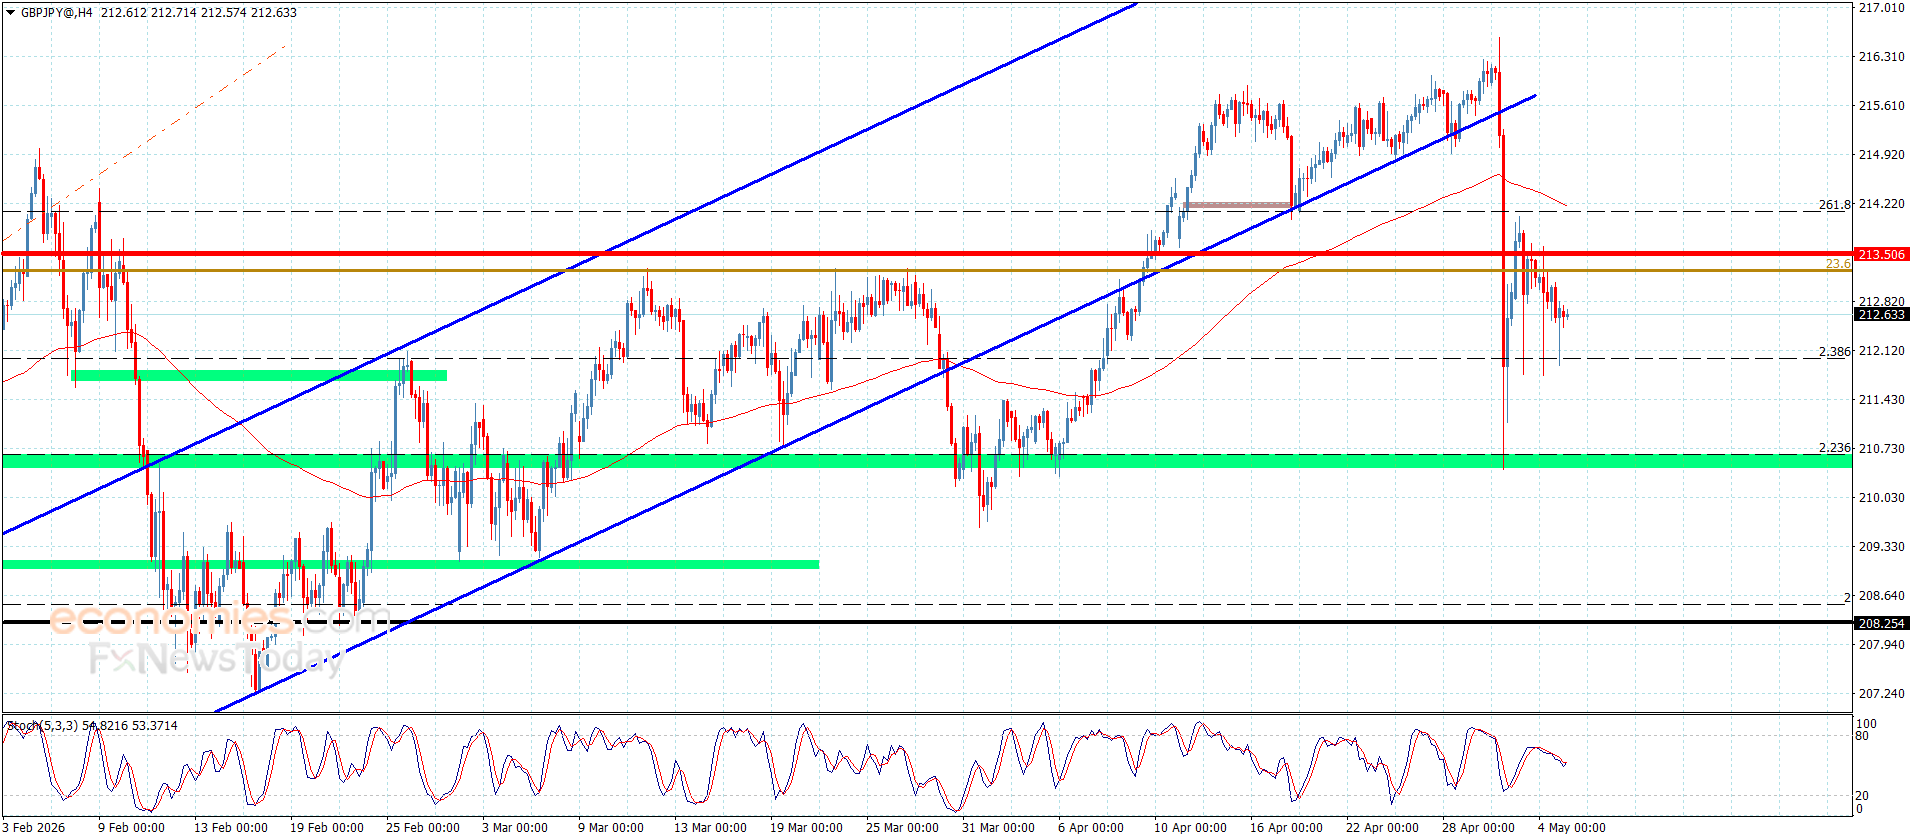
The GBPJPY pair confirmed its surrender to the dominance of the previously bearish bias by providing new close below 213.40 level, forming an extra barrier against the current trading, breaching 211.80 level to force it to provide temporary mixed trading by holding near 212.65.
Gathering extra negative momentum is important to ease the way for reaching below 211.80, opening the way for resuming the bearish trend by reaching 211.30, attempting to reach the next support near 210.45.
The expected trading range for today is between 211.30 and 213.20
Trend forecast: Bearish
Silver price ( XAG/USD) tumbles to near $72.85 during the Asian trading hours on Tuesday. The white metal remains under selling pressure amid intensifying tensions in the Middle East. Reports of Iranian attacks on vessels in the Strait of Hormuz boost crude oil prices, fueling inflation fears.
This has led to expectations that the US Federal Reserve (Fed) may keep interest rates elevated for longer, making non-yielding assets like silver less attractive. Minneapolis Fed President Neel Kashkari said on Sunday that further rate hikes cannot be ruled out, particularly as inflation risks remain elevated due to rising energy prices linked to the Iran conflict.
In the daily chart, XAG/USD keeps a bearish near-term bias as spot holds below the 100-day Exponential Moving Average (EMA) and the Bollinger Bands 20-day simple moving average (SMA). The Relative Strength Index (14) around 44 shows subdued bearish momentum rather than capitulation, suggesting downside pressure persists but without an oversold signal that would hint at an imminent, strong rebound.
On the topside, initial resistance is located at the 100-day EMA at $74.45, followed by the Bollinger midline at roughly $76.00, while the upper Bollinger Band near $80.85 marks a more distant cap in the event of a sharper short-covering bounce. On the downside, the May 4 low of $72.20 offers the first notable support. A decisive break below this level would expose the lower Bollinger Band at about $71.15.
(The technical analysis of this story was written with the help of an AI tool.)
Silver is a precious metal highly traded among investors. It has been historically used as a store of value and a medium of exchange. Although less popular than Gold, traders may turn to Silver to diversify their investment portfolio, for its intrinsic value or as a potential hedge during high-inflation periods. Investors can buy physical Silver, in coins or in bars, or trade it through vehicles such as Exchange Traded Funds, which track its price on international markets.
Silver prices can move due to a wide range of factors. Geopolitical instability or fears of a deep recession can make Silver price escalate due to its safe-haven status, although to a lesser extent than Gold’s. As a yieldless asset, Silver tends to rise with lower interest rates. Its moves also depend on how the US Dollar (USD) behaves as the asset is priced in dollars (XAG/USD). A strong Dollar tends to keep the price of Silver at bay, whereas a weaker Dollar is likely to propel prices up. Other factors such as investment demand, mining supply – Silver is much more abundant than Gold – and recycling rates can also affect prices.
Silver is widely used in industry, particularly in sectors such as electronics or solar energy, as it has one of the highest electric conductivity of all metals – more than Copper and Gold. A surge in demand can increase prices, while a decline tends to lower them. Dynamics in the US, Chinese and Indian economies can also contribute to price swings: for the US and particularly China, their big industrial sectors use Silver in various processes; in India, consumers’ demand for the precious metal for jewellery also plays a key role in setting prices.
Silver prices tend to follow Gold’s moves. When Gold prices rise, Silver typically follows suit, as their status as safe-haven assets is similar. The Gold/Silver ratio, which shows the number of ounces of Silver needed to equal the value of one ounce of Gold, may help to determine the relative valuation between both metals. Some investors may consider a high ratio as an indicator that Silver is undervalued, or Gold is overvalued. On the contrary, a low ratio might suggest that Gold is undervalued relative to Silver.
Domestic coffee prices today
The domestic coffee market in this morning session on May 5, 2026 recorded a deep downward correction, erasing the fragile recovery efforts of previous days.
Specifically, the average purchase price for the entire Central Highlands region has retreated to the threshold of 85,600 VND per kg, down 900 VND compared to the most recent data recorded on May 3, 2026.
In key localities, Dak Nong province (old) currently maintains the highest purchasing price in the region at 85,700 VND per kg, a sharp decrease compared to the 86,600 VND mark recorded last weekend.
Dak Lak and Gia Lai provinces both listed prices at 85,600 VND per kg, while in the Lam Dong area, coffee prices recorded a decrease of up to 1,000 VND to reach 85,000 VND per kg.
World coffee prices
Developments in the international market in the nearest closing session showed clear differentiation due to the impact of the holiday in the UK market.
Arabica coffee prices on the New York exchange for July 2026 delivery fell 0.90 cents, equivalent to a decrease of 0.31%, closing at 294.90 cents per pound.
The market initially tried to maintain green thanks to concerns about the Hoarmuz Strait being closed due to geopolitical tensions between the US and Iran increasing transportation, fertilizer and insurance costs, but the strength of the recovering USD at the end of the session submerged this upward momentum.
Meanwhile, the London exchange did not record transactions for Robusta coffee due to the UK market temporarily closing for International Labor Day holiday. Although Arabica inventory reports at the ICE exchange fell to the lowest level in more than 2 months with 494,508 bags, combined with a significant decrease in green coffee exports from Brazil in March, that much was still not enough to help Arabica prices stand firm against macroeconomic pressure.
Coffee price assessment and forecast
According to analysts, coffee prices are under heavy pressure from the prospect of abundant supply in the long term despite short-term technical tightening.
The Coffee Transaction Institute has just issued a challenging forecast, saying that Brazil’s 2026-2027 crop output will increase sharply by 12% compared to the previous year, reaching 71.4 million bags.
Even, Marex Group Plc gave a higher figure of 75.9 million bags, while StoneX forecast that the global coffee surplus in 2026 could expand to 10 million bags, marking the largest surplus in the past 6 years.
In Vietnam, data from the Statistics Office shows that coffee exports in the first 4 months of 2026 increased by 15.8% compared to the same period last year, reaching 810,000 tons, which continues to put downward pressure on the Robusta line.
Select market data provided by ICE Data Services. Select reference data provided by FactSet. Copyright © 2026 FactSet Research Systems Inc.Copyright © 2026, American Bankers Association. CUSIP Database provided by FactSet Research Systems Inc. All rights reserved. SEC fillings and other documents provided by Quartr.© 2026 TradingView, Inc.

Oil and gas markets moved higher after reports about military tension near the Strait of Hormuz. A report from Iran’s Fars news agency claimed a US warship was hit by missiles and forced to turn back. The United States denied the claim. However, markets reacted quickly to the risk of disruption in a major oil shipping route.
Brent crude futures rose by $5.52 to $113.69 per barrel. US West Texas Intermediate crude rose by $5.10 to $107.04 per barrel. These increases followed losses recorded on Friday. Prices had already started moving up due to supply concerns before the incident report appeared.
The Strait of Hormuz plays a central role in global oil trade. A large share of oil shipments pass through this route. Any disruption creates fear of supply shortages. Traders respond quickly to these risks. Iran’s navy said it blocked entry of US warships into the area. Iran also warned US forces not to enter the strait. US officials denied the missile strike report but confirmed concern over shipping safety.
President Donald Trump said the United States would assist ships stranded in the region. However, shipping constraints remain in place. Markets continue to price in supply risk. A tanker also reported being hit by projectiles near Fujairah in the United Arab Emirates. This added to supply disruption concerns. Traders reacted to multiple signals pointing to rising risk in the region.
Oil prices had already been supported by ongoing supply disruption. Analysts said the price path remains upward if flows through the strait stay restricted. OPEC+ also announced an output increase of 188,000 barrels per day in June. This marks the third monthly increase. However, analysts believe much of this supply may remain on paper due to ongoing conflict and shipping disruption.
Iran wants to delay nuclear talks until after the war and until shipping blockades end. This delays diplomatic progress and keeps uncertainty high. As long as the Strait of Hormuz remains constrained, oil markets may remain sensitive to geopolitical news.
European gas markets also reacted. Dutch front-month gas at the TTF hub rose to 46.16 euros per megawatt hour. Prices had earlier dipped to 44.50 euros. LNG shipments remain trapped due to the conflict. Only one LNG tanker has passed the chokepoint since late February. This raises supply concerns for Europe. Norwegian gas pipeline supply also remains reduced due to maintenance. Gas nominations stood at 282.6 million cubic meters per day.
Europe also faces low gas storage levels. Storage sites are 33.4% full compared with 40.3% last year. This creates risk if demand rises later in the year. Markets also track weather risks. A warm and dry summer may affect supply and demand patterns.
Market analysts say traders are watching Middle East developments closely. Contradictory statements from the United States and Iran create uncertainty. Some analysts doubt the effectiveness of the US plan to reopen shipping routes. The market is waiting for proof of safe passage through the strait.
Oil and gas markets often react to geopolitical signals faster than to physical supply changes. This explains the strong price move despite limited confirmed damage. The overall outlook depends on three key factors: shipping access, supply levels, and diplomatic progress.
Investors now track volatility in energy markets. Oil above $100 per barrel signals strong risk pricing. Gas markets also reflect supply concern. Investors often watch OPEC+ output, gas storage levels, shipping routes, and political negotiations. These signals help predict price movement. Energy markets may remain sensitive to headlines. Price swings may continue until supply flows stabilize and diplomatic progress appears.
Q1: How does the Strait of Hormuz impact global oil and gas prices?
The Strait of Hormuz handles a large share of global oil and LNG shipments. Any conflict, blockade, or military tension in this route creates supply fears, which quickly push oil and gas prices higher worldwide.
Q2: Can OPEC+ production increases lower oil prices soon?
OPEC+ plans to raise output, but conflict and shipping disruption may limit real supply growth. If supply stays restricted, oil prices may remain elevated despite planned production increases.
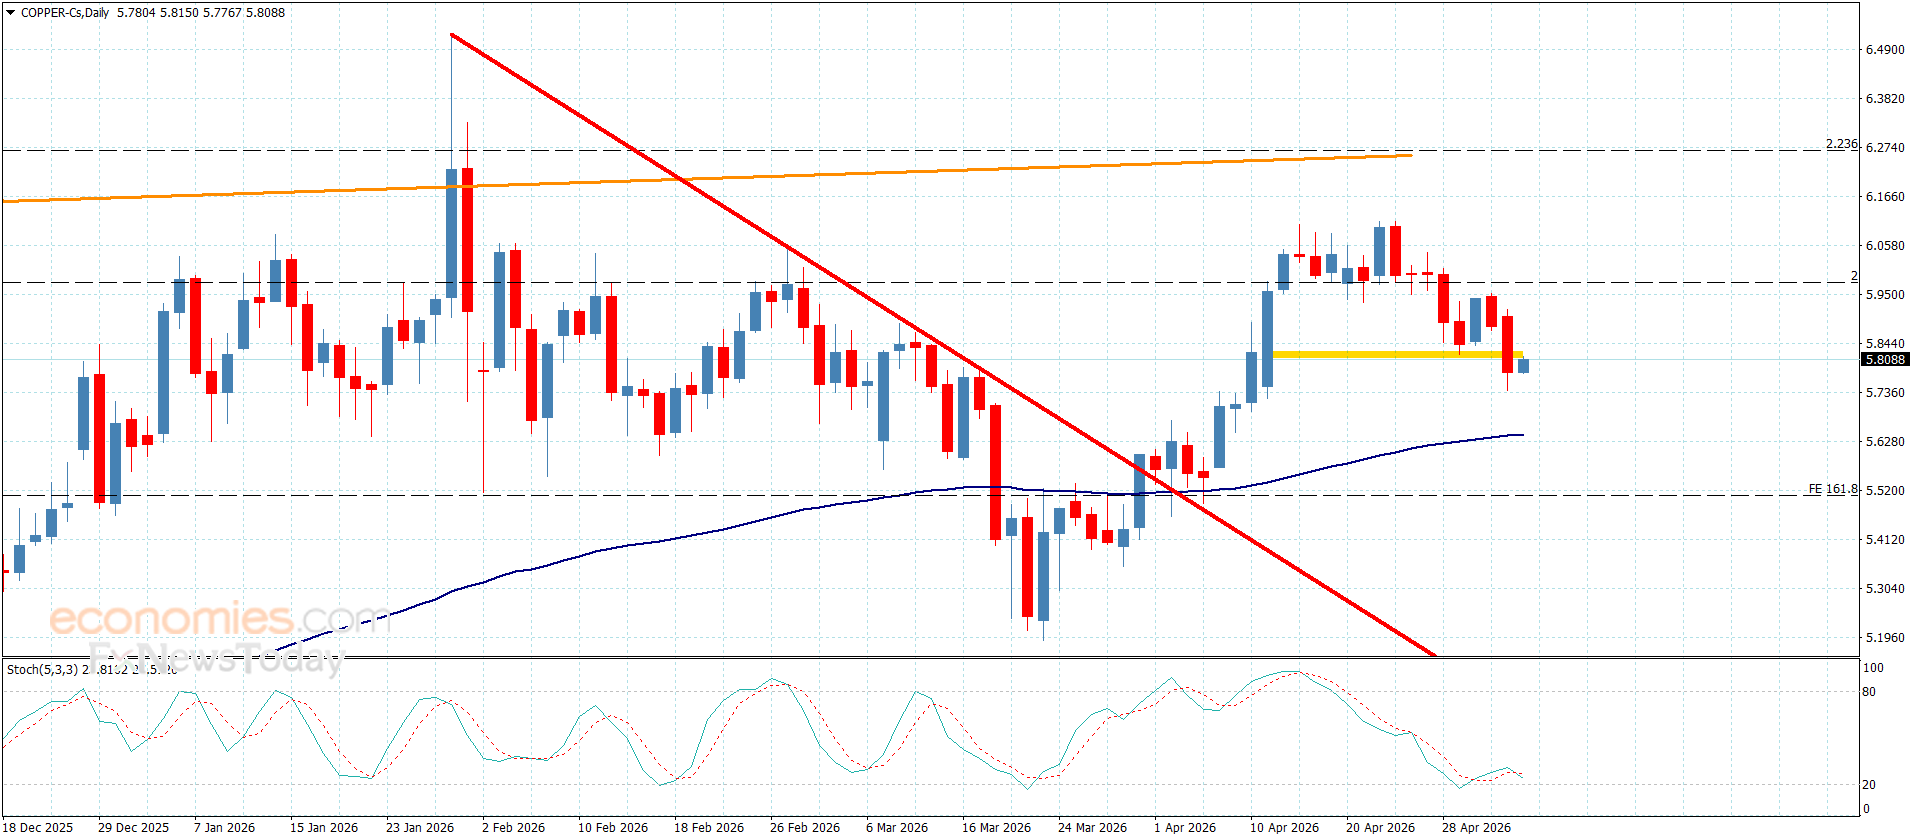
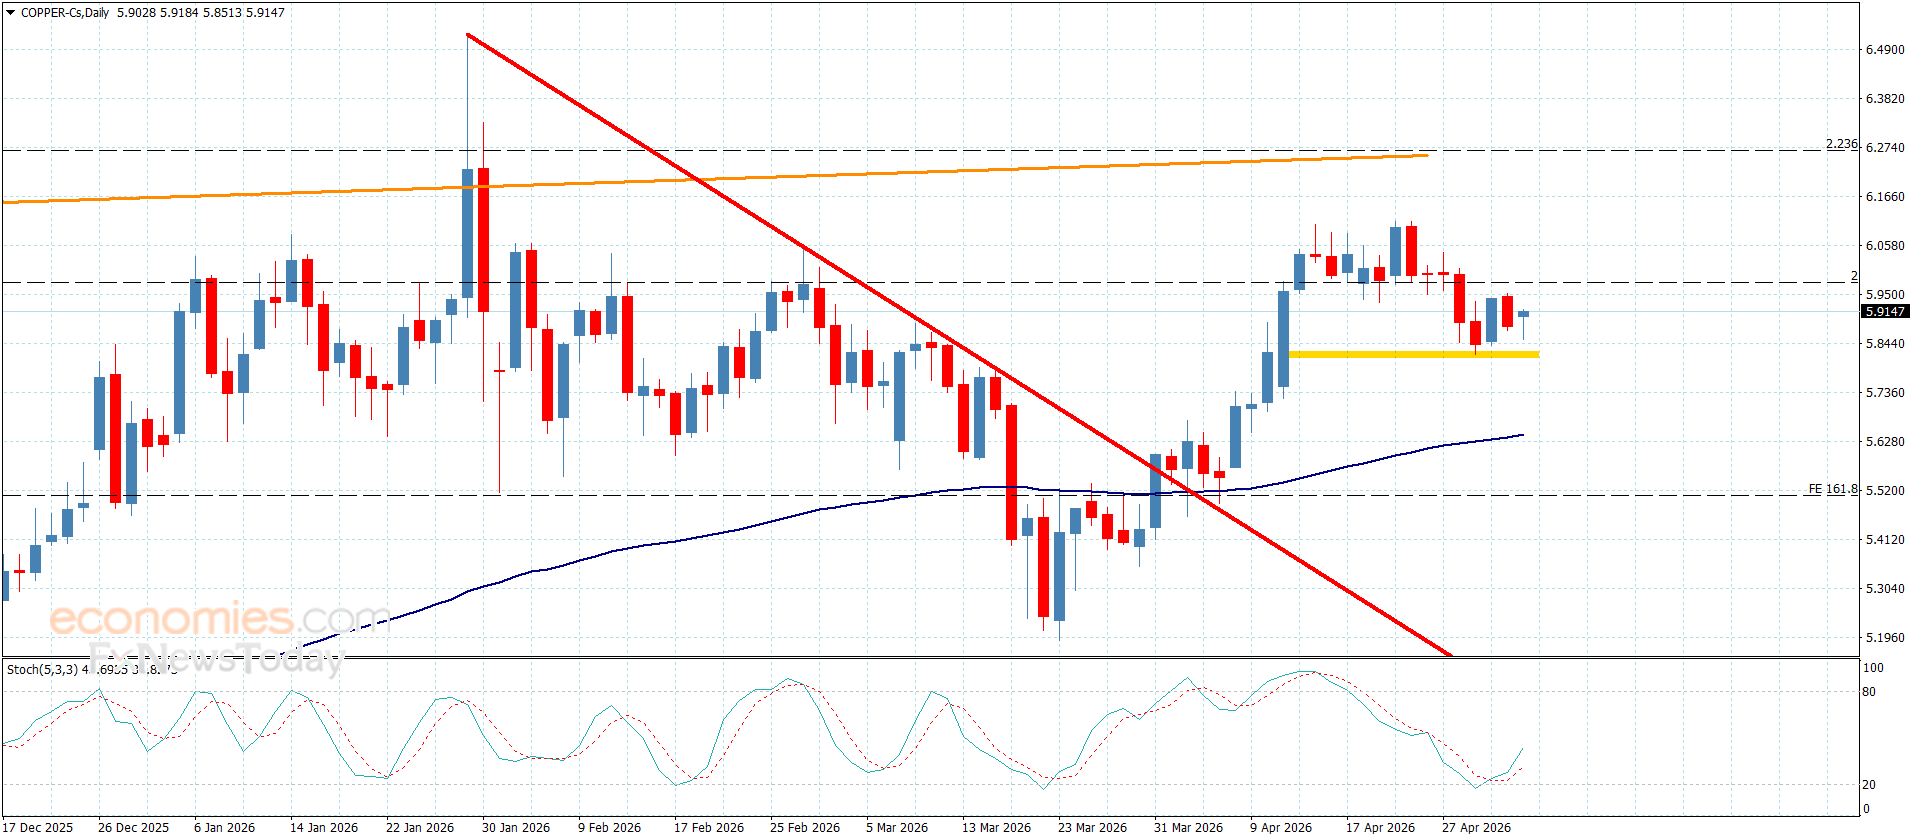
Copper price didn’t move anything by its confinement between $6.0500 level, while $5.8100 forms a key support against the attempt of resuming the bearish corrective trend, to fluctuate near $5.9100 level.
Providing positive momentum by the main indicators might increase the chances of surpassing the barrier, which opens the way for renewing the bullish attempts, to target several positive stations that might begin at $6.1200 and $6.2500, while breaking the support will force it to suffer extra losses by reaching $5.700 and $5.5900.
The expected trading range for today is between $5.8100 and $6.0500
Trend forecast: Sideways
Copper price didn’t move anything by its confinement between $6.0500 level, while $5.8100 forms a key support against the attempt of resuming the bearish corrective trend, to fluctuate near $5.9100 level.
Providing positive momentum by the main indicators might increase the chances of surpassing the barrier, which opens the way for renewing the bullish attempts, to target several positive stations that might begin at $6.1200 and $6.2500, while breaking the support will force it to suffer extra losses by reaching $5.700 and $5.5900.
The expected trading range for today is between $5.8100 and $6.0500
Trend forecast: Sideways