The main tag of Gold Price Articles.
You can use the search box below to find what you need.
[wd_asp id=1]
The main tag of Gold Price Articles.
You can use the search box below to find what you need.
[wd_asp id=1]
Broadcom Inc. (AVGO) stock price is experiencing volatile trading in its latest intraday levels, as the stock takes profits from its previous gains while attempting to gain positive momentum to help resume its ascent. Despite this slight decline, the stock remains stable above the key resistance level of 414.60, a strong technical signal confirming the validity of the previous breakout. This occurs amid the dominance of the main short-term and medium-term bullish trend, with continued positive pressure from trading above its 50-day SMA. Furthermore, positive signals continue to emerge from the Stochastic indicator, even as it remains within extremely overbought levels.
Therefore, we expect the stock price to rise during its upcoming trading sessions, especially as long as it remains stable above 414.60, targeting the first resistance level at 449.00.
Today’s price forecast: Bullish
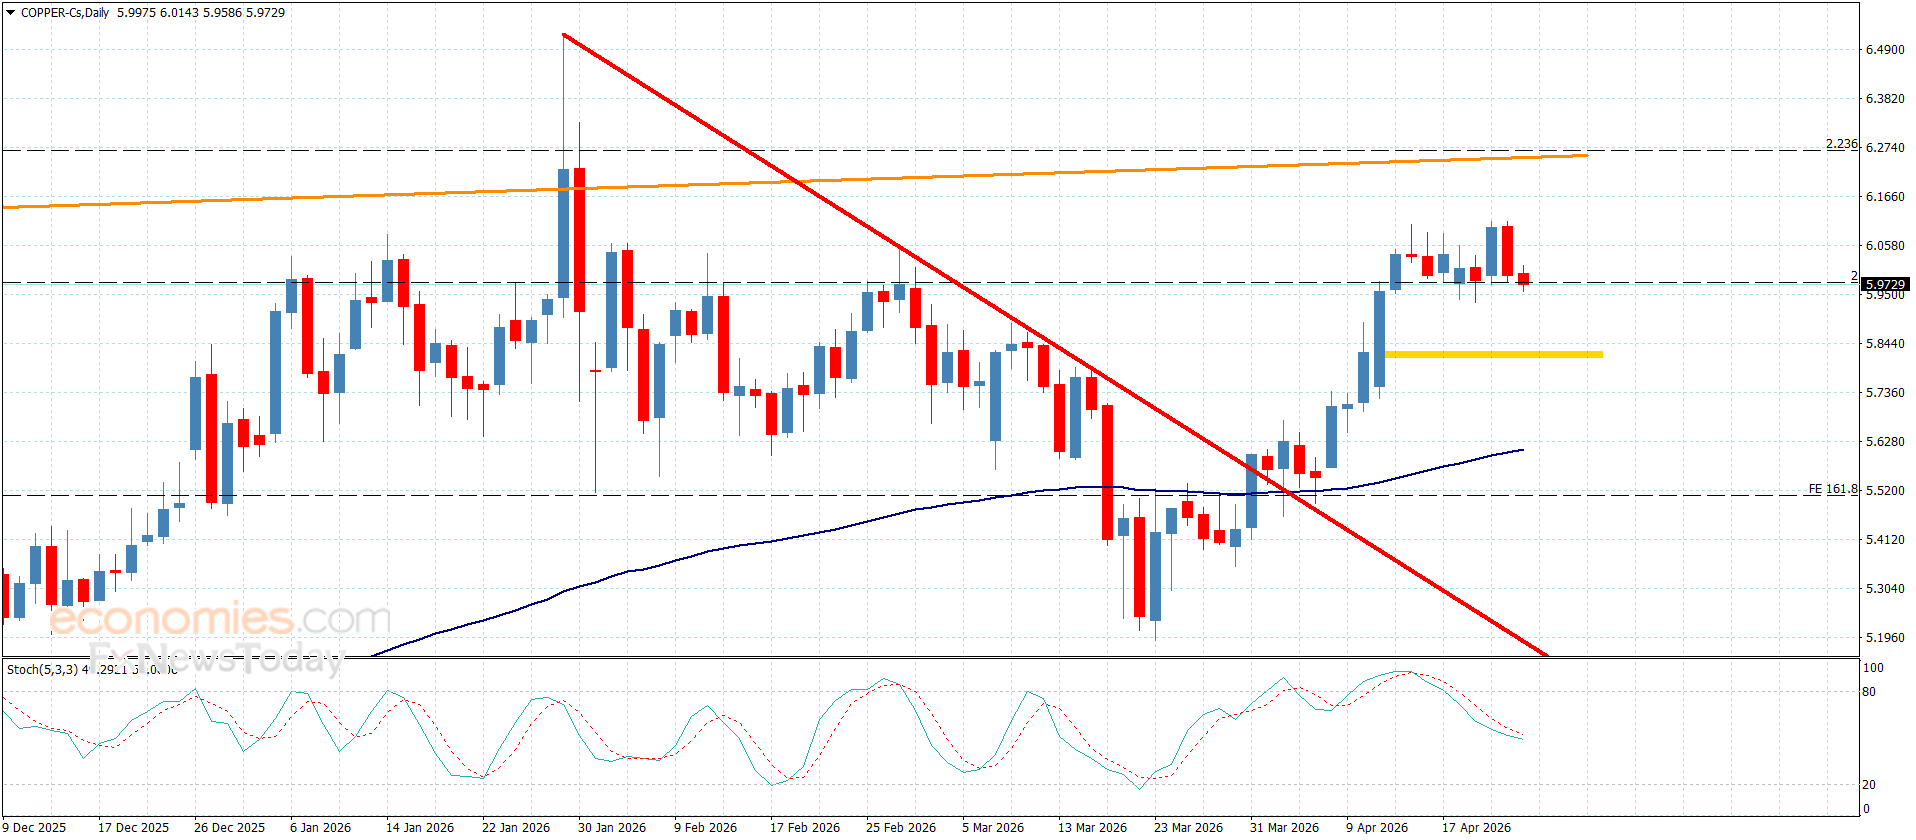
Copper price attempted to settle above the initial support at $5.9700, however the continuation of the main indicators’ contradiction pushed it to form new sideways fluctuation to settle near $6.0300.
The continuation of forming an obstacle at $6.1200 level against the bullish attempts will increase the chances of forming bearish corrective waves, to increase the chances of reaching $5.8900 and $5.8200, while breaching the barrier and holding above it will the way for resuming the bullish attempt, to reach $6.2500 initially.
The expected trading range for today is between $5.8900 and $6.1200
Trend forecast: Bearish
Goldman Sachs has revised its oil price forecasts upward amid escalating risks surrounding the Strait of Hormuz and potential supply disruptions in the Persian Gulf.
Operative Information Center-OMM reports that the adjustment was highlighted in a recent Bloomberg analysis. The investment bank now expects Brent crude to average $90 per barrel in the fourth quarter, a significant increase from its previous estimate of $80 per barrel.
According to the bank’s analysts, the shift is primarily driven by a possible sharp decrease in oil supply from the Persian Gulf region. Goldman Sachs suggests that regional exports may not fully recover until the end of June. Furthermore, the bank projects a substantial supply deficit of approximately 9.6 million barrels per day in the global market during the current quarter, warning of potential negative impacts on the global economy if prices continue to climb.
The Strait of Hormuz remains one of the world’s most critical maritime chokepoints, with approximately one-fifth of the world’s total oil consumption passing through it daily. Any geopolitical instability in this region traditionally leads to volatility in global energy markets. For Azerbaijan, a significant exporter of crude oil and natural gas, fluctuations in global oil prices directly influence state revenues and the implementation of large-scale reconstruction projects in the liberated territories of Garabagh and East Zangezur.
“The economic risks are larger than our crude base case alone suggests because of the net upside risks to oil prices, unusually high refined product prices, products shortages risks, and the unprecedented scale of the shock,” GS analysts led by Daan Struyven said in an April 16 note.
Oil prices extended gains on Monday, rising nearly 2 per cent as peace talks between the U.S. and Iran stalled while shipments through the Strait of Hormuz remained limited, keeping global oil supplies tight.
Brent crude futures rose $2.16, or 2.05 per cent, to $107.49 a barrel, the highest since April 7, and U.S. West Texas Intermediate was at $96.17 a barrel, up $1.77, or 1.88 per cent. Last week, Brent and WTI gained nearly 17 per cent and 13 per cent, respectively, the biggest weekly gains since the start of the war.
Hopes of reviving peace efforts receded during the weekend when U.S. President Donald Trump scrapped a planned trip to Islamabad by his envoys Steve Witkoff and Jared Kushner, even as Iranian Foreign Minister Abbas Araqchi arrived In Pakistan.
“This move puts the ball squarely back in Iran’s court, and the clock is now ticking loudly,” IG market analyst Tony Sycamore said in a note, adding that Tehran may be forced to shut production at its aging oil fields when it runs out of storage capacity.
Tehran has largely closed the strait while Washington has imposed a blockade of Iran’s ports. Traffic through the Strait of Hormuz remained limited, with just one oil products tanker entering the Gulf on Sunday, shipping data from Kpler showed.
Gold finds fresh demand to retake the $4,700 level in Asia on Monday, as the US Dollar pauses its advance amid a recovery in risk sentiment and ahead of the key Federal Reserve (Fed) monetary policy decision due later this week.
Despite a stand-off between the United States (US) and Iran over the Strait of Hormuz and nuclear program, alongside pervasive inflation fears due to elevated Oil prices, markets are hopeful that the Iran war could end soon, promoting a modest risk recovery.
US President Donald Trumo said early Monday that the “Iran war will end soon, and we will be victorious.”
“If Iran wants to talk, they can call us,” Trump added.
Following his remarks, Axios carried a story, citing a US official and two sources with knowledge of the matter, “Iran has given the US a new proposal to reopen the Strait of Hormuz and end the war that includes putting off nuclear negotiations,” per Bloomberg.
The positive shift in risk tone curbs the haven demand for the US Dollar (USD), dragging lower while lifting the bullion.
However, it remains to be seen if Gold sustains the latest leg up as traders could refrain from placing fresh bets on the bright metal ahead of key central bank policy meetings this week, including the Fed event risk on Wednesday.
In the meantime, profit-taking and fresh developments in the Middle East conflict could lead the way for Gold traders.
In the daily chart, XAU/USD trades at $4,721.88. The metal holds just above the 21-day simple moving average (SMA) at $4,719.11 and has pushed over a reclaimed descending trend line now tracking around $4,709.76, hinting at a mildly constructive tone despite still sitting beneath the 100-day SMA at $4,746.61 and the 50-day SMA near $4,864.12. The Relative Strength Index (RSI) at 47.34 is neutral, suggesting consolidation rather than a decisive trend, with price caught between nearby short-term support and the heavier overhead averages.
On the topside, initial resistance emerges at the 100-day SMA around $4,746.61, with a break there exposing the more important 50-day SMA near $4,864.12 as the next barrier to recovery. On the downside, immediate support is seen at the reclaimed descending trend line around $4,709.76 and the nearby 21-day SMA at $4,719.11; a loss of this shelf would put focus on the higher rising trend support around $4,589.67, ahead of the lower uptrend line at $4,383.70 and the 200-day SMA at $4,257.49, where the broader bullish structure would be challenged.
(The technical analysis of this story was written with the help of an AI tool.)
At 9 a.m. Eastern Time today, oil was priced at $106.01 per barrel with Brent serving as the benchmark (we’ll explain different benchmarks later in this article). That’s a gain of $2.34 compared with yesterday morning and around $39 higher than the price one year ago.
It’s impossible to forecast oil prices with detailed precision. Many different elements affect the market, but ultimately it boils down to supply and demand. When worries about economic recession, war, and other large-scale disruptions increase, oil’s path can shift fast.
Gas prices at the pump don’t only track crude oil. They also include what it takes to refine and move that fuel, the taxes layered on top, and the extra markup your local station adds to stay in business.
Since crude oil generally makes up a majority of the per-gallon cost, changes in its price have an outsized impact. When oil surges, gas prices typically rise in tandem. But when oil retreats, gas prices often lag on the way down, a trend sometimes described as “rockets and feathers.”
In case of emergency, the U.S. has a store of crude oil known as the Strategic Petroleum Reserve. Its primary purpose is energy security in case of disaster (think sanctions, severe storm damage, even war). But it can also go a long way toward softening crippling price hikes during supply shocks.
It’s not a long-term answer and is more meant to provide temporary relief, assisting consumers and keeping critical parts of the economy running, like key industries, emergency services, public transportation, etc.
Both oil and natural gas are key sources of the energy we use every day. Because of this, a big change in oil prices can affect natural gas. For example, if oil prices increase, some industries may swap natural gas for some segments of their operations where possible, which increases demand for natural gas.
To gauge oil’s performance, we often turn to two benchmarks:
Between these two, Brent better represents global oil performance because it prices much of the world’s traded crude. And, it’s often the best way to track historical oil performance. In fact, even the U.S. Energy Information Administration now uses Brent as its primary reference in its Annual Energy Outlook.
Looking at the Brent benchmark across several decades, oil has been anything but steady. It’s seen spikes due to factors such as wars and supply cuts, and it’s also seen crashes from global recessions and an oversupply (called a “glut”). For example:
All to say, oil’s historical performance has been anything but smooth. Again, it’s hugely affected by wars, recessions, OPEC whims, evolving energy initiatives and policies, and much more.
Looking to stay up-to-date regarding the latest energy developments? Check out our recent coverage:
The current price of oil per barrel depends largely on supply and demand, including news about potential future supply and demand (geopolitics, decisions made by OPEC+, etc.). In the U.S., prices also move based on how friendly an administration is to drilling, as it can affect future supply. For example, 2025 saw the Trump administration move to reopen more than 1.5 million acres in the Coastal Plain of the Arctic National Wildlife Refuge for oil and gas leasing, reversing the Biden administration’s policy of limiting oil drilling in the Arctic.
The price of oil updates constantly when the “futures” markets are open. A futures market is effectively an auction where people agree to buy or sell oil in the future. As long as people and companies are trading contracts, the oil price is changing.
In short, shale is rock that contains oil and natural gas. Think of shale as energy yet to be tapped. The more shale the U.S. accesses, the more energy we’ll have—and the more easily oil prices can keep from spiking as much thanks to a greater supply.
When oil is expensive, it tends to make everyday items cost more. This can be related to energy (your heating, gas utilities, etc.), but it’s also due to the logistics involved with making those items accessible to you. Shipping, for example, can affect the price of things at the grocery store, as it’s more expensive to get those products from warehouses and farms onto the shelf.
Brent crude is already trading above $105 and is expected to move within a $103 to $112 range on April 27, 2026, with upside risk toward $108–$112 if geopolitical fear intensifies after the security incident involving Donald Trump. However, without confirmed international escalation, gains may remain volatile rather than explosive.
Brent crude is no longer trying to break $100—it has already decisively moved past it. After closing above $105 on April 25, global oil markets are entering the new week from a position of strength, not recovery.
But just as traders were recalibrating around supply tightness and US-Iran diplomacy, a new shock hit the system. A security breach involving President Donald Trump in Washington has injected fresh uncertainty into already fragile global sentiment.
Now the key question is not whether oil can rise—but how much further it can go from an already elevated level.
Before the Trump incident, Brent crude had already:
This matters because the market was already bullish. The Trump-related shock is not creating momentum—it is adding fuel to an existing rally.
The attempted breach near a high-profile US political event has immediate psychological effects on markets.
Even though early findings suggest no foreign involvement, traders react first to risk, not confirmation.
This incident introduces:
From Brent crude fluctuations to WTI price swings, global energy markets are increasingly tied to political risk events. The attempted attack near Donald Trump has triggered fresh speculation about US stability and its ripple effect on oil demand, supply chains, and investor confidence. 👉 Understand the full geopolitical angle: Who Is Behind Attack on Trump — Iran or Lone Gunman? White House Shooting Explained
| Scenario | Price Range | Market Trigger |
|---|---|---|
| Strong bullish surge | $108 – $112 | Escalating geopolitical fear or new intelligence |
| Base case (controlled rally) | $104 – $108 | Continued supply tightness with no escalation |
| Pullback risk | $100 – $103 | Iran diplomacy progress or sentiment stabilisation |
The key difference now is that Brent is defending $105, not chasing it. That turns $100 into a strong support level rather than a target.
Several powerful forces are aligning:
Existing Supply Tightness
Production constraints, shipping risks, and limited spare capacity continue to restrict supply.
Geopolitical Layering Effect
Markets are now dealing with multiple overlapping risks: Iran tensions, Russia supply dynamics, and now US political stability concerns.
Investor Positioning
With Brent already above $100, traders are more willing to bet on further upside than on a reversal.
Psychological Breakout Zone
Once above $105, the next major target becomes $110.
Despite bullish conditions, there are strong stabilising forces:
This creates a volatile consolidation pattern, not a straight-line surge.
Higher oil prices add pressure to inflation, transport costs, and consumer spending. The Trump incident may increase uncertainty but is unlikely to shift energy fundamentals unless escalation occurs.
As a major importer, China faces rising input costs. If demand remains strong while supply stays tight, Brent could climb further.
Higher Brent strengthens revenue flows, providing economic support despite sanctions pressures.
Europe remains highly exposed. Brent above $105 raises costs across manufacturing, logistics, and energy systems, potentially slowing economic recovery.
For Nigeria, Brent above $105 is positive for revenue and foreign exchange. However, volatility means gains depend on production stability and policy efficiency.
The Brent crude oil market is no longer debating direction—it is debating intensity.
Short-term outlook for April 27:
The Trump incident adds uncertainty, but the real driver remains global supply tightness.
Brent crude is forecast to trade between $103 and $112 per barrel on April 27, 2026, with the most likely range around $104 to $108. Upside pressure remains strong as oil holds above $105, but volatility is expected due to geopolitical uncertainty.
The short-term trend remains bullish but volatile. Brent is more likely to test higher levels near $108–$110 if supply concerns persist, but could pull back toward $100–$103 if diplomatic progress with Iran improves sentiment.
Brent has a strong chance of testing $110 in the near term if geopolitical risks intensify or supply disruptions worsen. However, reaching $120 would require a major escalation, such as a breakdown in US-Iran relations or a significant supply shock.
Yes. Holding above $105 confirms strong bullish momentum. This level now acts as a support zone, meaning traders are more likely to buy dips rather than sell rallies unless major bearish news emerges.
The Brent crude forecast is currently driven by:
The incident involving Donald Trump adds short-term uncertainty and volatility to the market. While no foreign link has been confirmed, such events increase risk perception, which can support higher oil prices temporarily.
Yes. Brent crude is expected to remain highly volatile due to:
This creates both trading opportunities and risks.
For short-term traders, volatility presents opportunities. For long-term investors, Brent above $100 signals a high-risk, high-reward environment, where careful entry timing and diversification are essential.
Brent could fall below $100 if:
Without these factors, prices are likely to stay elevated.
The broader outlook remains bullish with volatility, with Brent likely to trade between $100 and $112 depending on geopolitical developments and supply conditions.
BitcoinWorld
Silver Price Forecast: XAG/USD Remains Vulnerable Near $75 as Oil Prices Surge with Weekly Gains
The silver price forecast for XAG/USD reveals a persistent vulnerability near the $75 mark. This weakness coincides with oil prices holding onto their weekly gains. Market participants are closely watching these developments. The interplay between these two commodities creates a complex trading environment.
Several factors contribute to the current silver price forecast. The strong performance of oil prices is a primary driver. Oil’s sustained gains often signal inflationary pressures. This can lead to tighter monetary policies. Such policies typically weigh on precious metals like silver.
Additionally, the US dollar remains resilient. A stronger dollar makes silver more expensive for foreign buyers. This reduces demand and puts downward pressure on prices. The silver price forecast reflects these dynamics.
Oil prices have maintained their weekly gains. This trend is supported by supply concerns and geopolitical tensions. For silver, this creates a challenging backdrop. Higher oil prices increase production costs for silver miners. This can squeeze profit margins and affect supply.
Furthermore, oil’s rally often diverts investor attention. Capital flows toward energy commodities. This leaves silver with less speculative interest. The silver price forecast incorporates these capital flow shifts.
Technical indicators for XAG/USD show a bearish bias. The $75 level acts as a critical support zone. A break below this level could trigger further selling. Resistance is seen near $78. The silver price forecast suggests a range-bound movement.
Trading volumes have been moderate. This indicates a lack of strong directional conviction. The Relative Strength Index (RSI) is near 45. This suggests neutral to slightly bearish momentum. Moving averages are also pointing lower.
The broader macroeconomic environment is mixed. Interest rate expectations remain a key variable. The Federal Reserve’s stance on inflation influences both oil and silver. Higher rates increase the opportunity cost of holding non-yielding assets like silver.
Global growth concerns also play a role. A slowdown in manufacturing reduces industrial demand for silver. This is particularly relevant for solar panel and electronics sectors. The silver price forecast reflects these industrial demand risks.
Silver is underperforming compared to gold. The gold-to-silver ratio has widened. This suggests silver is relatively cheaper. However, it also indicates weaker investor sentiment for silver. Platinum and palladium are also facing headwinds.
| Metal | Current Price | Weekly Change |
|---|---|---|
| Silver (XAG/USD) | $75.10 | -1.2% |
| Gold (XAU/USD) | $2,050 | +0.5% |
| Platinum | $920 | -0.8% |
Analysts at major financial institutions offer cautious views. One strategist notes that silver’s dual nature as both a precious and industrial metal makes it vulnerable. The current oil price strength adds to this vulnerability. Another expert highlights the importance of the $75 support level.
Market sentiment surveys show a bearish tilt. However, some traders see a buying opportunity. The silver price forecast remains uncertain in the short term. Long-term fundamentals, such as green energy demand, provide a floor.
Over the past week, several events have shaped the silver price forecast. Oil prices surged on Monday due to supply cuts. This weighed on silver from the start. Midweek, US economic data showed resilience. This strengthened the dollar and added pressure.
By Thursday, silver tested the $75 level. It held but showed no signs of recovery. Friday’s trading session saw consolidation. The weekly close near $75 confirms the bearish bias. The silver price forecast now looks to next week’s economic calendar.
Geopolitical tensions in the Middle East support oil prices. This indirect effect harms silver. Investors seek safe havens like gold or oil itself. Silver often gets overlooked in such scenarios. The silver price forecast must account for these risk-on and risk-off shifts.
Trade policies also matter. Tariffs on industrial metals can affect silver demand. Any escalation in trade disputes would be negative. The current environment favors oil over silver.
The silver price forecast for XAG/USD remains vulnerable near $75. Oil prices holding weekly gains create a headwind. Technical and fundamental factors align bearishly. However, the $75 support level is crucial. A break below could accelerate losses. Conversely, a rebound depends on a shift in oil prices or dollar weakness. Traders should monitor these key drivers closely. The silver price forecast offers both risks and opportunities.
Q1: Why is the silver price forecast bearish near $75?
The silver price forecast is bearish due to strong oil prices, a resilient US dollar, and technical indicators showing weakness. These factors combine to keep XAG/USD vulnerable.
Q2: How do oil price weekly gains affect silver?
Oil price weekly gains affect silver by signaling inflation and diverting investor capital. Higher oil prices also increase mining costs, pressuring silver prices.
Q3: What is the key support level for XAG/USD?
The key support level for XAG/USD is $75. A break below this level could lead to further declines toward $72. This level is critical for the silver price forecast.
Q4: Should investors buy silver at current levels?
Investors should be cautious. The silver price forecast suggests near-term weakness. However, long-term demand from green energy provides a potential floor. Consult a financial advisor.
Q5: What factors could reverse the silver price forecast?
A reversal in oil prices, a weaker US dollar, or strong industrial demand data could reverse the silver price forecast. Geopolitical events could also trigger a rally.
This post Silver Price Forecast: XAG/USD Remains Vulnerable Near $75 as Oil Prices Surge with Weekly Gains first appeared on BitcoinWorld.
Copper price remains affected by stochastic negativity, attempting to reach below $5.9700 to increase the chances of activating the temporary bearish corrective trend, to reach $5.8900 followed by $5.8200 level, which represents a new extra support against the current trading.
Forming a strong obstacle at $6.1200 level against the bullish attempts will increase the chances of forming negative attempts, to keep waiting to reach the previously suggested stations, to monitor its behavior to confirm the suggested trend in the upcoming trading.
The expected trading range for today is between $5.8200 and $6.0500
Trend forecast: Bearish
The Brent crude oil price today April 24, 2026 is trading near $106.01 per barrel, up $2.34 from yesterday and almost 59% higher than a year ago. Prices remain elevated because of Middle East supply risk, tight shipping routes, and global uncertainty, although renewed Iran diplomacy has slowed a breakout above $110.
The Brent crude oil price today April 24, 2026 is no longer just an energy market story. It has become a direct signal for inflation, stock market sentiment, central bank policy, shipping costs, and economic growth across the world’s largest economies.
Brent crude pushed above the $106 level after another volatile week in which geopolitical fears and supply disruption concerns drove a powerful rally. Yet even with prices elevated, hopes of renewed diplomacy between the United States and Iran have prevented a full breakout toward $110 and beyond.
For governments, investors, businesses, and consumers, the key question now is urgent: Will Brent crude continue climbing, or is this rally about to cool?
The answer could shape markets from New York to Shanghai, Moscow to Frankfurt.
| Metric | Value | Market Meaning |
|---|---|---|
| Current Brent Price | $106.01 | Strong bullish pricing |
| Yesterday Price | $103.67 | +2.25% daily gain |
| One Month Ago | $111.49 | Below recent peak |
| One Year Ago | $66.64 | +59.07% yearly surge |
| Weekly Trend | Strong Gain | Risk premium elevated |
| Resistance Zone | $108 to $110 | Key breakout level |
| Support Zone | $102 to $103 | Near-term floor |
Three powerful themes are driving the market:
The Strait of Hormuz remains one of the world’s most critical oil chokepoints. Any disruption there immediately threatens global supply flows.
Even before geopolitical stress, oil markets were relatively tight, meaning any disruption creates an outsized price reaction.
Funds and traders often move quickly into oil during geopolitical crises, increasing volatility.
Despite strong bullish momentum, Brent has not decisively crossed $110 because:
This means fear is supporting prices, but uncertainty is capping them.
For the United States, Brent above $100 increases pressure on gasoline, diesel, airline fuel, and freight costs.
This can:
Higher oil often benefits U.S. energy stocks, but broader equities may struggle if inflation returns.
China is one of the world’s largest crude importers. Higher Brent prices create serious challenges:
If oil stays elevated, China’s economic rebound could lose momentum.
For Russia, stronger global oil prices can create a revenue windfall despite sanctions pressure.
Higher Brent may:
This makes oil price spikes economically significant for Moscow.
Europe remains highly sensitive to energy shocks.
Brent above $106 may cause:
Germany, Italy, France, and broader EU economies remain exposed to imported energy volatility.
Many emerging economies suffer when oil rises because:
This can tighten financial conditions globally.
Nigeria may benefit from stronger crude prices through export earnings and FX inflows. However, domestic consumers are more focused on pump prices and inflation.
For Nigeria-specific impact, readers are also monitoring the fuel price today in Nigeria, where global crude moves can eventually shape transport and living costs.
| Benchmark | Price | Meaning |
|---|---|---|
| Brent Crude | $106.01 | Global benchmark |
| WTI Crude | Mid $90s range | U.S. benchmark |
| Spread | Around $10+ | Global supply stress premium |
| Scenario | Trigger | Target |
|---|---|---|
| Bullish | Hormuz disruption worsens | $110 to $115 |
| Neutral | Talks continue | $103 to $108 |
| Bearish | Supply fears fade | $98 to $102 |
The Brent crude oil price today April 24, 2026 is more than a commodity headline. It is a global economic warning signal.
For the United States, it may revive inflation concerns. For China, it raises factory costs. For Russia, it can boost revenues. For Europe, it threatens fragile energy stability.
If diplomacy holds, prices may stabilize. If tensions deepen, the next rally could reshape markets worldwide.
Brent crude oil price is rising today because global traders are pricing in supply disruption risks, tighter shipping flows, and continued geopolitical uncertainty around major export routes. When markets fear shortages, oil prices often jump quickly.
Brent crude could test $110 if supply tensions escalate further, inventories tighten, or shipping disruptions worsen. However, if diplomacy improves and exports normalize, prices may pull back below current levels.
Oil is back above $100 due to a mix of geopolitical shocks, restricted supply, stronger strategic buying, and fears that major producers cannot quickly replace lost barrels. Markets are also reacting to global inflation concerns.
When Brent crude rises, petrol and diesel prices often increase because crude oil is a major input cost for refined fuels. Consumers may feel the impact through higher transport fares, logistics costs, and pump prices.
For the United States, Brent above $100 can push gasoline prices higher, increase inflation pressure, weigh on consumer spending, and complicate Federal Reserve interest rate decisions. Energy companies may benefit while households face rising costs.
China is one of the world’s largest oil importers, so higher crude prices can raise factory costs, pressure manufacturing margins, and slow growth. It may also increase shipping and export costs globally.
Brent is considered the leading global benchmark because it prices much of the internationally traded crude market. WTI mainly reflects North American supply dynamics, while Brent often better captures world energy sentiment.
Higher oil prices can boost Russia’s export revenues and fiscal strength, especially if it maintains strong export volumes. However, sanctions, trade restrictions, and logistics costs can reduce some of that benefit.
Europe may face higher fuel bills, transport costs, inflation pressure, and slower industrial recovery when oil remains elevated. Energy intensive sectors such as chemicals, aviation, and manufacturing are often most exposed.
Oil prices could drop if peace talks succeed, supply routes reopen fully, recession fears rise, or major producers sharply increase output. Weak demand data can also trigger fast corrections.
Oil stocks can benefit when crude prices rise, but risks remain high because energy markets are volatile. Investors usually watch production costs, dividends, geopolitical developments, and balance sheet strength before investing.
If supply fears persist, Brent may remain supported above $100 and challenge $108 to $110. If tensions cool, the market could retreat toward $98 to $102 support zones.