The main tag of Gold Price Articles.
You can use the search box below to find what you need.
[wd_asp id=1]
The main tag of Gold Price Articles.
You can use the search box below to find what you need.
[wd_asp id=1]
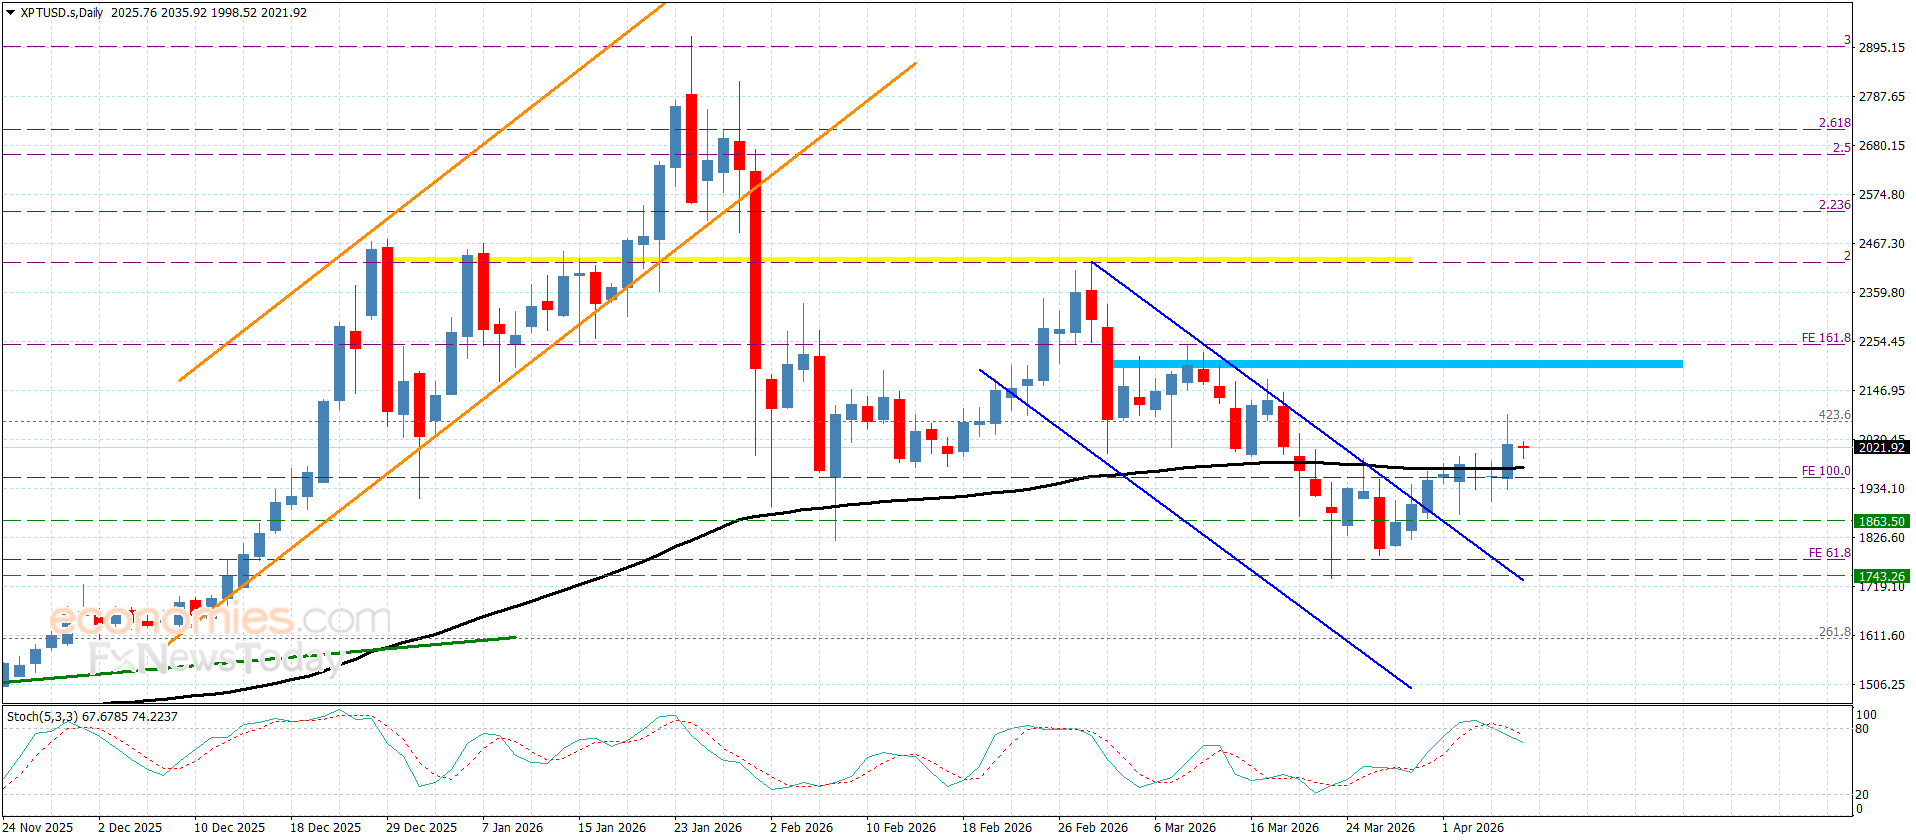
Platinum price forced to provide mixed trading after reaching $2093.00 level, due to the contradiction of the main indicators, specifically by stochastic exit from the overbought level, however, this won’t affect the bullish scenario due to its stability above the moving average 55, reinforcing the stability of the extra support at $1950.00.
Gathering extra positive momentum is important for breaching $2080.00 barrier, to begin targeting new positive stations that might begin at $2130.00 reaching the next resistance at $2205.00.
The expected trading range for today is between $1970.00 and $2130.00
Trend forecast: Bullish
Silver price (XAG/USD) trades calmly near $74.00 during the late Asian trading session on Thursday. The white metal struggles for direction amid uncertainty surrounding the first round of talks on a permanent ceasefire between the United States (US) and Iran in Pakistan on Saturday.
On late Wednesday, White House press secretary Karoline Leavitt stated that US President Donald Trump will send Vice President (VP) JD Vance-led team in Pakistan on Saturday to discuss the 10-point peace proposal shared by Iran as demands for a permanent ceasefire.
Ahead of US-Iran talks, Iran’s parliament speaker and chief negotiator, Mohammad Bagher Qalibaf has criticized the US, through a post on X, for violating three clauses of the 10-point proposal. Qalibaf alleged the US for attacking Lebanon, referring the first clause, which is “an immediate ceasefire everywhere, including Lebanon and other regions, effective immediately”.
The Silver price remained under pressure in the past few weeks, as oil prices gained sharply due to the closure of the Strait of Hormuz by Iran, as part of retaliation against military actions from the US and Israel.
Higher oil prices had prompted traders to raise hawkish bets for global central banks; however, they have eased significantly, following the announcement of the two-week ceasefire between the US and Iran.
According to the CME FedWatch tool, traders see a 76.4% chance that the Fed will keep interest rates steady this year, a sharp turnaround from expectations of two interest rate hikes built during the war.
Rising hopes of tight monetary conditions by the Fed bode poorly for non-yielding assets, such as Silver.
XAG/USD trades almost flat at around $74.00 as of writing, maintaining a bearish near-term bias as it holds beneath the 20-period Exponential Moving Average (EMA) at $74.89. The metal continues to consolidate near recent lows, with the modestly soft 14-day Relative Strength Index (RSI) around 46 suggesting subdued bullish momentum and leaving the path of least resistance tilted to the downside while price remains capped by the overhead EMA.
On the topside, initial resistance is defined by the 20-period EMA at $74.89, and a sustained break above this level would be needed to ease immediate downside pressure and open the way for a more meaningful recovery toward the April 2 high of $81.13. But until price reclaims the EMA, rallies are likely to be viewed as corrective within a weak short-term structure.
Looking down, the psychological level of $70.00 is the key support for the price, followed by the March 26 low of $66.70.
(The technical analysis of this story was written with the help of an AI tool.)
Silver is a precious metal highly traded among investors. It has been historically used as a store of value and a medium of exchange. Although less popular than Gold, traders may turn to Silver to diversify their investment portfolio, for its intrinsic value or as a potential hedge during high-inflation periods. Investors can buy physical Silver, in coins or in bars, or trade it through vehicles such as Exchange Traded Funds, which track its price on international markets.
Silver prices can move due to a wide range of factors. Geopolitical instability or fears of a deep recession can make Silver price escalate due to its safe-haven status, although to a lesser extent than Gold’s. As a yieldless asset, Silver tends to rise with lower interest rates. Its moves also depend on how the US Dollar (USD) behaves as the asset is priced in dollars (XAG/USD). A strong Dollar tends to keep the price of Silver at bay, whereas a weaker Dollar is likely to propel prices up. Other factors such as investment demand, mining supply – Silver is much more abundant than Gold – and recycling rates can also affect prices.
Silver is widely used in industry, particularly in sectors such as electronics or solar energy, as it has one of the highest electric conductivity of all metals – more than Copper and Gold. A surge in demand can increase prices, while a decline tends to lower them. Dynamics in the US, Chinese and Indian economies can also contribute to price swings: for the US and particularly China, their big industrial sectors use Silver in various processes; in India, consumers’ demand for the precious metal for jewellery also plays a key role in setting prices.
Silver prices tend to follow Gold’s moves. When Gold prices rise, Silver typically follows suit, as their status as safe-haven assets is similar. The Gold/Silver ratio, which shows the number of ounces of Silver needed to equal the value of one ounce of Gold, may help to determine the relative valuation between both metals. Some investors may consider a high ratio as an indicator that Silver is undervalued, or Gold is overvalued. On the contrary, a low ratio might suggest that Gold is undervalued relative to Silver.
Domestic coffee prices
The domestic coffee market this morning, April 9, recorded green again after a series of consecutive declines.
According to surveys in key growing areas of the Central Highlands, coffee prices simultaneously increased from 600 to 700 VND/kg, bringing the average price level of the whole region to the threshold of 85,900 VND/kg.
In Dak Nong province (old), the purchase price recorded an increase of 700 VND, pushing the price to the highest level in the region at 86,000 VND/kg.
Dak Lak and Gia Lai localities both had an increase of 600 VND, currently trading stably at the 85,800 VND/kg mark.
In Lam Dong province alone, coffee prices also recovered by 600 VND, currently listed at 85,300 VND/kg.
World coffee prices
On the international market, futures exchanges also recorded positive changes in last night’s trading session. The New York Stock Exchange led the upward momentum when the price of Arabica futures for May 2026 surged 7.95 cents (equivalent to 2.78%), closing at 294.05 cents/lb.
At the same time, the London exchange also witnessed the Robusta flush recover slightly by an additional 13 USD (equivalent to 0.39%), closing the session at 3,328 USD/ton. The main driving force for the coffee price to break through came from the fact that the Brazilian Real unexpectedly increased sharply to the highest level in 23 months against the USD. The strengthening of the Brazilian domestic currency has directly limited export sales activities from farmers in this country, and at the same time triggered a wave of short buys from speculative funds on the exchange.
Market outlook
In addition to the exchange rate factor, the market also received support from reports of a decrease in actual supply. The Brazilian Ministry of Commerce has just released data showing that coffee exports of this country in March decreased by 31% compared to the same period last year, reaching only about 151,000 tons.
For the Robusta line, the inventory shortage monitored by the ICE exchange continued to tighten when it fell to its lowest level in 3.75 months, with only 4,005 lots left. This information has temporarily eased the oversupply pressure that has weighed heavily on the market for the past two weeks.
However, the recovery momentum still faces major resistance from long-term macroeconomic forecasts. StoneX organization gave a cautious assessment when saying that the global coffee surplus in 2026 will expand to 10 million bags, marking the largest surplus in the last 6 years.
The prospect of a “super crop” in Brazil with expected output reaching a record 75.9 million bags from Marex Group Plc is still the main factor holding back Arabica prices. In Vietnam, the growth momentum of coffee exports in the first quarter reached 14% (equivalent to 585,000 tons) is also a barrier that prevents Robusta prices from breaking through too strongly.
In the current context, geopolitical and weather factors still play a role as price supporting variables. The continued closure of the Strait of Hormuz is still putting pressure on shipping costs, insurance and fuel costs for global roasters.
In addition, rainfall in key farming areas of Brazil such as Minas Gerais last week only reached 47% of the historical average, raising concerns about actual yield compared to theoretical figures on paper.
The actual price at the purchasing yards may differ depending on the quality of the seeds and the actual transaction agreement.
World oil prices today
World gasoline and oil prices fluctuated sharply. At the end of yesterday’s trading session, WTI oil prices decreased by 16.41%, and Brent oil decreased by 13.29%.
By this morning’s session, both oil commodities reversed to increase. At 7:30 am (Vietnam time), WTI crude oil price was at 97.04 USD/barrel, up 2.63 USD/barrel, equivalent to an increase of 2.79 percent. WTI oil closed the previous trading session at 94.41 USD/barrel and opened today’s session at 96.63 USD/barrel.
Brent oil price was at 97.10 USD/barrel, up 0.715 USD/barrel, equivalent to an increase of 0.74%. Brent oil price closed the previous trading session at 96.30 USD/barrel and opened today’s session at 96.40 USD/barrel.
According to analysts, developments related to the Strait of Hormuz are causing strong fluctuations in world oil prices.
After President Donald Trump announced a 2-week postponement of Iran’s civilian infrastructure attack plan, oil prices fluctuated sharply. This move was described by him as part of a “two-way ceasefire agreement”, depending on Iran reopening the Strait of Hormuz.
The US has received a 10-point proposal from Tehran, which is seen as the basis for negotiations, and emphasized the delay to create more time to complete a potential agreement. Iran agreed to reopen the Strait of Hormuz temporarily if hostilities are stopped, with transportation activities coordinated by its armed forces. Israel is also said to have accepted this agreement.
Previously, the near-closure of the Strait of Hormuz – a shipping route transporting about 20% of global oil supplies – had significantly disrupted the energy market.
Domestic gasoline prices today
On April 9, retail gasoline and oil prices according to the price list announced by Petrolimex in region 1 and region 2 are as follows:
Gasoline and oil discount today
– Hoang Trong General Trading Co., Ltd.:
+ Hai Linh Warehouse, Petec, Dinh Vu: Diesel Oil 0.05S: 8,000 VND/liter; RON 95 – III gasoline: 3,000 VND/liter.
+ Bac Ninh Warehouse: Diesel Oil 0.05S: 7,850 VND/liter; RON 95 – III gasoline: 2,850 VND/liter.
+ Nghi Son Warehouse: Diesel Oil 0.05S: 8,000 VND/liter; RON 95 – III gasoline: 3,000 VND/liter.
– Tu Luc Petroleum Joint Stock Company 1:
+ Diesel oil 0.05S – II: 5,500 VND/liter;
+ Diesel oil 0.001S-V: 5,200 VND/liter;
+ RON 95 – III gasoline: 1,500 VND/liter;
+ E5 gasoline: 1,500 VND/liter.
– MIPEC Petroleum Trading and Trading Co., Ltd. – MIPEC Petro (applied to the Northern region):
+ RON 95 – III gasoline: 1,500 VND/liter.
+ Diesel oil 0.05S-II: 1,500 VND/liter.
+ Diesel oil 0.05S: 13,000 VND/liter.
Domestic gasoline and oil price forecast for the next period
According to a representative of a gasoline and oil business, domestic gasoline and oil prices will fluctuate according to the world gasoline and oil situation. According to current market developments, it is predicted that in the next price adjustment period, retail gasoline and oil prices may decrease. In which, oil prices are forecast to decrease very sharply.
Today’s gasoline and oil prices are for reference only and may change according to market developments.
Refer to more articles about gasoline and oil prices HERE.
Important DisclaimersFXEmpire is owned and operated by Empire Media Network LTD., Company Registration Number 514641786, registered at 7 Jabotinsky Road, Ramat Gan 5252007, Israel. The content provided on this website includes general news and publications, our personal analysis and opinions, and materials provided by third parties. This content is intended for educational and research purposes only. It does not constitute, and should not be interpreted as, a recommendation or advice to take any action, including making any investment or purchasing any product. Before making any financial decision, you should conduct your own due diligence, exercise your own discretion, and consult with competent advisors. The content on this website is not personally directed to you, and we do not take into account your individual financial situation or needs. The information contained on this website is not necessarily provided in real time, nor is it guaranteed to be accurate. Prices displayed may be provided by market makers and not by exchanges. Any trading or other financial decision you make is entirely your own responsibility, and you must not rely solely on any information provided through the website. FXEmpire does not provide any warranty regarding the accuracy, completeness, or reliability of any information contained on the website and shall bear no responsibility for any trading losses you may incur as a result of using such information. The website may include advertisements and other promotional content. FXEmpire may receive compensation from third parties in connection with such content. FXEmpire does not endorse, recommend, or assume responsibility for the use of any third-party services or websites. Empire Media Network LTD., its employees, officers, subsidiaries, and affiliates shall not be liable for any loss or damage resulting from your use of the website or reliance on the information provided herein.Risk DisclaimersThis website contains information about cryptocurrencies, contracts for difference (CFDs), and other financial instruments, as well as about brokers, exchanges, and other entities trading in such instruments. Both cryptocurrencies and CFDs are complex instruments and involve a high risk of losing money. You should carefully consider whether you understand how these instruments work and whether you can afford to take the high risk of losing your money. FX Empire encourages you to conduct your own research before making any investment decision and to avoid investing in any financial instrument unless you fully understand how it works and the risks involved.
Silver (XAG/USD) trades with a positive bias on Wednesday, supported by a broadly weaker US Dollar following a two-week ceasefire agreement between the United States and Iran. At the time of writing, XAG/USD is trading around $74.50, up nearly 2% on the day after hitting an intraday high of $77.65.
Despite the softer Greenback, the metal struggles to extend gains as traders continue to assess evolving geopolitical risks. While Crude prices retreated sharply after the ceasefire news, the decline has stalled amid uncertainty around the durability of the agreement.
Reports of airstrikes across the Middle East, including Israeli strikes on Lebanon and attacks reported in Saudi Arabia, the UAE, Kuwait, Qatar, and Bahrain, highlight persistent tensions. Iranian officials have also warned that Tehran could withdraw from the ceasefire agreement if attacks on Lebanon continue.
This keeps markets on edge over whether a full resolution can be reached and whether Oil prices can see a meaningful and sustained decline. Until then, expectations for tighter monetary policy are likely to remain in place, limiting further upside in non-yielding assets like Silver.
From a technical perspective, the 4-hour chart shows XAG/USD trading within a bearish flag pattern. The near-term bias is mixed as prices stabilize between key moving averages.
The 100-period Simple Moving Average (SMA) at $72.63, which closely aligns with the lower boundary of the flag, is acting as immediate support and cushioning the downside. A break below this level could confirm a bearish continuation, exposing the next support at Tuesday’s low near $68.28, followed by the March swing low around $61.00.
On the upside, the 200-period SMA near $79.00 coincides with the upper boundary of the flag and continues to cap gains. A sustained break above this zone would negate the bearish structure and could trigger a recovery toward the mid-$80s, with scope to extend toward the $90.00 region.
Momentum indicators remain mildly constructive. The Relative Strength Index (RSI) is hovering in the mid-50s, while the Moving Average Convergence Divergence (MACD) remains in positive territory, suggesting steady buying interest despite the consolidation within the broader uptrend.
Silver is a precious metal highly traded among investors. It has been historically used as a store of value and a medium of exchange. Although less popular than Gold, traders may turn to Silver to diversify their investment portfolio, for its intrinsic value or as a potential hedge during high-inflation periods. Investors can buy physical Silver, in coins or in bars, or trade it through vehicles such as Exchange Traded Funds, which track its price on international markets.
Silver prices can move due to a wide range of factors. Geopolitical instability or fears of a deep recession can make Silver price escalate due to its safe-haven status, although to a lesser extent than Gold’s. As a yieldless asset, Silver tends to rise with lower interest rates. Its moves also depend on how the US Dollar (USD) behaves as the asset is priced in dollars (XAG/USD). A strong Dollar tends to keep the price of Silver at bay, whereas a weaker Dollar is likely to propel prices up. Other factors such as investment demand, mining supply – Silver is much more abundant than Gold – and recycling rates can also affect prices.
Silver is widely used in industry, particularly in sectors such as electronics or solar energy, as it has one of the highest electric conductivity of all metals – more than Copper and Gold. A surge in demand can increase prices, while a decline tends to lower them. Dynamics in the US, Chinese and Indian economies can also contribute to price swings: for the US and particularly China, their big industrial sectors use Silver in various processes; in India, consumers’ demand for the precious metal for jewellery also plays a key role in setting prices.
Silver prices tend to follow Gold’s moves. When Gold prices rise, Silver typically follows suit, as their status as safe-haven assets is similar. The Gold/Silver ratio, which shows the number of ounces of Silver needed to equal the value of one ounce of Gold, may help to determine the relative valuation between both metals. Some investors may consider a high ratio as an indicator that Silver is undervalued, or Gold is overvalued. On the contrary, a low ratio might suggest that Gold is undervalued relative to Silver.
Domestic coffee prices
The coffee market this morning, April 8th, recorded a simultaneous decrease of 4,000 VND in all key purchasing areas in the Central Highlands region.
The average price across the region is currently only anchored at the threshold of 85. 200 VND/kg after the sell-off wave on international exchanges spread widely.
Specifically, in Dak Nong province (old), the purchase price retreated to 85,300 VND/kg, while in Dak Lak and Gia Lai it stood at the same mark of 85,200 VND/kg.
Lam Dong province currently has the lowest price in the region when trading around the threshold of 84,700 VND/kg.
World coffee prices
On international exchanges, coffee prices also simultaneously decreased sharply due to the impact of the latest supply and demand forecasts.
The London exchange witnessed the price of Robusta for May 2026 delivery fall 133 USD, closing at 3,315 USD/ton, this is the lowest level for near futures in the past 8 months.
On the New York exchange, Arabica prices also fell 11.95 cents to 286.10 cents/lb. Investors are stepping up position liquidation as they face information that the global coffee surplus in 2026 could reach 10 million bags according to StoneX’s forecast. This is considered the largest surplus in the last 6 years, putting heavy pressure on market sentiment.
Market outlook
The main reason for this price reduction comes from the prospect of abundant supply from major producing countries. Marex Group forecasts Brazil’s output in the next crop year to reach a record 75.9 million bags, an increase of more than 15% compared to the previous year. At the same time, Vietnam’s Q1 export figures increased by 14% to 585,000 tons, showing that goods are circulating quite strongly in the international market. Although factors such as the closure of the Strait of Hormuz or low rainfall in Brazil are still supporting transportation costs and crop risks, that is not enough to stop the decline as record surplus reports continuously appear.
It is forecasted that in the coming time, domestic coffee prices will continue to face a major challenge around the threshold of 84,000 – 85,000 VND/kg.
The EURJPY pair renewed the positive attempts since yesterday, due to the continuation of providing positive momentum by the main indicators by its rally above the initial resistance at 184.80, to test the barrier at 185.45 to bounce directly to settle near 184.90.
The price might be forced to provide mixed trading by its stability below 184.45, and there is a chance for forming bearish waves to target 184.20 and 183.70 level, while its success to surpass the barrier at 185.45 will open the way for forming strong bullish waves, to expect reaching 186.00 initially, reaching 186.65.
The expected trading range for today is between 184.40 and 185.45
Trend forecast: Fluctuated
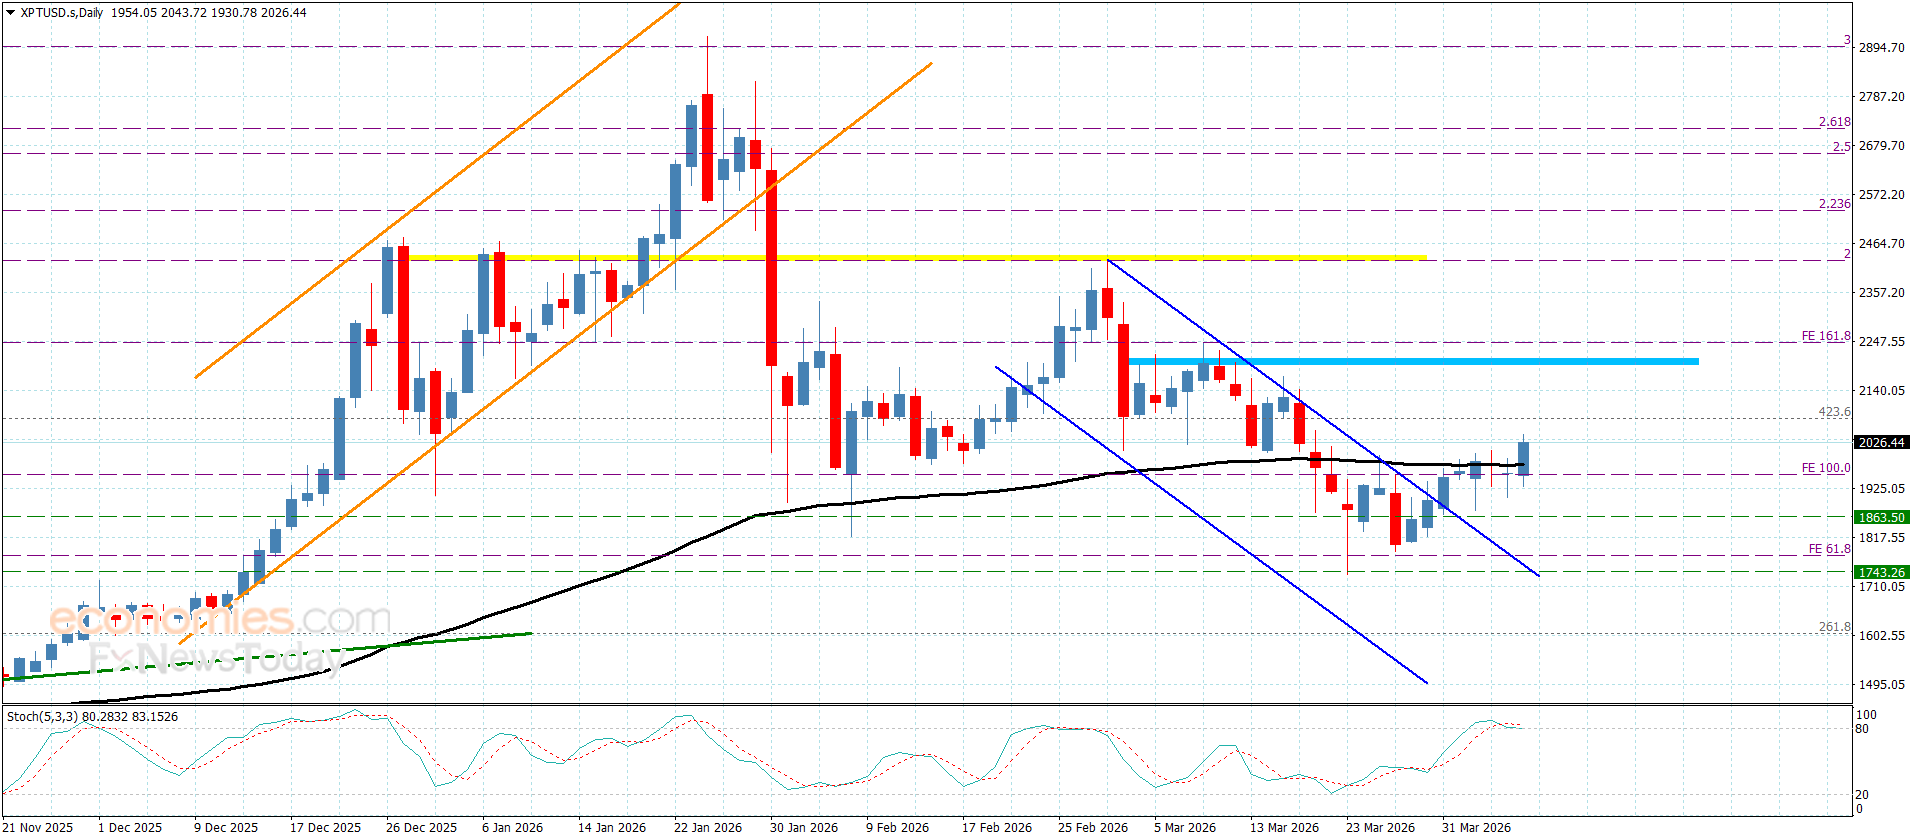
Platinum price succeeded to surpass the moving average 55 by forming new bullish wave, achieving $2045.00 level this morning, which requires providing a new positive close above $1950.00 level, to confirm its readiness to form new bullish waves by reaching $2070.00, and surpassing this barrier might extend the trading towards $2130.00 reaching the next resistance at $2205.00 level.
While the return of fluctuation below $1950.00 will force it to activate the bearish corrective track again, forcing it to suffer some losses by reaching $1865.00 and $1800.00 before any new attempt to achieve any of the suggested positive targets.
The expected trading range for today is between $1950.00 and $2130.00
Trend forecast: Bullish
BitcoinWorld
Silver Price Forecast: XAG/USD Consolidates at Critical $73.00 Pivot Amid Market Uncertainty
Global silver markets entered a critical consolidation phase this week, with the XAG/USD pair hovering around the significant $73.00 level. This pivotal price point coincides precisely with the 200-period Exponential Moving Average (EMA) on key trading charts, creating a technical battleground that could determine the precious metal’s near-term trajectory. Market analysts globally are scrutinizing this convergence of price and momentum indicator, as it often signals major trend decisions. Consequently, traders await clear directional signals from both technical patterns and fundamental macroeconomic data.
The $73.00 level represents more than just a psychological round number for XAG/USD. Currently, it acts as a confluence zone where several critical technical factors intersect. Firstly, the 200-period EMA on the four-hour chart provides dynamic resistance. Secondly, this area previously served as both support and resistance throughout the previous quarter. A sustained break above this barrier could open the path toward the next resistance cluster near $75.50. Conversely, rejection here might see silver retreat toward the $70.00 support level. Market volume profiles indicate significant liquidity resides around this price, suggesting heightened volatility potential.
Technical indicators present a mixed picture, reflecting the current consolidation. The Relative Strength Index (RSI) on daily timeframes oscillates near the 50 midline, indicating a balance between buying and selling pressure. Meanwhile, the Moving Average Convergence Divergence (MACD) histogram shows minimal momentum, with its signal line flattening. This technical indecision typically precedes a substantial price movement. Chart patterns, including a symmetrical triangle formation on lower timeframes, suggest a compression of energy that will eventually resolve with a breakout.
Understanding the immediate technical landscape requires examining specific price thresholds. The following table outlines the crucial support and resistance zones traders are monitoring:
| Level | Type | Significance |
|---|---|---|
| $75.50 – $76.00 | Resistance | Previous swing high & 50-week EMA |
| $73.00 – $73.50 | Pivot Zone | Current price & 200-period EMA |
| $70.00 | Support | Psychological level & recent low |
| $68.20 | Strong Support | 2024 yearly opening price |
Beyond the charts, fundamental forces exert considerable pressure on silver prices. The primary driver remains the outlook for U.S. monetary policy and interest rates. Market participants closely watch Federal Reserve communications for clues on the timing of potential rate cuts. Higher interest rates typically strengthen the U.S. dollar, which weighs on dollar-denominated commodities like silver. However, silver also benefits from its status as an inflation hedge. Consequently, persistent inflation data can create conflicting impulses for the metal.
Industrial demand constitutes another crucial fundamental pillar. Silver possesses extensive applications in photovoltaic solar panels, electronics, and automotive sectors. Therefore, global manufacturing PMI data and green energy investment trends directly impact physical demand forecasts. Recent reports from the Silver Institute indicate a structural supply deficit persists, providing a underlying supportive floor for prices. Geopolitical tensions and central bank diversification into precious metals further contribute to a complex demand picture.
Financial institutions provide nuanced perspectives on the current standoff. Analysts at major banks note that trader positioning data from the Commodity Futures Trading Commission (CFTC) shows managed money net-long positions have decreased slightly from recent highs. This suggests some profit-taking occurred near the $73.00 region. However, the overall net-long stance remains substantial, indicating underlying bullish conviction. Meanwhile, physical silver holdings in exchange-traded funds (ETFs) like iShares Silver Trust (SLV) have shown marginal outflows, reflecting a cautious short-term sentiment among some investors.
Seasonal patterns also offer context. Historically, the second quarter often brings increased volatility for precious metals. This period frequently aligns with renewed focus on industrial demand projections and mid-year portfolio rebalancing. Consequently, the current consolidation may represent a pause before seasonal trends reassert their influence. Market technicians emphasize that a confirmed close above the 200-period EMA with strong volume would significantly improve the technical outlook, potentially triggering algorithmic buying programs.
Silver’s performance must be evaluated relative to other market assets to gain full context. The gold-to-silver ratio, a closely watched metric, currently sits near 85 ounces of silver to buy one ounce of gold. This ratio remains above its long-term historical average, suggesting silver may be undervalued relative to gold. Such a disparity often attracts value-oriented investors to the white metal. Additionally, silver has recently demonstrated lower correlation with equity markets, enhancing its potential role in diversified portfolios during periods of stock market uncertainty.
Compared to industrial metals like copper, silver shows a hybrid behavior. It sometimes tracks copper on industrial demand optimism but decouples during risk-off sentiment, reverting to its safe-haven characteristics. This dual nature makes its price action particularly sensitive to shifts in broader market narratives between growth and caution. Key factors to monitor include:
Market consensus outlines several plausible paths forward from the $73.00 consolidation. The bullish scenario requires a decisive breakout above $73.50, confirmed by a weekly close. This could propel XAG/USD toward testing the $76.00 resistance, with an extended target near $78.00 if macroeconomic conditions turn favorable. The neutral scenario envisions continued range-bound trading between $70.00 and $75.00, as markets await clearer signals on interest rates and economic growth. The bearish scenario would involve a breakdown below the $70.00 support, potentially targeting a retest of the $68.20 region.
Risk management remains paramount for traders navigating this pivotal zone. Volatility expectations, derived from options pricing, have edged higher, reflecting uncertainty about the impending directional move. Many trading desks advise using defined-risk strategies like option spreads or waiting for a confirmed breakout before committing significant capital. The coming sessions will likely provide the catalyst needed to resolve this technical stalemate, with major economic data releases on the calendar serving as potential triggers.
The silver price forecast hinges on the outcome of the current consolidation around the critical $73.00 level and the 200-period EMA. This technical confluence zone represents a major decision point for XAG/USD, with the direction of the next significant move dependent on both chart patterns and fundamental developments. Traders and investors should monitor volume on breakout attempts, key U.S. economic data, and broader commodity market sentiment. Ultimately, the resolution of this standoff will provide valuable signals for the medium-term trend in silver markets, impacting portfolio allocations across the precious metals complex.
Q1: What does it mean when a price consolidates at a moving average?
Consolidation at a moving average, like the 200-period EMA, indicates a period of price indecision and equilibrium between buyers and sellers. The moving average acts as a dynamic support or resistance level. A sustained break above or below it often signals the resumption of a trend, making it a pivotal area for technical analysis.
Q2: Why is the $73.00 level specifically important for XAG/USD?
The $73.00 level is important due to technical confluence. It aligns with a major moving average (200-period EMA), represents a previous area of market reaction (support/resistance), and is a round psychological number. Such confluence zones attract high trading activity and often dictate short-term market direction.
Q3: How do interest rates affect the price of silver?
Higher interest rates typically strengthen the U.S. dollar, making dollar-priced silver more expensive for holders of other currencies, which can dampen demand. They also increase the opportunity cost of holding non-yielding assets like silver. Conversely, expectations of lower rates can weaken the dollar and make silver more attractive, potentially boosting its price.
Q4: What is the significance of the gold-to-silver ratio mentioned?
The gold-to-silver ratio measures how many ounces of silver it takes to purchase one ounce of gold. A ratio above the historical average (around 60-70) can suggest silver is relatively undervalued compared to gold. Some investors use this metric to decide whether to allocate funds to silver or gold, viewing a high ratio as a potential buying signal for silver.
Q5: What key data should I watch to gauge silver’s next move?
Key data includes U.S. inflation reports (CPI, PCE), Federal Reserve meeting minutes and statements, U.S. Dollar Index (DXY) movements, global manufacturing PMI data (for industrial demand insight), and weekly CFTC Commitment of Traders reports to see positioning changes by large speculators and commercial traders.
This post Silver Price Forecast: XAG/USD Consolidates at Critical $73.00 Pivot Amid Market Uncertainty first appeared on BitcoinWorld.