The main tag of Gold Price Articles.
You can use the search box below to find what you need.
[wd_asp id=1]
The main tag of Gold Price Articles.
You can use the search box below to find what you need.
[wd_asp id=1]
WTI crude oil settled at $112.41 per barrel on Monday, April
7, 2026, while Brent closed at $109.77, as President Trump’s Tuesday night
ultimatum for Iran to reopen the Strait of Hormuz kept the market on edge. Both
benchmarks have nearly doubled since January, when WTI traded below $58, making
this the steepest year-to-date rally since 2008.
Six months ago, the oil price prediction consensus centered
on oversupply and sub-$60 crude. The effective closure of the Strait, through
which 20% of global oil supply once flowed daily, has replaced that narrative
entirely.
Goldman Sachs now calls it the largest supply shock in the
history of the global crude market, and the question facing traders is no
longer whether prices stay elevated, but how high they can go.
Follow
me on X for real-time market analysis: @ChmielDk
The war
between the US-Israeli coalition and Iran, which began on February 28 with
coordinated strikes on Iranian nuclear facilities, has now entered its sixth
week with no resolution in sight. Trump gave Iran until Tuesday, April 8, at 8
PM ET to reopen the Strait or face strikes on every bridge and power plant in
the country. Iran rejected Washington’s ceasefire proposal and submitted its
own 10-point plan, which includes a permanent end to hostilities and the
lifting of sanctions, according to Axios.
The scale
of supply destruction is historic. TD Securities estimates nearly 1 billion
barrels will be lost by the end of April, comprising approximately 600 million
barrels of crude and 350 million barrels of refined products. Ryan McKay,
senior commodity strategist at TD Securities, wrote in a note to clients that
the conflict lasting into deep April means the supply math is getting worse by
the day. Rapidan Energy projects a total net loss of 630 million barrels of oil
and products by the end of June.
Samer Hasn,
Senior Market Analyst at XS.com, noted that the continued surge comes as
markets anticipate further escalation, which threatens structural disruption to
crude oil supply chains originating in the region. He added that energy markets
are bracing for a massive supply shock as the geopolitical theater enters the
most dangerous phase of the war.
OPEC+
agreed on Sunday to boost production by 206,000 barrels per day in May, but as Finance Magnates’ analysis of the
74% three-week oil price surge from March 9 established, the theoretical increase is meaningless while
the Strait remains closed and Gulf infrastructure sustains ongoing damage. Kuwait
Petroleum Corporation reported significant drone damage to several operational
facilities over the weekend. OPEC+ itself warned that repairing energy
infrastructure attacked during the conflict is costly and time-consuming.
However, there are early signs of a partial thaw. Shipping
data from S&P Global Market Intelligence showed 8 tankers transited the
Strait on Monday, up from fewer than 2 per day throughout March. That remains a
fraction of prewar volumes, but represents the first measurable improvement
since hostilities began.
Konstantinos Chrysikos, Head of Customer Relationship
Management at Kudotrade, noted that early signs of potential de-escalation have
tempered supply concerns to a degree, pushing prices down from intraday highs.
But he cautioned that underlying conditions remain fragile and vessel transit
through the Strait remains limited.
My chart shows WTI crude has been trading since early March
within a volatility channel that mirrors the price range observed during the
2022 Ukraine war spike. Based on my over 15 years of experience as an analyst
and trader, this is a structurally significant pattern.
The resistance zone at $114-$115 per barrel forms the upper
boundary of the current consolidation. WTI has tested this area for three
consecutive sessions without a decisive breakout. In 2022, this same price zone
marked the beginning of the final push toward the $130 intraday high. A
sustained close above $115 would suggest the market is repricing for a
prolonged disruption scenario rather than a near-term resolution.
The lower boundary sits at approximately $84 per barrel,
corresponding to the session lows from early March that were subsequently
retested in late March. This level coincides with the 50-day exponential moving
average, reinforcing its importance as dynamic support. As the Finance
Magnates coverage of the initial Strait of Hormuz closure from March 2
documented, the oil price gap that opened between $66 and $84 during the first
week of the conflict remains partially unfilled.
Oil WTI price technical analysis. Source: Tradingview.com
The structural dividing line between a bullish and bearish
WTI outlook sits near $70 per barrel, where the 200-day moving average
currently runs. This level also intersects with the bullish gap from the
February-March 2022 Ukraine war breakout. A retreat below the 200 MA would
require either a ceasefire or a resolution far more comprehensive than what is
currently on the table.
|
Level |
Type |
Notes |
|
$130 |
Historical resistance |
2022 intraday high, next target if $115 breaks |
|
$114-$115 |
Resistance zone |
Current consolidation ceiling, tested 3 sessions |
|
$112.41 |
Current price |
WTI settlement, April 7, 2026 |
|
$84 |
Support / 50 EMA |
March lows, retested late March |
|
$70 |
200 MA / Trend line |
Bullish/bearish structural dividing line |
My directional bias remains cautiously bullish as long as
price holds above the 50 EMA at $84. A breakout above $115 targets $130 and
potentially higher. However, the outcome depends less on technical patterns and
more on whether the current crisis produces a diplomatic resolution or an
escalation.
As I noted in previous Finance
Magnates oil market coverage, the fundamentals shifted the oil narrative
from oversupply to supply crisis in under five weeks, and they can shift it
back just as quickly.
The institutional consensus has undergone a dramatic
revision since February. Before the conflict, Goldman Sachs projected WTI
averaging $53 per barrel in 2026. That forecast now looks like it belongs to a
different era.
Goldman Sachs, led by commodities analyst Daan Struyven,
raised its 2026 average Brent forecast to $85 per barrel on March 22, up from
$77, with the WTI forecast lifted to $79 from $72. The bank’s model assumes
roughly six weeks of severely restricted Hormuz flows. For Q4 2026, Goldman’s
base case sits at $71 Brent and $67 WTI, but its risk scenario, which assumes a
two-month disruption, pushes Q4 Brent to $93. Goldman has flagged a peak
scenario at $135 per barrel if the market needs to force demand destruction to
offset six months of restricted supply.
JPMorgan issued the most aggressive warning among major
banks. The bank’s commodities team cautioned that Brent could overshoot toward
$150 per barrel if the Strait of Hormuz stays effectively shut into mid-May. As
the Finance
Magnates analysis of $200 oil scenarios from March 30 outlined, Macquarie
and Wood Mackenzie have sketched similar upside ranges, though the $200 level
remains an extreme tail risk rather than a base case.
The U.S. Energy Information Administration, whose updated
Short-Term Energy Outlook was due for release on April 7, projected in its
March report that Brent would remain above $95 over the next two months before
falling below $80 in Q3 and toward $70 by year-end. That forecast assumes the
Strait gradually reopens, a condition that has yet to materialize.
The futures curve tells its own story. As oil
traders increasingly turn to prediction markets for forward signals, the
Brent forward curve prices a decline to $90 by August and below $80 by
December, indicating the market’s base expectation remains that the disruption
is temporary.
|
Source |
Target |
Timeframe / Notes |
|
JPMorgan |
$150 Brent |
If Hormuz closed into mid-May |
|
Goldman Sachs (risk) |
$135 Brent |
Peak, 6 months of restricted supply |
|
Goldman Sachs (base) |
$85 avg / $71 Q4 Brent |
2026 average, assumes 6-week disruption |
|
EIA |
$95+ near-term, $70 year-end |
Assumes gradual Strait reopening |
|
Brent futures curve |
$90 Aug / sub-$80 Dec |
Market-implied, as of April 7 |
|
Goldman Sachs (pre-war) |
$53 WTI avg |
November 2025 forecast, now obsolete |
JPMorgan warns Brent crude could overshoot toward $150 per
barrel if the Strait of Hormuz remains effectively closed into mid-May. Goldman
Sachs has flagged an extreme peak scenario at $135 per barrel. WTI crude
settled at $112.41 on April 7, 2026, up roughly 96% year-to-date. The outcome
depends primarily on the duration and intensity of the Iran conflict.
The
US-Israeli war on Iran, which began February 28, 2026, effectively closed the
Strait of Hormuz, choking off approximately 20% of global seaborne oil supply. TD
Securities estimates nearly 1 billion barrels of crude and products will be
lost by end of April. This represents the largest supply disruption in the
history of the global crude market, according to Goldman Sachs.
The EIA projects Brent falling below $80 per barrel by Q3
and toward $70 by year-end, assuming the Strait of Hormuz gradually reopens.
Goldman Sachs’ Q4 2026 base case is $71 Brent and $67 WTI. A ceasefire deal
between the US and Iran would likely trigger a rapid decline in crude prices,
as the futures curve already prices Brent at $90 by August.
A full reopening of the Strait would remove the war premium
currently embedded in crude prices. Before the conflict, Goldman Sachs
projected WTI averaging $53 in 2026. However, analysts caution that even after
a ceasefire, infrastructure damage to Gulf production facilities means supply
normalization could take months, limiting the pace of any price decline.
Goldman Sachs’ base case projects $71 Brent and $67 WTI by
Q4 2026. Under a risk scenario where Hormuz disruptions last two months,
Goldman sees Q4 Brent at $93. JPMorgan’s pre-war outlook assumed Brent
returning to the $60 range. The EIA forecasts approximately $70 Brent by
December, contingent on resumed Strait flows and US production growth averaging
13.6 million barrels per day.
WTI crude oil settled at $112.41 per barrel on Monday, April
7, 2026, while Brent closed at $109.77, as President Trump’s Tuesday night
ultimatum for Iran to reopen the Strait of Hormuz kept the market on edge. Both
benchmarks have nearly doubled since January, when WTI traded below $58, making
this the steepest year-to-date rally since 2008.
Six months ago, the oil price prediction consensus centered
on oversupply and sub-$60 crude. The effective closure of the Strait, through
which 20% of global oil supply once flowed daily, has replaced that narrative
entirely.
Goldman Sachs now calls it the largest supply shock in the
history of the global crude market, and the question facing traders is no
longer whether prices stay elevated, but how high they can go.
Follow
me on X for real-time market analysis: @ChmielDk
The war
between the US-Israeli coalition and Iran, which began on February 28 with
coordinated strikes on Iranian nuclear facilities, has now entered its sixth
week with no resolution in sight. Trump gave Iran until Tuesday, April 8, at 8
PM ET to reopen the Strait or face strikes on every bridge and power plant in
the country. Iran rejected Washington’s ceasefire proposal and submitted its
own 10-point plan, which includes a permanent end to hostilities and the
lifting of sanctions, according to Axios.
The scale
of supply destruction is historic. TD Securities estimates nearly 1 billion
barrels will be lost by the end of April, comprising approximately 600 million
barrels of crude and 350 million barrels of refined products. Ryan McKay,
senior commodity strategist at TD Securities, wrote in a note to clients that
the conflict lasting into deep April means the supply math is getting worse by
the day. Rapidan Energy projects a total net loss of 630 million barrels of oil
and products by the end of June.
Samer Hasn,
Senior Market Analyst at XS.com, noted that the continued surge comes as
markets anticipate further escalation, which threatens structural disruption to
crude oil supply chains originating in the region. He added that energy markets
are bracing for a massive supply shock as the geopolitical theater enters the
most dangerous phase of the war.
OPEC+
agreed on Sunday to boost production by 206,000 barrels per day in May, but as Finance Magnates’ analysis of the
74% three-week oil price surge from March 9 established, the theoretical increase is meaningless while
the Strait remains closed and Gulf infrastructure sustains ongoing damage. Kuwait
Petroleum Corporation reported significant drone damage to several operational
facilities over the weekend. OPEC+ itself warned that repairing energy
infrastructure attacked during the conflict is costly and time-consuming.
However, there are early signs of a partial thaw. Shipping
data from S&P Global Market Intelligence showed 8 tankers transited the
Strait on Monday, up from fewer than 2 per day throughout March. That remains a
fraction of prewar volumes, but represents the first measurable improvement
since hostilities began.
Konstantinos Chrysikos, Head of Customer Relationship
Management at Kudotrade, noted that early signs of potential de-escalation have
tempered supply concerns to a degree, pushing prices down from intraday highs.
But he cautioned that underlying conditions remain fragile and vessel transit
through the Strait remains limited.
My chart shows WTI crude has been trading since early March
within a volatility channel that mirrors the price range observed during the
2022 Ukraine war spike. Based on my over 15 years of experience as an analyst
and trader, this is a structurally significant pattern.
The resistance zone at $114-$115 per barrel forms the upper
boundary of the current consolidation. WTI has tested this area for three
consecutive sessions without a decisive breakout. In 2022, this same price zone
marked the beginning of the final push toward the $130 intraday high. A
sustained close above $115 would suggest the market is repricing for a
prolonged disruption scenario rather than a near-term resolution.
The lower boundary sits at approximately $84 per barrel,
corresponding to the session lows from early March that were subsequently
retested in late March. This level coincides with the 50-day exponential moving
average, reinforcing its importance as dynamic support. As the Finance
Magnates coverage of the initial Strait of Hormuz closure from March 2
documented, the oil price gap that opened between $66 and $84 during the first
week of the conflict remains partially unfilled.
Oil WTI price technical analysis. Source: Tradingview.com
The structural dividing line between a bullish and bearish
WTI outlook sits near $70 per barrel, where the 200-day moving average
currently runs. This level also intersects with the bullish gap from the
February-March 2022 Ukraine war breakout. A retreat below the 200 MA would
require either a ceasefire or a resolution far more comprehensive than what is
currently on the table.
|
Level |
Type |
Notes |
|
$130 |
Historical resistance |
2022 intraday high, next target if $115 breaks |
|
$114-$115 |
Resistance zone |
Current consolidation ceiling, tested 3 sessions |
|
$112.41 |
Current price |
WTI settlement, April 7, 2026 |
|
$84 |
Support / 50 EMA |
March lows, retested late March |
|
$70 |
200 MA / Trend line |
Bullish/bearish structural dividing line |
My directional bias remains cautiously bullish as long as
price holds above the 50 EMA at $84. A breakout above $115 targets $130 and
potentially higher. However, the outcome depends less on technical patterns and
more on whether the current crisis produces a diplomatic resolution or an
escalation.
As I noted in previous Finance
Magnates oil market coverage, the fundamentals shifted the oil narrative
from oversupply to supply crisis in under five weeks, and they can shift it
back just as quickly.
The institutional consensus has undergone a dramatic
revision since February. Before the conflict, Goldman Sachs projected WTI
averaging $53 per barrel in 2026. That forecast now looks like it belongs to a
different era.
Goldman Sachs, led by commodities analyst Daan Struyven,
raised its 2026 average Brent forecast to $85 per barrel on March 22, up from
$77, with the WTI forecast lifted to $79 from $72. The bank’s model assumes
roughly six weeks of severely restricted Hormuz flows. For Q4 2026, Goldman’s
base case sits at $71 Brent and $67 WTI, but its risk scenario, which assumes a
two-month disruption, pushes Q4 Brent to $93. Goldman has flagged a peak
scenario at $135 per barrel if the market needs to force demand destruction to
offset six months of restricted supply.
JPMorgan issued the most aggressive warning among major
banks. The bank’s commodities team cautioned that Brent could overshoot toward
$150 per barrel if the Strait of Hormuz stays effectively shut into mid-May. As
the Finance
Magnates analysis of $200 oil scenarios from March 30 outlined, Macquarie
and Wood Mackenzie have sketched similar upside ranges, though the $200 level
remains an extreme tail risk rather than a base case.
The U.S. Energy Information Administration, whose updated
Short-Term Energy Outlook was due for release on April 7, projected in its
March report that Brent would remain above $95 over the next two months before
falling below $80 in Q3 and toward $70 by year-end. That forecast assumes the
Strait gradually reopens, a condition that has yet to materialize.
The futures curve tells its own story. As oil
traders increasingly turn to prediction markets for forward signals, the
Brent forward curve prices a decline to $90 by August and below $80 by
December, indicating the market’s base expectation remains that the disruption
is temporary.
|
Source |
Target |
Timeframe / Notes |
|
JPMorgan |
$150 Brent |
If Hormuz closed into mid-May |
|
Goldman Sachs (risk) |
$135 Brent |
Peak, 6 months of restricted supply |
|
Goldman Sachs (base) |
$85 avg / $71 Q4 Brent |
2026 average, assumes 6-week disruption |
|
EIA |
$95+ near-term, $70 year-end |
Assumes gradual Strait reopening |
|
Brent futures curve |
$90 Aug / sub-$80 Dec |
Market-implied, as of April 7 |
|
Goldman Sachs (pre-war) |
$53 WTI avg |
November 2025 forecast, now obsolete |
JPMorgan warns Brent crude could overshoot toward $150 per
barrel if the Strait of Hormuz remains effectively closed into mid-May. Goldman
Sachs has flagged an extreme peak scenario at $135 per barrel. WTI crude
settled at $112.41 on April 7, 2026, up roughly 96% year-to-date. The outcome
depends primarily on the duration and intensity of the Iran conflict.
The
US-Israeli war on Iran, which began February 28, 2026, effectively closed the
Strait of Hormuz, choking off approximately 20% of global seaborne oil supply. TD
Securities estimates nearly 1 billion barrels of crude and products will be
lost by end of April. This represents the largest supply disruption in the
history of the global crude market, according to Goldman Sachs.
The EIA projects Brent falling below $80 per barrel by Q3
and toward $70 by year-end, assuming the Strait of Hormuz gradually reopens.
Goldman Sachs’ Q4 2026 base case is $71 Brent and $67 WTI. A ceasefire deal
between the US and Iran would likely trigger a rapid decline in crude prices,
as the futures curve already prices Brent at $90 by August.
A full reopening of the Strait would remove the war premium
currently embedded in crude prices. Before the conflict, Goldman Sachs
projected WTI averaging $53 in 2026. However, analysts caution that even after
a ceasefire, infrastructure damage to Gulf production facilities means supply
normalization could take months, limiting the pace of any price decline.
Goldman Sachs’ base case projects $71 Brent and $67 WTI by
Q4 2026. Under a risk scenario where Hormuz disruptions last two months,
Goldman sees Q4 Brent at $93. JPMorgan’s pre-war outlook assumed Brent
returning to the $60 range. The EIA forecasts approximately $70 Brent by
December, contingent on resumed Strait flows and US production growth averaging
13.6 million barrels per day.
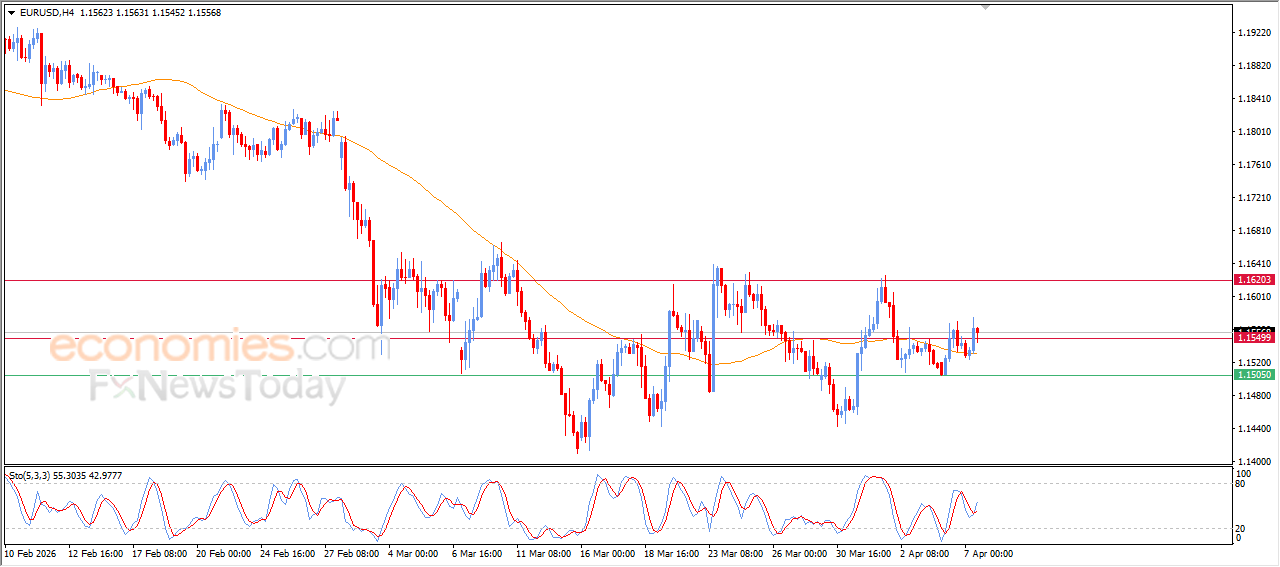
No news for EURJPY pair until this moment, affected by the positivity of the main indicators, which forces it to delay the bearish attack and keep forming bullish corrective waves, to settle near 184.30.
Reminding you that the negative scenario will remain valid, depending on the stability of the initial resistance at 184.80, which makes us wait for gathering negative momentum to motivate it to target the negative stations by reaching 183.10 followed by 182.20.
The expected trading range for today is between 183.30 and 184.55
Trend forecast: Fluctuating within the bearish track
Domestic coffee prices
In the domestic market, coffee prices this morning did not have new fluctuations compared to yesterday’s session and remained at the lowest level since mid-March.
The average purchase price of the entire Central Highlands region is currently standing at the threshold of 89,200 VND/kg.
In Dak Nong province (old), coffee prices continued to maintain the highest level in the region at 89,300 VND/kg.
Two other localities, Dak Lak and Gia Lai, both maintained stable trading levels at the 89.200 VND/kg mark.
In Lam Dong province alone, coffee prices are currently listed at the lowest level in the region at 88,700 VND/kg.
In general, the psychology of farmers and agents is still quite cautious as prices have fallen by more than 7,000 VND/kg compared to the peak period last month.
World coffee prices
Developments on futures exchanges last night recorded green in New York amid the UK market holiday.
New York Stock Exchange (Arabica): May 2026 futures increased by 2.65 cents (++0.90%), closing at 298.05 cents/lb. Arabica prices recovered mainly thanks to the Brazilian Real rising to a 3.5-week high. This reduced the competitiveness of Brazilian coffee when exported, thereby limiting supply pushed into the market and supporting futures prices.
London Stock Exchange (Robusta): Closed for trading break on Easter Monday. The most recent matched order price is still anchored at 3,448 USD/ton.
Market outlook
In terms of market assessment, although Arabica has a technical recovery momentum, long-term oversupply pressure is still the biggest barrier to current coffee prices. StoneX organization has just issued a shocking forecast when estimating that the global coffee surplus in 2026 will expand to 10 million bags, a sharp increase compared to the figure of 1.8 million bags in 2025. This is considered the largest surplus in the past 6 years. In addition, the “super crop” forecast of 75.9 million bags of Brazil from Marex Group continues to strengthen the pessimistic sentiment of investors in the medium term.
However, the market still receives some underground support from geopolitical and weather factors. The continued closure of the Strait of Hormuz due to the conflict in Iran is sharply increasing sea transportation, insurance and fuel costs for international roasters.
In addition, the rainfall report in the Minas Gerais region of Brazil last week only reached 47% of the historical average, this factor may directly affect the quality of coffee beans in the next crop year.
In Vietnam, although the export growth momentum in the first quarter was very strong with an increase of 14% to 585,000 tons, the ICE floor inventory of Robusta hitting a 3.5-month low is still an important support to help prices not fall deeply.
It is predicted that in the coming sessions, when the London exchange reopens after the holidays, domestic coffee prices are likely to continue to fluctuate and accumulate around the 88,500 – 90,000 VND/kg range.
The actual prices in localities may differ depending on the quality of the seeds and the transaction agreement.
No news for EURJPY pair until this moment, affected by the positivity of the main indicators, which forces it to delay the bearish attack and keep forming bullish corrective waves, to settle near 184.30.
Reminding you that the negative scenario will remain valid, depending on the stability of the initial resistance at 184.80, which makes us wait for gathering negative momentum to motivate it to target the negative stations by reaching 183.10 followed by 182.20.
The expected trading range for today is between 183.30 and 184.55
Trend forecast: Fluctuating within the bearish track
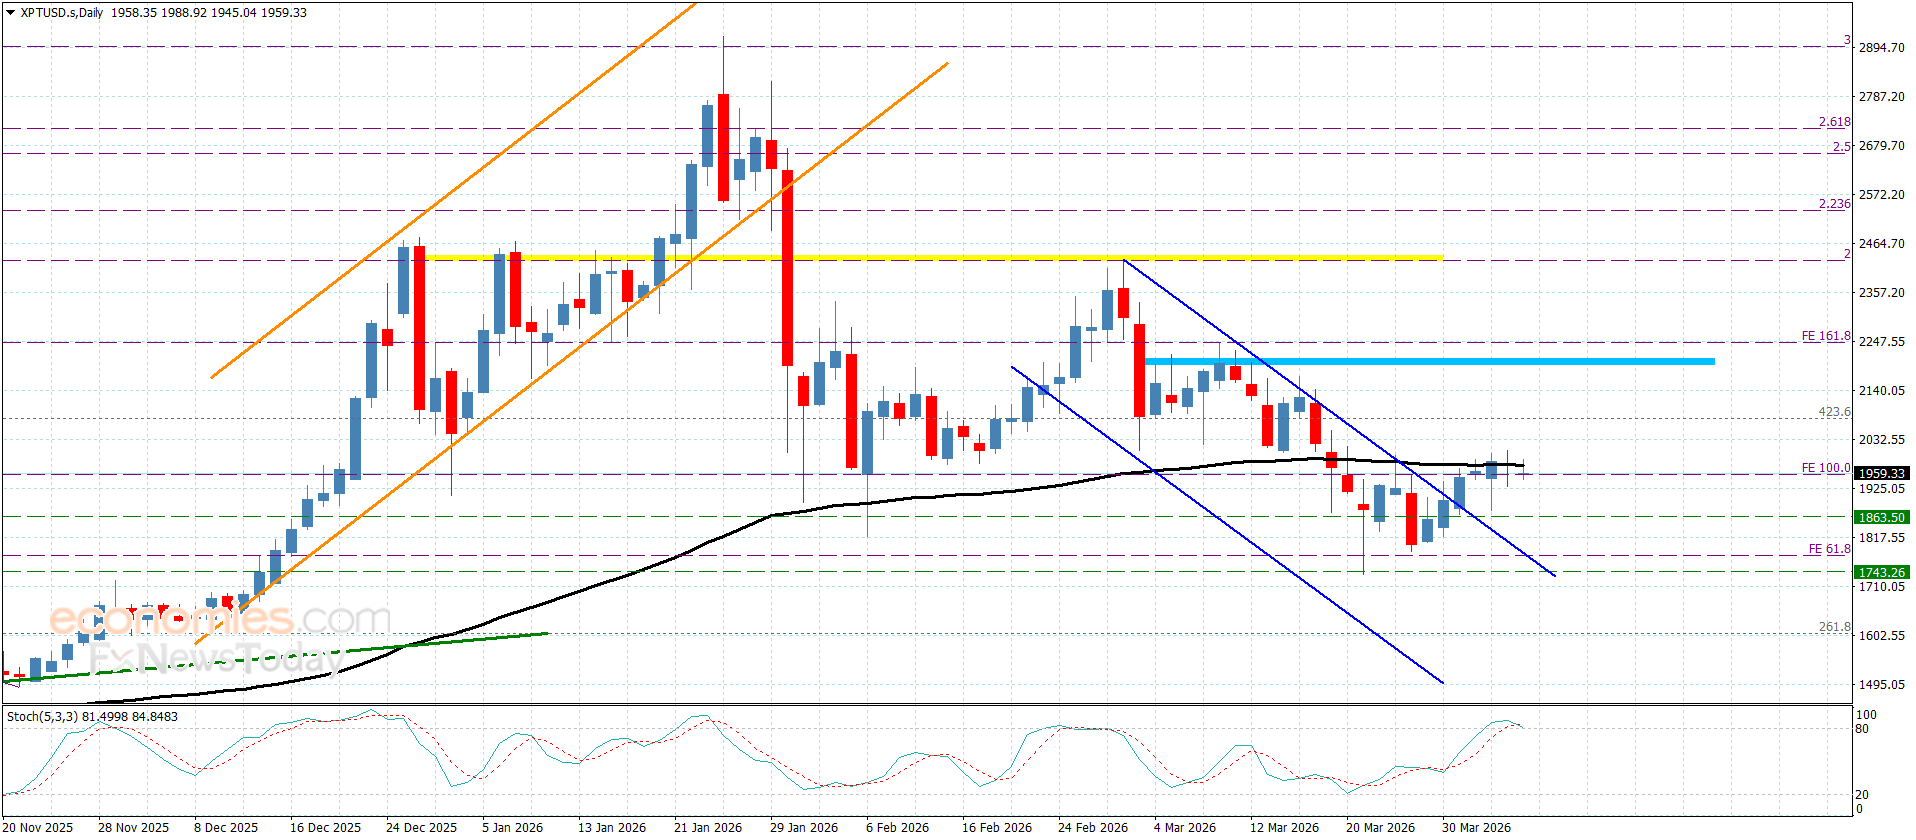
Platinum price attempted to form several bullish waves in the previous period, moving away from the support at $1860.00, providing strong pressures on the moving average 55, which keeps forming a key barrier at $1980.00.
The positive attempts get advantage of the stability above the previously mentioned support, which makes us wait for breaching the moving average 55 and holding above it to pave the way for achieving extra gains that might begin at $2070.00 and $2130.00, while breaking the support will push the price to provide new bearish trading, to reach $1170.00.
The expected trading range for today is between $1905.00 and $2070.00
Trend forecast: Bullish
Silver (XAG/USD) extends its sideways consolidative price move for the second straight day and holds steady around the $73.00 mark during the Asian session on Tuesday. Traders now seem reluctant to place aggressive directional bets and opt to move to the sidelines ahead of US President Donald Trump’s deadline for Iran to reopen the Straight of Hormuz amid fading hopes for a ceasefire.
From a technical perspective, the near-term bias is mildly bearish as the XAG/USD holds below the 100-period Simple Moving Average (SMA) on the 4-hour chart, while that average continues to trend lower and cap rebounds. Furthermore, the Moving Average Convergence Divergence (MACD) indicator (12, 26, 9) recovers from recent negative readings but remains subdued, hinting at fading downside momentum rather than a clear upside shift.
Adding to this, the Relative Strength Index (RSI) around 52 reinforces a neutral momentum backdrop, suggesting that sellers retain a slight advantage while directional conviction stays limited. Hence, any further strength beyond the 100-period SMA at $73.22 might confront resistance aligning with the 38.2% Fibonacci retracement of the March downfall, at $74.69. A sustained break above that band would open the door toward the 50.0% retracement at $78.89.
On the downside, initial support sits near $72.00, ahead of the 23.6% retracement at $69.50, which marks the first notable floor within the current corrective phase. A clear drop through $69.50 would expose the broader support area toward $61.11, where the measured advance began.
(The technical analysis of this story was written with the help of an AI tool.)
Silver is a precious metal highly traded among investors. It has been historically used as a store of value and a medium of exchange. Although less popular than Gold, traders may turn to Silver to diversify their investment portfolio, for its intrinsic value or as a potential hedge during high-inflation periods. Investors can buy physical Silver, in coins or in bars, or trade it through vehicles such as Exchange Traded Funds, which track its price on international markets.
Silver prices can move due to a wide range of factors. Geopolitical instability or fears of a deep recession can make Silver price escalate due to its safe-haven status, although to a lesser extent than Gold’s. As a yieldless asset, Silver tends to rise with lower interest rates. Its moves also depend on how the US Dollar (USD) behaves as the asset is priced in dollars (XAG/USD). A strong Dollar tends to keep the price of Silver at bay, whereas a weaker Dollar is likely to propel prices up. Other factors such as investment demand, mining supply – Silver is much more abundant than Gold – and recycling rates can also affect prices.
Silver is widely used in industry, particularly in sectors such as electronics or solar energy, as it has one of the highest electric conductivity of all metals – more than Copper and Gold. A surge in demand can increase prices, while a decline tends to lower them. Dynamics in the US, Chinese and Indian economies can also contribute to price swings: for the US and particularly China, their big industrial sectors use Silver in various processes; in India, consumers’ demand for the precious metal for jewellery also plays a key role in setting prices.
Silver prices tend to follow Gold’s moves. When Gold prices rise, Silver typically follows suit, as their status as safe-haven assets is similar. The Gold/Silver ratio, which shows the number of ounces of Silver needed to equal the value of one ounce of Gold, may help to determine the relative valuation between both metals. Some investors may consider a high ratio as an indicator that Silver is undervalued, or Gold is overvalued. On the contrary, a low ratio might suggest that Gold is undervalued relative to Silver.
The EURJPY pair continued forming mixed trading, due to the continuation of the main indicators’ contradiction, delaying the negative attack in the current trading by its rally towards 184.25 yesterday, to open this morning trading with new negativity, to notice targeting 183.60.
In general, the bearish scenario will remain valid depending on the stability below 184.80 resistance, forming an extra barrier at 184.20 level will support the chances of gathering the negative momentum, to ease the mission of targeting negative levels, which might begin at 183.10 and 182.20.
The expected trading range for today is between 182.20 and 184.20
Trend forecast: Bearish
Price movements in platinum are often sharper than gold or silver due to its limited availability and reliance on a few global mining regions. Automotive regulations, global production levels, and technology usage influence the platinum price today. As platinum becomes more relevant in clean energy applications, its daily rate has gained importance for both buyers and investors.
Domestic coffee prices
The domestic coffee market this morning, April 6th, did not record any new price fluctuations compared to the weekend holiday. Agents in the Central Highlands region are currently purchasing around an average of 89.2 million VND/kg.
Detailed purchase prices in key localities:
In Dak Nong province (old): Continue to maintain the highest price in the region at 89,300 VND/kg.
In Dak Lak province: The purchase price stands at 89. 200 VND/kg.
In Gia Lai province: Trading is stable at the 89. 200 VND/kg mark.
In Lam Dong province: Currently, the lowest price in the region is 88,700 VND/kg.
Looking back at the price history, the current level has dropped very deeply compared to the peak of 96,600 VND/kg set exactly one month ago (March 7).
World coffee prices
At the end of the most recent trading session, both London and New York exchanges closed in red due to pressure from a strong USD and positive crop reports from South America.
London Stock Exchange (Robusta): May 2026 delivery term closed at $3,448/ton. Although Robusta inventories on the ICE floor hit a 3.5-month low of 4,0093 lots, export pressure in the first 2 months of the year from Vietnam (up 14% to 360,000 tons) is still a major barrier curbing prices.
New York Stock Exchange (Arabica): May 2026 futures closed at 295.40 cents/lb. Arabica inventories monitored by ICE reached their highest level in more than 6 months (585.621 bags) continuing to put pressure on this exchange.
Market outlook
The coffee market is currently facing great supply pressure from Brazil as international organizations continuously raise their forecast for record production. Marex Group Plc estimates Brazil’s 2026/27 crop output to reach a record 75.9 million bags (up 15.5% y/y), while Sucafina and StoneX forecast at 75.4 million bags and 75.3 million bags respectively. However, supporting factors are still present as tensions in the Strait of Hormuz increased logistics costs and rainfall in Brazil last week only reached 47% of the historical average.
In the new trading week, domestic coffee prices are likely to continue to struggle and accumulate in the 88,500 – 90,000 VND/kg range. Farmers should closely monitor the diễn biến of the USD and the sea transport situation through the Strait of Hormuz to be more proactive in sales plans.
The actual price may differ depending on the quality of the seeds and the transaction agreement in each locality.
Select market data provided by ICE Data Services. Select reference data provided by FactSet. Copyright © 2026 FactSet Research Systems Inc.Copyright © 2026, American Bankers Association. CUSIP Database provided by FactSet Research Systems Inc. All rights reserved. SEC fillings and other documents provided by Quartr.© 2026 TradingView, Inc.