The main tag of Gold Today Price Articles.
You can use the search box below to find what you need.
[wd_asp id=1]
The main tag of Gold Today Price Articles.
You can use the search box below to find what you need.
[wd_asp id=1]
U.S. dollar is losing some ground against a broad basket of currencies in a volatile trading session. However, the American currency managed to rebound from session lows, supported by higher Treasury yields. As a result, dollar’s dynamics were neutral for gold markets today.
Gold failed to settle above the $4200 level and pulled back below the support at $4160 – $4180. In case gold stays below the $4160 level, it will head towards the next support, which is located in the $4000 – $4020 range.
On the upside, a move above the $4200 level will push gold towards the resistance level at $4300 – $4320.
The U.S. Dollar Index eased after the report, falling from a session high at 102.132 to near 101.74. It remains above the 50-day moving average at 99.94 after a sharp run higher. The dollar gave gold some room Friday. Control of the currency trade is another matter.
That’s why gold couldn’t hold the first spike. The metal got a weaker jobs report, lower October hike odds, a lower 10-Year yield and a softer dollar. It still couldn’t take out the 61.8% level.
The payrolls report pushed the October rate trade out of the way. Friday’s bounce is running on short-end relief. Gold still needs the long end of the bond market to follow it lower. The 10-Year and the dollar backed off Friday without breaking anything on their charts.
The bias is to the downside with the main trend down on the swing chart. The jobs report gave gold a chance to repair the break and it stalled before the 61.8% level at $4,230.51. Spot Gold is still trading under the 50% level at $4,319.61 and the 50-day moving average at $4,327.50. This week’s low at $4,110.87 is the level underneath.
If you’d like to know more about how to Spot Gold, please visit our educational area.
The natural gas market has fallen pretty significantly during the course of the week, but we still remain somewhat in the same range we’ve been in for a while. Ultimately, this is a market that has been very attracted to the $3 level, and it’s probably worth noting that $3, being a large, round, psychologically significant figure, does make a certain amount of sense. This is also a market that might get a lot of momentum based on the idea that the Europeans may be running a little short on energy
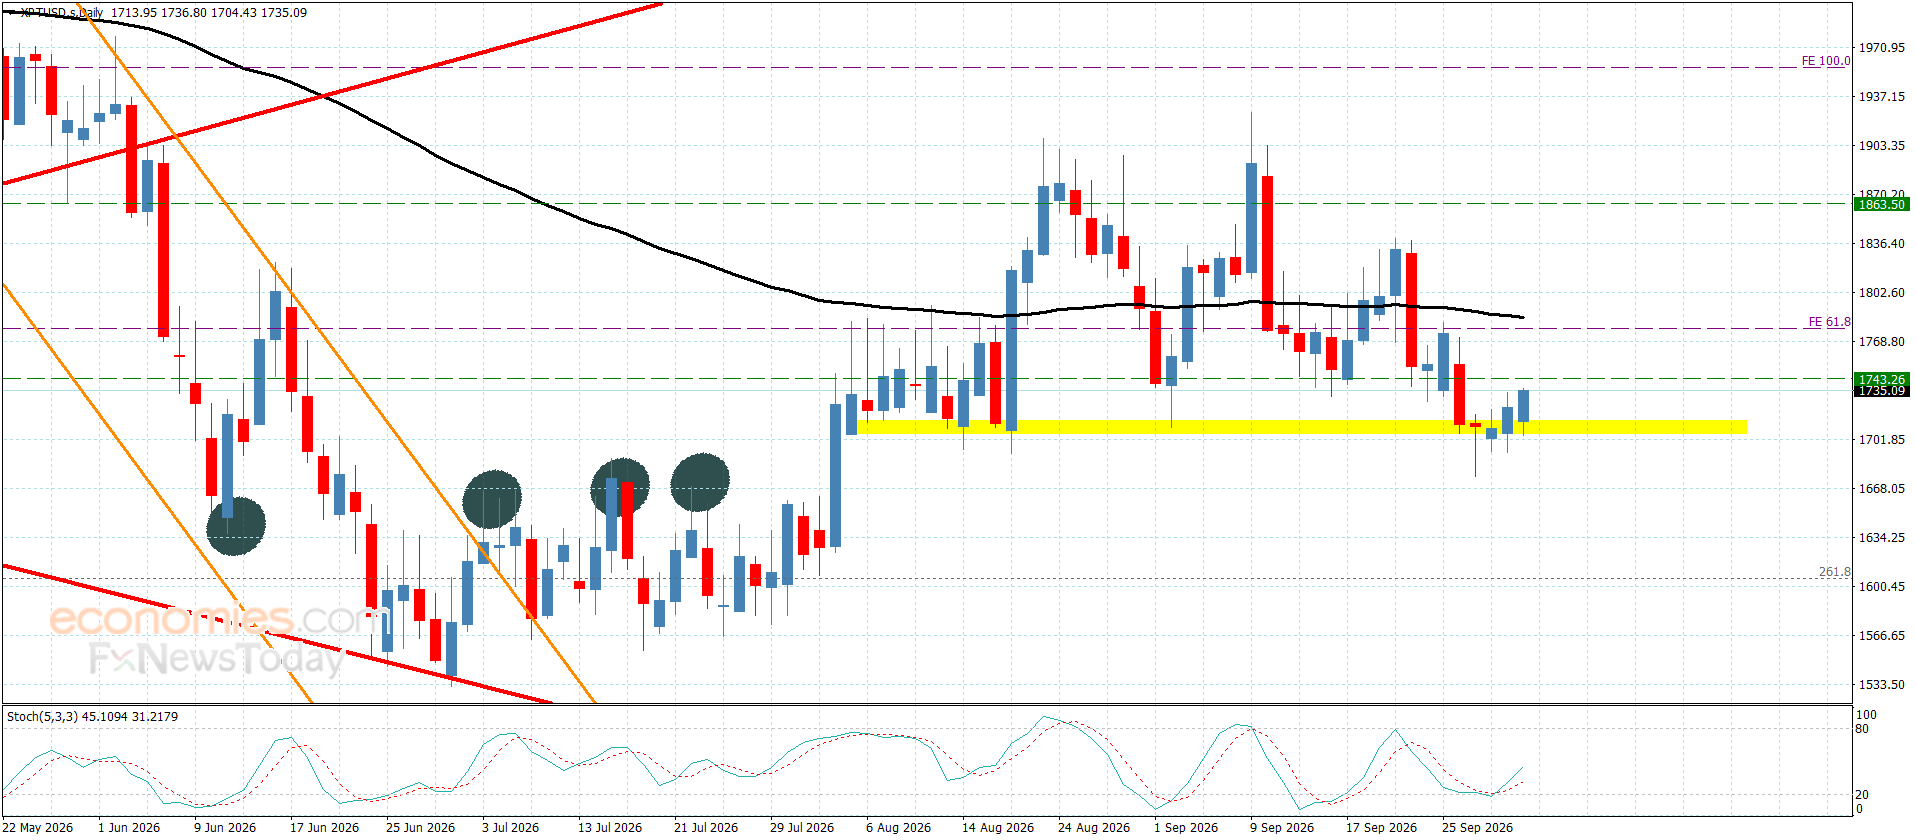
Platinum price faces negative pressures by providing a positive close above $1705.00 level, to begin forming some gains by its stability near $1735.00. The stability of the trading above $1705.00 is important to increase the chances of attacking the barrier near $1840.00, where surpassing it will confirm its readiness to form a strong bullish trend to target 1880.00 level.
While the return of the fluctuation below $1705.00 will force it to resume the bearish corrective attempts, which forced it to suffer new losses by reaching $1660.00 and $1605.00.
The expected trading range for today is between $1700.00 and $1840.00
Trend forecast: Bullish
According to the latest IndexBox report on the global Coffee Creamer market, the market enters 2026 with broader demand fundamentals, more disciplined procurement behavior, and a more regionally diversified supply architecture.
The global coffee creamer market is undergoing a structural transformation as it moves toward 2035, shifting from a commoditized, volume-led category to one where value growth is increasingly driven by premiumization, plant-based innovation, and functional benefits. Historically anchored in powdered and liquid dairy formats sold through mainstream retail, the category now faces a widening bifurcation: a price-sensitive core under pressure from private label, and a fast-growing premium frontier where claims around health, clean-label ingredients, and barista-grade performance command higher margins.
This report provides a strategic analysis of the market from 2026 to 2035, examining demand drivers, segment dynamics, competitive intensity, and regional outlooks. It covers key trends such as the mainstreaming of dairy-free and lactose-free options, the rise of e-commerce and direct-to-consumer channels, and the evolving role of foodservice and office coffee service. The analysis is designed for brand owners, category managers, investors, and market entrants seeking a clear read on where growth sits, which brands control the category, and how pricing, promotion, and route-to-market shape commercial success. The forecast horizon extends to 2035, with historical context from 2012 to 2025.
The baseline scenario for the global coffee creamer market through 2035 anticipates moderate but steady value growth, with a compound annual growth rate (CAGR) of 4.2% from 2026 to 2035, and the market index reaching 152 by 2035 (2025=100). This outlook assumes continued premiumization in developed markets, gradual recovery in emerging economies, and sustained innovation in plant-based and functional creamers. Volume growth will be slower, particularly in North America and Western Europe, where per-capita consumption is mature and private label penetration is high.
However, value growth will be supported by consumers trading up to premium liquid creamers, barista-style products, and fortified options. In Asia-Pacific, rising coffee culture and urbanization will drive both volume and value, though local taste preferences and price sensitivity will shape product formats. The market will face headwinds from commodity price volatility, regulatory pressures on sugar and fat content, and intense competition from private label. Nevertheless, opportunities abound in clean-label, low-sugar, and high-protein creamers, as well as in e-commerce and foodservice channels.
The baseline scenario does not assume major disruptive events but recognizes that supply chain disruptions or economic downturns could alter the trajectory. Overall, the market is expected to remain resilient, with premiumization and plant-based innovation as the primary engines of value creation.
Supermarkets and hypermarkets remain the dominant channel for coffee creamer sales, accounting for the largest share of volume and value. In this segment, demand is driven by routine household purchases, with shoppers typically buying creamer as part of their regular grocery basket. The shelf space is increasingly divided between private label and branded products, with private label gaining ground in the value tier. However, premium and plant-based creamers are driving value growth, as consumers seek healthier and more sophisticated options. Retailers are responding by expanding their assortments of dairy-free and functional creamers, often placing them in dedicated health or natural sections.
Promotional activity is intense, particularly in the mainstream tier, where brands use price discounts and multi-buy offers to defend share. Looking ahead to 2035, the retail channel will remain critical, but its growth will be value-driven rather than volume-driven. The key demand-side indicators to watch include private-label penetration rates, the share of premium SKUs, and the velocity of plant-based products. Retailers’ ability to curate assortments that cater to diverse need states—from everyday value to indulgent premium—will determine their success. Current trend: Stable but shifting toward premium and plant-based.
Major trends: Expansion of plant-based and dairy-free creamer sets, Growth of private label in the value tier, Increased shelf space for functional and clean-label creamers, Promotional intensity in the mainstream tier, and Rise of multi-pack and single-serve formats.
Representative participants: Nestlé S.A, Danone S.A, FrieslandCampina, Lactalis Group, and Califia Farms.
The foodservice and office coffee service (OCS) segment is a vital channel for coffee creamer, encompassing restaurants, cafes, hotels, and workplace coffee stations. Demand here is driven by out-of-home coffee consumption, which has rebounded post-pandemic and continues to grow. In foodservice, creamer is often provided in single-serve pods, bulk liquid, or powdered formats, with operators seeking cost-effective yet quality solutions. The segment is witnessing a shift toward premium and plant-based creamers as consumers expect the same quality in cafes as they do at home. OCS providers are increasingly offering dairy-free and flavored creamers to cater to diverse workplace preferences.
The segment’s growth is tied to the overall health of the foodservice industry, which is expected to expand steadily through 2035, particularly in emerging markets. Key demand indicators include the number of coffee-serving establishments, office occupancy rates, and the adoption of premium creamer options in foodservice. Operators that can balance cost and quality while offering variety will capture share. However, this segment is also sensitive to economic cycles, as discretionary spending on out-of-home coffee can decline during downturns. Current trend: Recovering and innovating with premium options.
Major trends: Recovery of foodservice traffic post-pandemic, Adoption of plant-based creamers in cafes and restaurants, Growth of single-serve and portion-control formats, Premiumization in office coffee service, and Sustainability initiatives driving packaging changes.
Representative participants: Nestlé S.A, Danone S.A, Kerry Group, Cargill, Incorporated, and Arla Foods.
E-commerce and direct-to-consumer (DTC) channels are the fastest-growing route to market for coffee creamer, albeit from a smaller base. This segment is driven by convenience, discovery, and the ability to access niche products not available in local stores. Online shoppers for creamer tend to be younger, more health-conscious, and willing to pay a premium for specialty items such as barista-grade, organic, or functional creamers. Subscription models are gaining traction, particularly for liquid creamers that require regular replenishment. The segment’s growth is supported by the expansion of e-grocery platforms, improved cold-chain logistics, and social media marketing.
However, profitability is challenged by high customer acquisition costs and the logistics of shipping liquid products. Looking to 2035, e-commerce is expected to increase its share of the market, especially in urban areas where delivery infrastructure is robust. Key demand indicators include online grocery penetration, subscription retention rates, and the share of premium SKUs sold online. Brands that invest in digital marketing and seamless fulfillment will be well-positioned to capture this growth. Current trend: Fast-growing, especially for premium and niche products.
Major trends: Rise of subscription-based creamer delivery, Growth of direct-to-consumer brands, Increased online grocery penetration, Social media influence on purchase decisions, and Innovation in packaging for e-commerce shipping.
Representative participants: Califia Farms, Oatly Group AB, Elmhurst 1925, Nestlé S.A, and Danone S.A.
Convenience stores and gas stations represent a significant channel for coffee creamer, primarily through the sale of single-serve creamers and ready-to-drink coffee beverages. This segment caters to consumers seeking immediate consumption and convenience, often during commutes or travel. Demand is driven by the frequency of coffee purchases at these locations, which remains robust despite competition from drive-thru coffee chains. The creamer offerings in convenience stores are typically limited to mainstream brands and private label, with a focus on shelf-stable liquid and powdered formats. However, there is a growing opportunity for premium and plant-based single-serve creamers as consumers seek healthier options on the go.
The segment’s growth will be influenced by trends in mobility, fuel prices, and the expansion of convenience store foodservice. Key demand indicators include foot traffic, coffee attachment rates, and the share of premium creamers in the mix. To succeed, brands must ensure availability and visibility in these high-traffic locations, often through partnerships with convenience store chains. Current trend: Steady, with focus on single-serve and on-the-go.
Major trends: Growth of single-serve liquid creamers, Expansion of fresh coffee programs in convenience stores, Demand for dairy-free options on the go, Promotional bundling with coffee purchases, and Sustainability concerns driving packaging innovation.
Representative participants: Nestlé S.A, Danone S.A, FrieslandCampina, Lactalis Group, and Dean Foods (Dairy Farmers of America).
The ‘other channels’ segment encompasses vending machines, travel (airlines, trains), and institutional settings such as hospitals, schools, and corporate cafeterias. While smaller in share, this segment is important for brand visibility and trial. Demand is driven by the need for convenient, shelf-stable creamer options that can be easily dispensed. In vending, powdered creamers dominate due to their long shelf life and low cost, but there is a gradual shift toward liquid and plant-based options as vending operators upgrade their offerings. In travel and institutional settings, creamer is often provided as part of a beverage service, with a focus on cost and reliability.
The segment’s growth will be modest, tied to the recovery of travel and institutional foodservice. Key demand indicators include vending machine placements, airline passenger volumes, and institutional meal counts. Opportunities exist for brands that can offer sustainable, single-serve packaging and cater to dietary restrictions. However, this segment is highly price-sensitive and often subject to contract negotiations, limiting premiumization potential. Current trend: Niche but stable, with potential in travel and institutional.
Major trends: Upgrade of vending machines to offer premium creamers, Recovery of travel and institutional foodservice, Demand for sustainable packaging in travel, Growth of plant-based options in institutions, and Consolidation of vending operators.
Representative participants: Nestlé S.A, Danone S.A, Cargill, Incorporated, Kerry Group, and Arla Foods.
Interactive table based on the Store Companies dataset for this report.
| # | Company | Headquarters | Focus | Scale | Note |
|---|---|---|---|---|---|
| 1 | Nestlé | Vevey, Switzerland | Coffee-Mate brand | Global leader | Pioneered non-dairy creamer |
| 2 | Danone | Paris, France | International Dairy brand | Global | Major dairy-based creamer player |
| 3 | The WhiteWave Foods Company (Danone) | Denver, Colorado, USA | Silk, International Delight brands | Global | Plant-based & flavored creamers |
| 4 | Lactalis | Laval, France | President, Parmalat brands | Global | Major dairy group with creamer products |
| 5 | Saputo Inc. | Montreal, Canada | Dairy-based creamers | Global | Major dairy processor with creamer lines |
| 6 | Dean Foods | Dallas, Texas, USA | Dairy Pure, private label | National (US) | Was major US dairy fluid processor |
| 7 | Chobani | Norwich, New York, USA | Plant-based & dairy creamers | Major (US) | Growing plant-based creamer segment |
| 8 | Califia Farms | Los Angeles, California, USA | Plant-based creamers | Significant (US) | Leading almond/oat milk creamer brand |
| 9 | HP Hood LLC | Lynnfield, Massachusetts, USA | Dairy & plant-based creamers | Major (US) | Owns Planet Oat creamers |
| 10 | Kerry Group | Tralee, Ireland | Ingredients & private label | Global | Major B2B ingredient supplier |
| 11 | FrieslandCampina | Amersfoort, Netherlands | Dairy ingredients & brands | Global | Supplier of dairy-based creamer ingredients |
| 12 | Super Group Ltd | Singapore | Non-dairy creamer manufacturer | Asia-Pacific | Major OEM/private label manufacturer |
| 13 | Ripple Foods | San Francisco, California, USA | Pea protein-based creamers | Growing (US) | Plant-based, protein-focused |
| 14 | Dunkin’ Brands (Inspire Brands) | Canton, Massachusetts, USA | Branded retail creamers | Major (US) | Licensed brand for retail creamers |
| 15 | Starbucks Corporation | Seattle, Washington, USA | Branded retail creamers | Global | Licensed brand (typically by Nestlé) |
| 16 | Private Label (Various) | Unknown | Store-brand creamers | Global | Collective major market share |
| 17 | So Delicious Dairy Free (Danone) | Eugene, Oregon, USA | Plant-based creamers | Significant (US) | Coconut milk & oat creamers |
| 18 | Natra | Barcelona, Spain | Cocoa & creamer ingredients | Global | Major B2B cocoa/creamer blends supplier |
| 19 | Laird Superfood | Sisters, Oregon, USA | Plant-based creamer powders | Niche (US) | Functional, coconut milk-based powders |
| 20 | Cargill | Wayzata, Minnesota, USA | Ingredients & oils | Global | Supplier of oils/fats for creamers |
| 21 | Rich Products Corporation | Buffalo, New York, USA | Foodservice & retail | Global | Major in foodservice creamers |
| 22 | Grocery Manufacturers (Thailand) | Bangkok, Thailand | Non-dairy creamer OEM | Asia | Major private label manufacturer |
| 23 | Alpro (Danone) | Ghent, Belgium | Plant-based creamers | Europe | Leading plant-based brand in Europe |
| 24 | Oatly Group AB | Malmö, Sweden | Oat-based creamers | Global | Specialist oat milk creamer brand |
| 25 | Elmhurst 1925 | Elmaford, New York, USA | Plant-based creamers | Niche (US) | Milked nuts, oat creamers |
Asia-Pacific is the largest and fastest-growing region for coffee creamer, driven by rising coffee consumption, urbanization, and expanding middle class. Local taste preferences favor powdered and flavored creamers, but demand for premium and plant-based options is emerging in urban centers. Key markets include China, Japan, and Southeast Asia. Direction: Growing.
North America is a mature but high-value market, with growth driven by premiumization and plant-based creamers. Private label penetration is high, pressuring branded players. The U.S. and Canada are key markets, with a strong coffee culture and demand for functional and clean-label products. Direction: Stable with value growth.
Europe is a mature market with a strong coffee culture, particularly in Western Europe. Demand is shifting toward plant-based and organic creamers, with private label dominant in the value tier. Eastern Europe offers growth potential as coffee consumption rises. Key markets include Germany, the UK, and France. Direction: Moderate growth.
Latin America is a growing market for coffee creamer, driven by increasing coffee consumption and urbanization. Brazil and Mexico are key markets, with a preference for powdered creamers. However, economic volatility and price sensitivity limit premiumization. Plant-based options are nascent but gaining interest. Direction: Growing.
The Middle East & Africa region is an emerging market for coffee creamer, with growth driven by coffee culture and population growth. The UAE and Saudi Arabia are key markets, with a preference for premium and flavored creamers. However, distribution challenges and economic disparities limit widespread adoption. Direction: Emerging.
In the baseline scenario, IndexBox estimates a 4.2% compound annual growth rate for the global coffee creamer market over 2026-2035, bringing the market index to roughly 152 by 2035 (2025=100).
Note: indexed curves are used to compare medium-term scenario trajectories when full absolute volumes are not publicly disclosed.
For full methodological details and benchmark tables, see the latest IndexBox Coffee Creamer market report.
Platinum price updates for Mumbai show the current rates as ₹52,790 (10g),
₹5,27,900 (100g), and ₹52,79,000 (1kg). Over October, prices changed
frequently. The 100g rate peaked at ₹5,27,900 and dropped to
₹5,27,900. For 1kg, it fluctuated between
₹52,79,000 and ₹52,79,000.
The cost of platinum is influenced by mining output, global market demand, and
geopolitical stability. Industrial reliance—mainly in cars and electronics—drives
additional volatility. Shifts in currency, especially the US dollar, as well as
macroeconomic indicators like inflation and interest rate policies, strongly shape its
pricing.
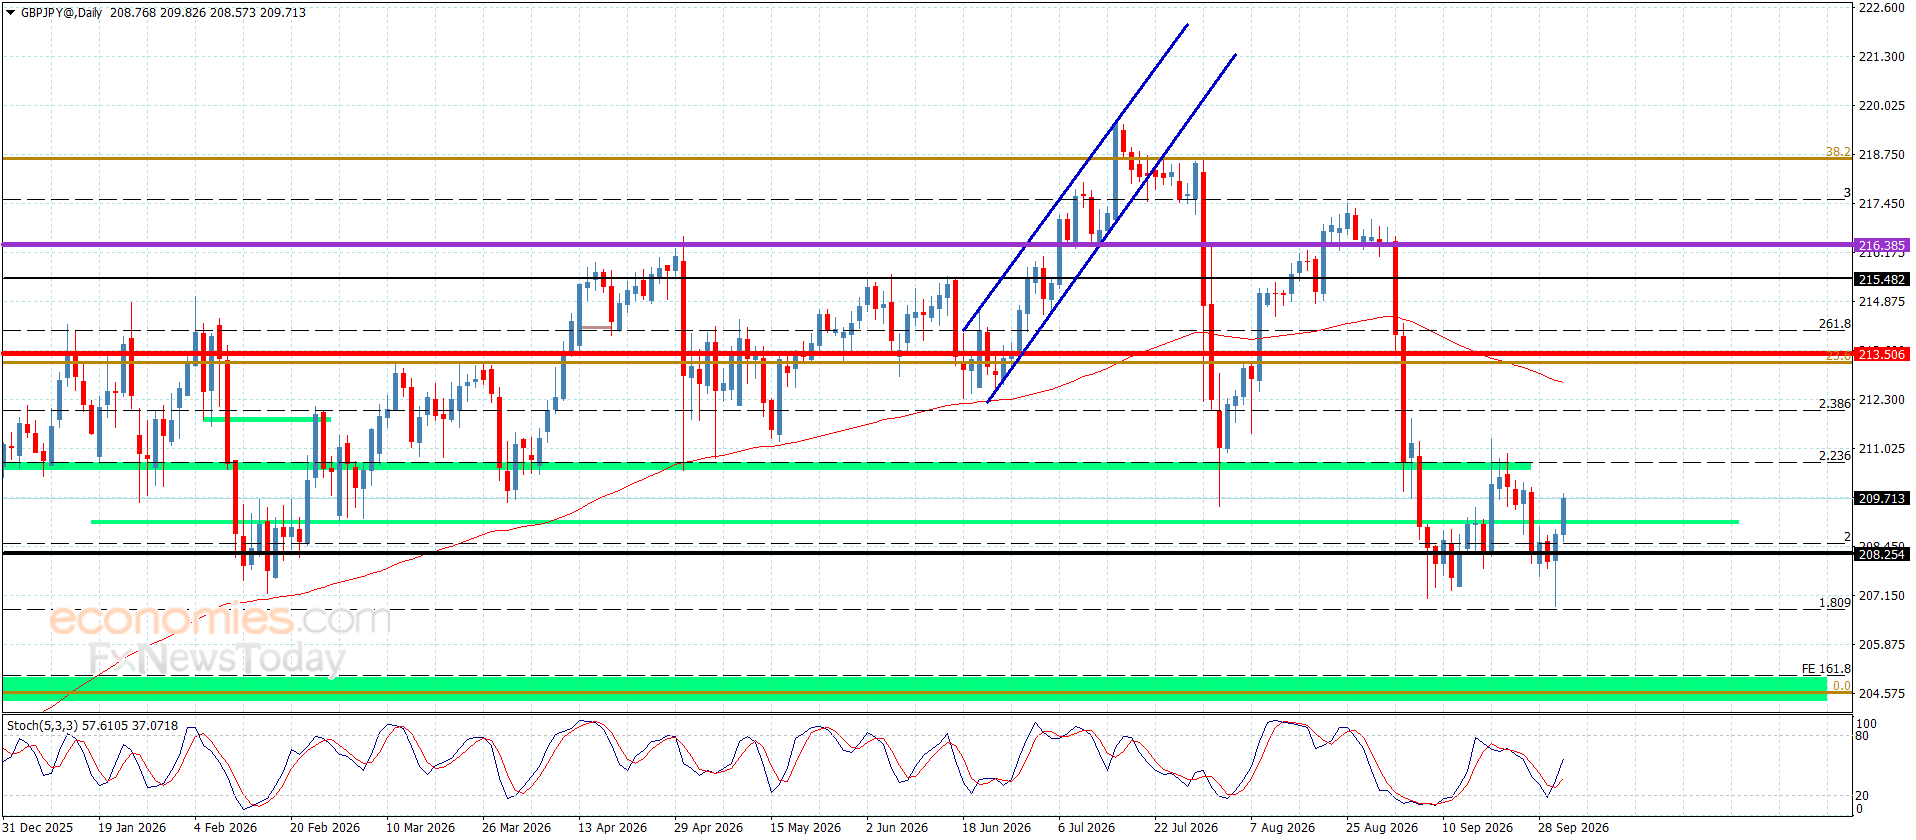
The pair’s price touched 206.85 during its latest bearish move before reacting to the positive signals from the Stochastic indicator, recovering some of its losses by surging back above 208.10 and recording further gains toward 209.70.
We expect the price to experience some instability at present, as the main indicators remain in conflict, while the price continues to trade below the barrier near 210.45. A return to sustained trading below 208.10 would increase the chances of forming bearish waves, potentially bringing renewed pressure on the barrier at 206.80.
The expected trading range for today is between 208.10 and 210.00.
Trend forecast: Volatile within the bearish path.
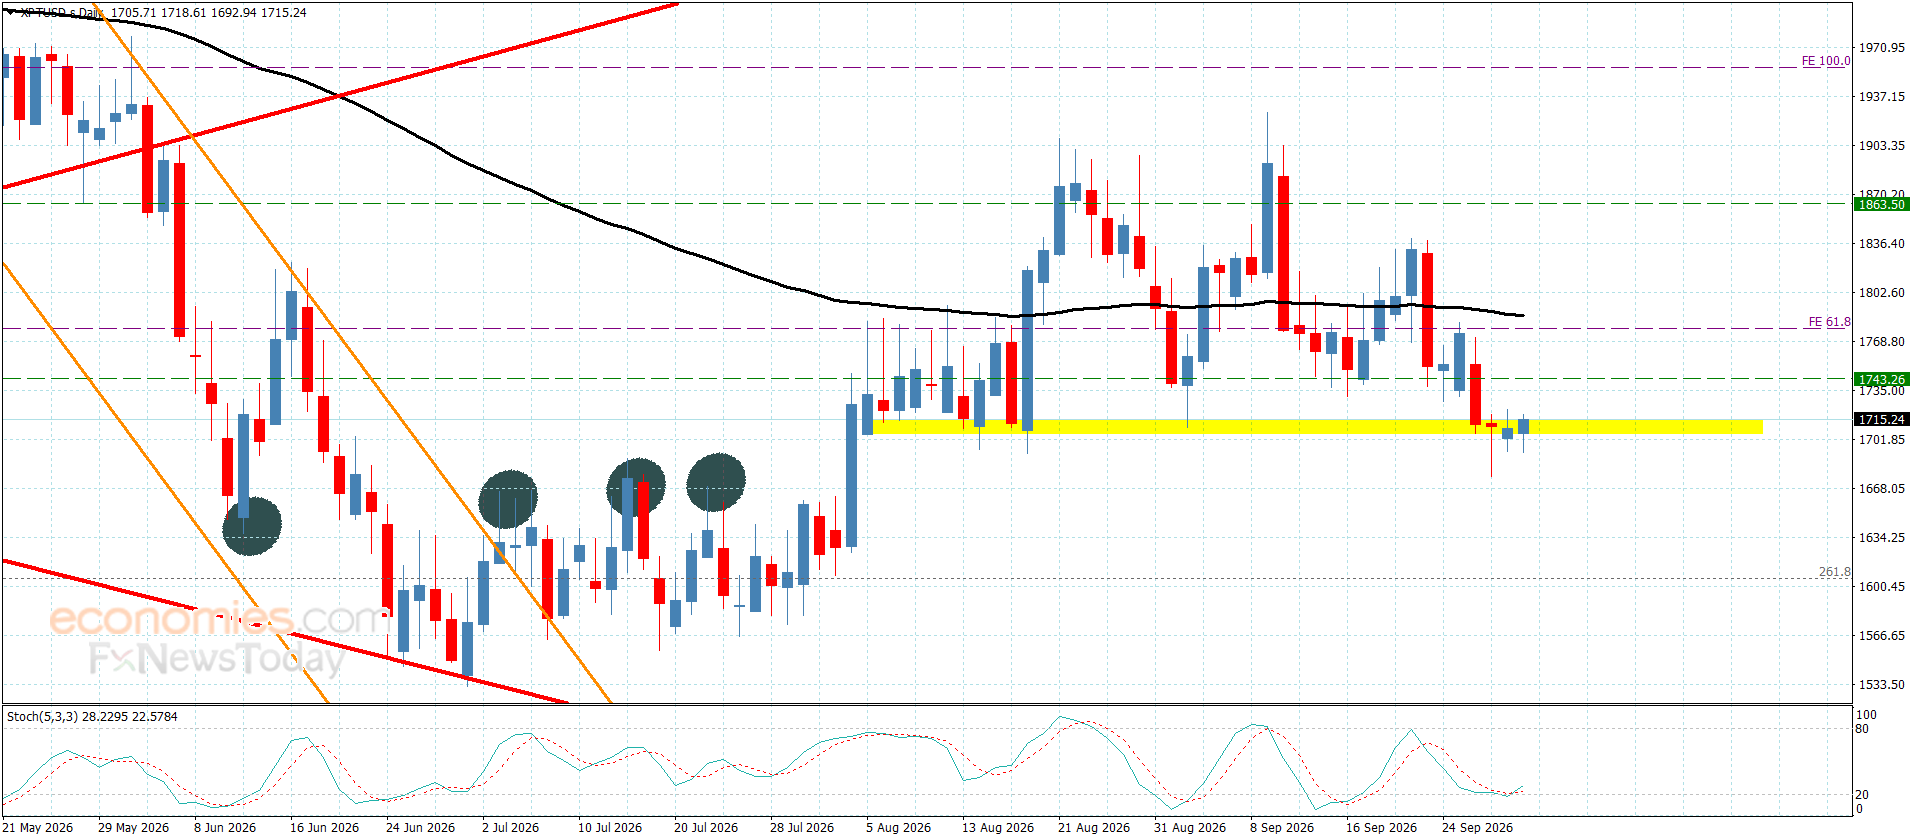
Platinum price shown little change since yesterday’s trading session, continuing to fluctuate near the support level at $1,705.00, weighed down by negative pressure reflected in the main indicators maintaining negative momentum, in addition to repeated stability below the barrier at $1,840.00.
Accordingly, we will maintain our bearish outlook for the near-term trading, awaiting confirmation of a break below the current support, after which the price could begin targeting the next bearish levels, initially moving toward $1660.00 and $1605.00.
The expected trading range for today is between $1660.00 and $1750.00.
Trend forecast: Bearish
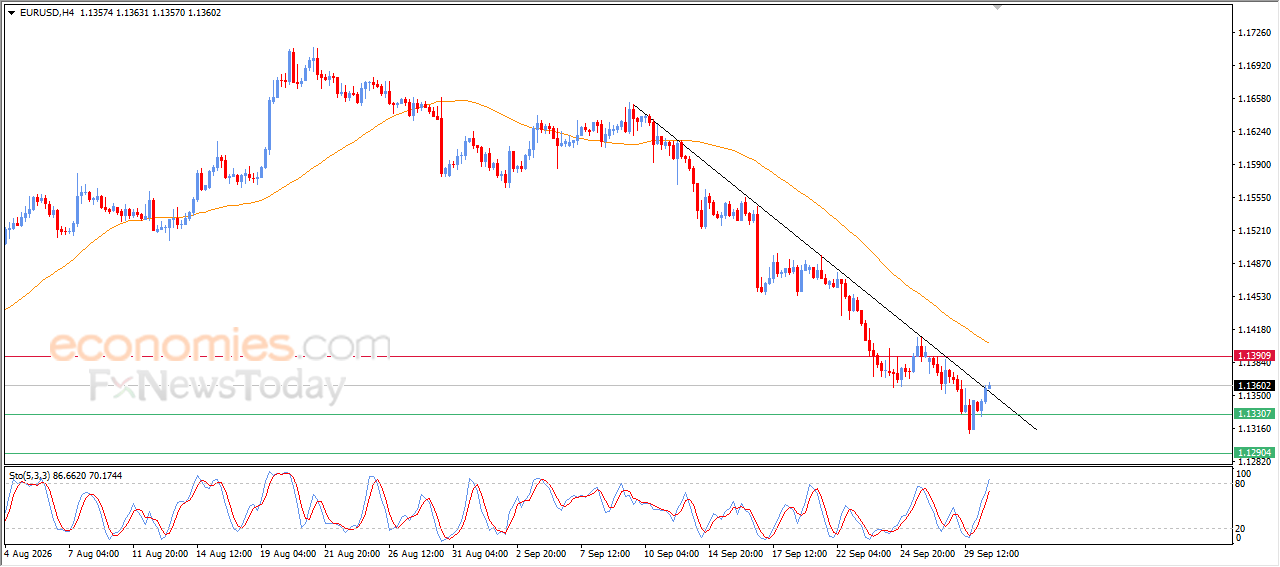
The EURUSD price extended its gains during recent intraday trading, driven by positive signals from the relative strength indicators, as the pair attempts to recover some of its previous losses. However, these indicators have reached extremely overbought levels relative to the pair’s price action, signaling that the positive momentum surrounding the pair is fading. This comes as the main bearish trend remains dominant in the short term, with the price moving along a minor trend line supporting this path. In addition, continued negative pressure is evident as the pair trades below EMA50, reducing the chances of a full recovery in the near term.
Thursday’s Energy Information Administration storage report is expected to show a 55 to 65 Bcf injection for the week ended September 25. The last report had a 53 Bcf build, putting working gas at 3,351 Bcf. That left inventories 2.9% above the five-year seasonal average.
Short-covering off a light number is about the best buyers can hope for Thursday. The supply cushion doesn’t go anywhere. The EIA sees end-of-October inventories near 3,985 Bcf, the highest level in a decade and 5% above the five-year average.
Thursday’s storage report is the next thing on the calendar. The weather models are going to matter more. Buyers need a colder forecast or another Appalachian supply problem to get back in, and right now they don’t have either one. Sellers are working with low demand and plenty of gas in storage.
The main trend is down on the daily swing chart, with the bias leaning bearish. Buyers came in under $3.00 and pushed the contract through the 50-day moving average at $3.039 during the session. They couldn’t hold it. At 17:10 GMT, November natural gas was back under it and well short of the broken retracement zone. $3.087 is the level buyers have to take back.
More Information in our Economic Calendar.