The main tag of Gold Today Price Articles.
You can use the search box below to find what you need.
[wd_asp id=1]
The main tag of Gold Today Price Articles.
You can use the search box below to find what you need.
[wd_asp id=1]
Updated: December 22, 2025 — 10:23
Natural gas markets are starting the holiday-shortened week with a familiar tug-of-war: weather forecasts that lean warmer (near term) and sturdy supply are keeping prices contained, while LNG logistics, storage trends, and geopolitics continue to inject volatility into regional benchmarks.
Across the major hubs on Dec. 22, Europe’s TTF has edged lower in thin trade, Asia’s spot LNG is sitting near a 20‑month low, and the U.S. market is again revolving around the “big three” drivers—production, demand forecasts, and LNG feedgas flows. [1]
In early Monday trading, Dutch and British wholesale gas prices dipped as ample Norwegian supply and LNG availability counterbalanced expectations for colder weather later across parts of the continent. The Dutch front‑month TTF contract was reported lower around €27.95/MWh (about $9.61/mmBtu) in the morning, with markets quiet ahead of Christmas. [2]
A broader price reference also shows TTF around the high‑€27s on the day—consistent with the idea that Europe is entering late December with prices restrained, not tight, even as winter risk remains. [3]
In Asia, spot LNG continues to feel heavy. Industry pricing cited for February delivery into Northeast Asia put the JKM region around $9.50/mmBtu, down from $10/mmBtu the week prior—marking the lowest level since April 2024. Analysts attribute the softness to muted heating demand, ample Pacific supply, and pipeline gas availability (notably supporting China’s balance), keeping spot buying cautious and price-sensitive. [4]
A key detail for traders: multiple assessments highlighted Europe’s LNG pricing versus TTF and pointed to ongoing competition for cargoes as winter deepens—even though Asia is currently the “softer” side of the global LNG equation. [5]
In the U.S., market commentary today is dominated by near‑record production, milder weather expectations into early January, and strong feedgas demand from LNG export terminals. One widely circulated market summary (citing LSEG and storage data) describes U.S. Lower‑48 output around 109.6 bcfd and forecasts demand (including exports) falling from roughly 144.6 bcfd this week to about 127.5 bcfd over the next two weeks as warmth trims heating needs. [6]
At the same time, LNG remains a stabilizer: feedgas flows to major U.S. LNG terminals have been cited around 18.5 bcfd this month—above November’s record in that same commentary—helping cushion bearish weather shifts. [7]
The near-term setup remains broadly milder than normal, reducing the call on gas for space heating in the U.S. and easing immediate price pressure. [8]
In Europe, traders are balancing that same “now vs. later” weather dynamic: current fundamentals read bearish, but the market remains alert to risk factors that could flip sentiment quickly—especially if cold snaps arrive while storage is already lower than recent years. [9]
Europe’s storage is a centerpiece today: the latest figure cited puts EU gas storage at about 67.24% full—a level that’s not alarming on its own, but lower than recent years entering the heart of winter, raising the chance Europe must compete harder for LNG cargoes in January and February if temperatures turn colder. [10]
In the U.S., storage data referenced in today’s market write-up showed utilities withdrew 167 bcf for the week ended Dec. 12, leaving inventories around 3,579 bcf—described as slightly above the five‑year average (but below year‑ago levels). [11]
One of the most consequential natural gas policy headlines today is out of Australia: the government confirmed a plan that will require east‑coast LNG exporters to reserve a minimum share of gas for domestic use, with a proposed range of 15% to 25%, starting in 2027 (and applying to new contracts). [12]
The move is designed to reduce the risk of price spikes and help address a forecast supply gap on the east coast—an unusual dynamic for a country that is also one of the world’s largest LNG exporters. Reactions are mixed: manufacturers tend to welcome the prospect of more domestic supply, while exporters warn about investment signals and market intervention. [13]
Why it matters globally: Australia is a top-tier LNG supplier into Asia, so any rule that changes how much gas can be exported (even at the margin) is something LNG traders will model into forward balances—especially if winter demand or shipping constraints tighten. [14]
Reuters reporting today says Russia’s pipeline gas exports to China via Power of Siberia are expected up about 25% in 2025, reaching roughly 38.6–38.7 bcm, slightly above the pipeline’s planned annual capacity. [15]
But the same reporting underscores a central structural reality: greater flows to China do not fully replace the value (and scale) of the lost European market, and pricing remains a major hurdle for future Russian pipeline ambitions such as Power of Siberia 2. [16]
This matters for gas pricing because pipeline flows shape LNG demand indirectly: the more China can secure through pipeline gas at acceptable prices, the more selective it can be in spot LNG markets—one reason Asia’s spot buying has stayed cautious even as winter approaches. [17]
Another major headline today: a tanker named Kunpeng loaded LNG from Russia’s Portovaya LNG terminal, which is under Western sanctions, based on ship-tracking data cited by Reuters (Kpler and LSEG). The vessel reportedly arrived Dec. 18 and departed with cargo on Dec. 21—described as the first time this tanker has lifted LNG from a designated project. [18]
Market significance: even relatively small sanctioned volumes can matter at the margin in winter—especially in Europe, where LNG is now a core balancing mechanism. The broader issue is whether enforcement tightens, stays stable, or weakens in practice via transfers and “creative” routing. [19]
On the corporate side, the U.S. LNG growth story is facing a reality check. Reuters reports that Energy Transfer has suspended development of its Lake Charles LNG export project in Louisiana, citing cost pressures, market conditions, and a preference to focus on pipeline projects. The planned project capacity was reported around 16.45 million tonnes per annum. [20]
The company’s own announcement echoed that strategic pivot—suspending development to prioritize a backlog of pipeline investments, while remaining open to discussions with third parties. [21]
Why it matters today: LNG markets price long-term capacity expectations years ahead. Any meaningful delay, cancellation, or de‑risking of U.S. export growth can tighten future balances—especially if demand surprises higher (AI-driven power demand, industrial recovery, or faster coal-to-gas switching). [22]
Europe’s setup is straightforward but unstable: prices are currently subdued by supply, yet storage is lower than recent winters and the market is explicitly watching whether colder weather in early 2026 forces incremental LNG procurement. [23]
In the U.S., the next big directional catalyst remains weather model shifts. The current posture—warmer near-term, lower demand projections—keeps the market sensitive to any change that turns the outlook colder, because production is high but LNG demand has also been running strong. [24]
One notable forward view comes from Goldman Sachs (reported by Reuters): the bank forecasts European TTF averaging roughly €29/MWh in 2026 and €20/MWh in 2027, while expecting U.S. gas prices that “incentivize” production growth at around $4.60/mmBtu in 2026 and $3.80/mmBtu in 2027. [25]
That framing is important: the market is effectively searching for a level that keeps enough supply coming (especially from the U.S.) without crushing demand—an equilibrium that is increasingly shaped by LNG export capacity decisions, like the Lake Charles pause, and by policy choices, like Australia’s domestic reservation plan. [26]
As of Dec. 22, 2025 (10:23), the natural gas story is not a single narrative—it’s a set of interlocking ones:
1. www.tradingview.com, 2. www.tradingview.com, 3. tradingeconomics.com, 4. www.hellenicshippingnews.com, 5. www.hellenicshippingnews.com, 6. in.investing.com, 7. in.investing.com, 8. in.investing.com, 9. www.tradingview.com, 10. www.tradingview.com, 11. in.investing.com, 12. minister.dcceew.gov.au, 13. www.theguardian.com, 14. www.reuters.com, 15. www.reuters.com, 16. www.reuters.com, 17. www.reuters.com, 18. www.reuters.com, 19. www.reuters.com, 20. www.reuters.com, 21. www.businesswire.com, 22. www.reuters.com, 23. www.tradingview.com, 24. in.investing.com, 25. www.reuters.com, 26. www.reuters.com, 27. in.investing.com, 28. www.hellenicshippingnews.com, 29. www.tradingview.com, 30. www.reuters.com, 31. www.tradingview.com, 32. www.hellenicshippingnews.com, 33. in.investing.com, 34. minister.dcceew.gov.au
Silver (XAG/USD) prolongs its recent well-established uptrend and climbs to a fresh record high, around the $69.45 area, during the Asian session. Moreover, the broader technical setup seems tilted firmly in favor of bullish traders and suggests that the path of least resistance for the white metal remains to the upside.
Against the backdrop of repeated rebounds from the 100-hour Simple Moving Average (SMA) over the past two weeks or so, last week’s breakout through the $66.40-$66.50 horizontal resistance was seen as a key trigger for the XAG/USD bulls. A subsequent strength beyond the $67.20-$67.25 region last Friday validates the near-term positive outlook. The white metal currently trades around the $69.25 area, up 3% for the day.
Meanwhile, the Relative Strength Index (RSI) on hourly/daily charts sits above the 70 mark, signaling stretched conditions that could prompt a pause. The 100-hour SMA climbs to $65.57, with price holding well above it, keeping the near-term trend biased upward. Moreover, the Moving Average Convergence Divergence (MACD) stands at 0.19 in positive territory and continues to rise, suggesting strengthening bullish momentum.
Buyers would retain control while XAG/USD remains above the rising 100-period SMA, and a pullback toward $65.57 would meet dynamic support. The MACD staying positive supports the bullish tone, while an overbought RSI suggests consolidation could precede further gains. A decisive continuation above intraday highs could extend the advance, whereas failure to hold above the average would open room for a deeper retracement.
(The technical analysis of this story was written with the help of an AI tool)
(This story was corrected on December 22 at 07:36 GMT to say in the second bullet point that the overbought RSI, not overnight, on hourly/daily charts warrants caution before placing fresh bullish bets.)
Silver is a precious metal highly traded among investors. It has been historically used as a store of value and a medium of exchange. Although less popular than Gold, traders may turn to Silver to diversify their investment portfolio, for its intrinsic value or as a potential hedge during high-inflation periods. Investors can buy physical Silver, in coins or in bars, or trade it through vehicles such as Exchange Traded Funds, which track its price on international markets.
Silver prices can move due to a wide range of factors. Geopolitical instability or fears of a deep recession can make Silver price escalate due to its safe-haven status, although to a lesser extent than Gold’s. As a yieldless asset, Silver tends to rise with lower interest rates. Its moves also depend on how the US Dollar (USD) behaves as the asset is priced in dollars (XAG/USD). A strong Dollar tends to keep the price of Silver at bay, whereas a weaker Dollar is likely to propel prices up. Other factors such as investment demand, mining supply – Silver is much more abundant than Gold – and recycling rates can also affect prices.
Silver is widely used in industry, particularly in sectors such as electronics or solar energy, as it has one of the highest electric conductivity of all metals – more than Copper and Gold. A surge in demand can increase prices, while a decline tends to lower them. Dynamics in the US, Chinese and Indian economies can also contribute to price swings: for the US and particularly China, their big industrial sectors use Silver in various processes; in India, consumers’ demand for the precious metal for jewellery also plays a key role in setting prices.
Silver prices tend to follow Gold’s moves. When Gold prices rise, Silver typically follows suit, as their status as safe-haven assets is similar. The Gold/Silver ratio, which shows the number of ounces of Silver needed to equal the value of one ounce of Gold, may help to determine the relative valuation between both metals. Some investors may consider a high ratio as an indicator that Silver is undervalued, or Gold is overvalued. On the contrary, a low ratio might suggest that Gold is undervalued relative to Silver.
Robinhood Markets (HOOD) rose in its latest intraday trading, as the stock attempts to relieve part of its clear oversold condition on the RSI indicators, especially with the emergence of positive signals. However, negative pressure remains in place due to trading below its previous 50-day SMA, which reinforces the stability and dominance of the short-term descending corrective trend, particularly with price action moving alongside a supporting trendline.
High-risk warning: HOOD belongs to a group of stocks commonly known as “meme stocks,” which are characterized by heavy speculative activity. As a result, the stock’s price movement often deviates from technical expectations or fundamental analysis, and can at times be sudden and unpredictable.
Therefore we expect the stock to decline in its upcoming trading, especially as long as it remains below the resistance level at $125.60, targeting the pivotal support level at $102.10.
Today’s price forecast: Bearish
Gold is back in focus as price hold near record territory. On December 22, 2025, XAU/USD was trading close to $4,350, a level that would have sounded unrealistic just a few years ago. Yet today, it feels almost normal. Global investors are no longer asking if gold belongs in portfolios. They are asking how much exposure makes sense.
Several forces are shaping this moment. Interest rate expectations are shifting. Inflation fears have not fully faded. Central banks are still buying gold at a steady pace. At the same time, long-term forecasts are turning bolder. Some analysts now see a path toward $5,000 gold by 2026.
This price action is not driven by panic. It reflects deeper changes in how gold is viewed. Not just as a hedge. But as a strategic asset. The current consolidation near $4,350 shows caution, not weakness. Markets are pausing. Watching data. Waiting for the next trigger. And gold is quietly holding its ground.
As of December 22, 2025, gold hit a record high above $4,383 per ounce, and briefly pushed past $4,400, driven by hopes for more U.S. interest rate cuts and strong demand for safe assets like bullion.
Gold has climbed sharply this year. Prices are up about 67% in 2025, making this one of the strongest annual gains in decades.Even at levels near $4,350, buyers remain active. This shows the market is waiting for strong signals before moving higher. A weaker U.S. dollar and expectations that the Federal Reserve will cut rates next year are adding to the pressure.
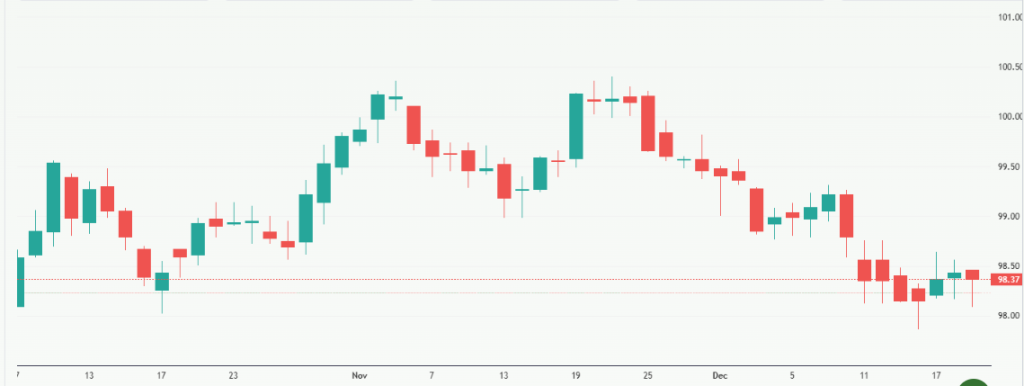
Instead of falling back, gold keeps finding support at these high prices. Traders see this as a sign that demand is real, not just short-term speculation. More data will soon show whether this trend continues into 2026 or cools off after a huge rally.
Gold’s role in markets has changed dramatically over the past year. In early 2025, the rally began on safe-haven flows. Now, broad macro trends are backing price strength. This includes investor demand, central bank buying, and fears linked to global instability.
Unlike past cycles where gold only moved during crises, the current environment shows structural drivers pushing prices higher. Central banks have been big buyers of gold for years, and they continue to add reserves. This demand adds a firm base under prices.
Economic uncertainty, persistent inflation fears, and ongoing geopolitical risks have made gold a core part of many portfolios. This has turned gold from a trading asset into a strategic hedge for 2025 and beyond.
Several major financial institutions now see gold rising toward or above $5,000 per ounce by 2026. Reports show that banks like Bank of America and Société Générale have forecasts in this range.
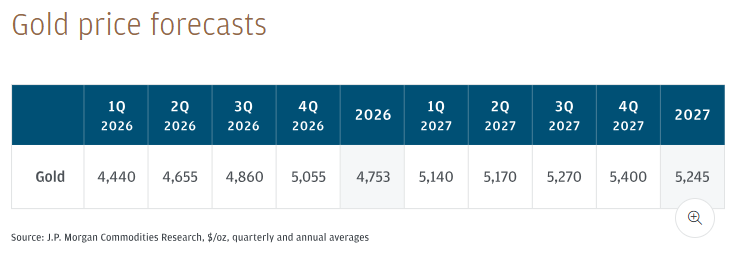
JP Morgan has forecast that gold could average over $5,000 per ounce by the fourth quarter of 2026, citing strong investor interest and central bank buying. Goldman Sachs projects a target near $4,900 by the end of 2026, backed by heavy official gold purchases.
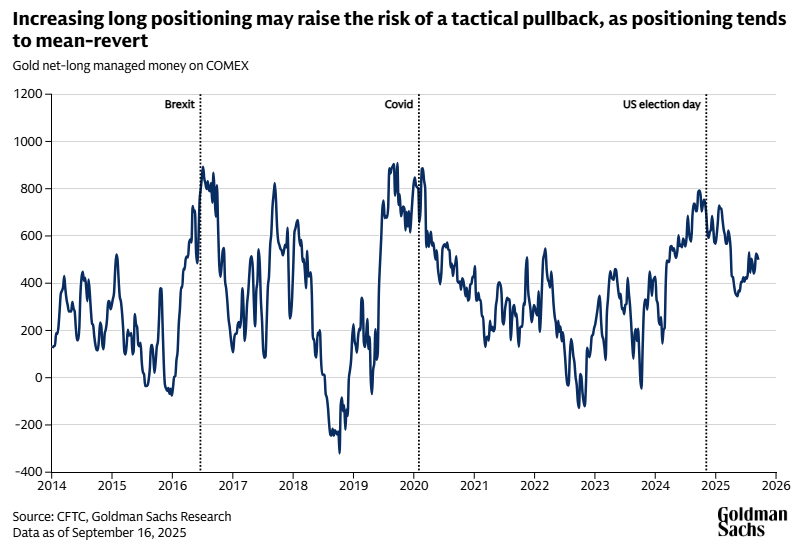
These forecasts are not random guesses. They are based on models that assume continued demand, declining real yields, and broader geopolitical and economic risks remaining elevated. A path toward $5,000 is seen by some analysts as the natural next step if current trends persist.
Gold prices are highly sensitive to U.S. monetary policy expectations. When traders expect the Federal Reserve to cut interest rates, gold usually rises. This is because lower rates reduce the opportunity cost of holding non-yielding assets like gold.
In late 2025, markets priced in multiple rate-cut expectations for 2026. This has weakened the U.S. dollar and boosted gold. Even if rate cuts are gradual, a shift toward easier policy tends to support gold prices. The market is now watching incoming economic data closely for stronger clues on the Fed’s next moves.
Central banks around the world have been buying gold at a fast pace in recent years. This steady demand is not driven by short-term traders. It is structural. Countries diversify reserves to reduce reliance on the U.S. dollar, and gold becomes a key part of that strategy.
The pace of official gold purchases has stayed high through 2025, and projections suggest this trend will continue into 2026. Many banks now see this steady demand as a significant factor in pushing gold prices higher.
Three broad pressures are reinforcing gold’s appeal. First, inflation remains a concern globally, even as some inflation measures soften. Second, high public debt levels in major economies create uncertainty about future policy responses. Third, geopolitical risks continue to drive safe-haven buying.
When these pressures exist together, investors tend to seek assets that protect purchasing power and offer stability. Gold fits both roles. This mix of forces helps explain why prices are not falling back despite already high levels.
Technically, gold has been trading in a high range near $4,350. Analysts watch key support and resistance levels to judge whether the trend will extend or stall. Recent trading has shown gold holding above major support zones, signaling that buyers are active even after a big rally.
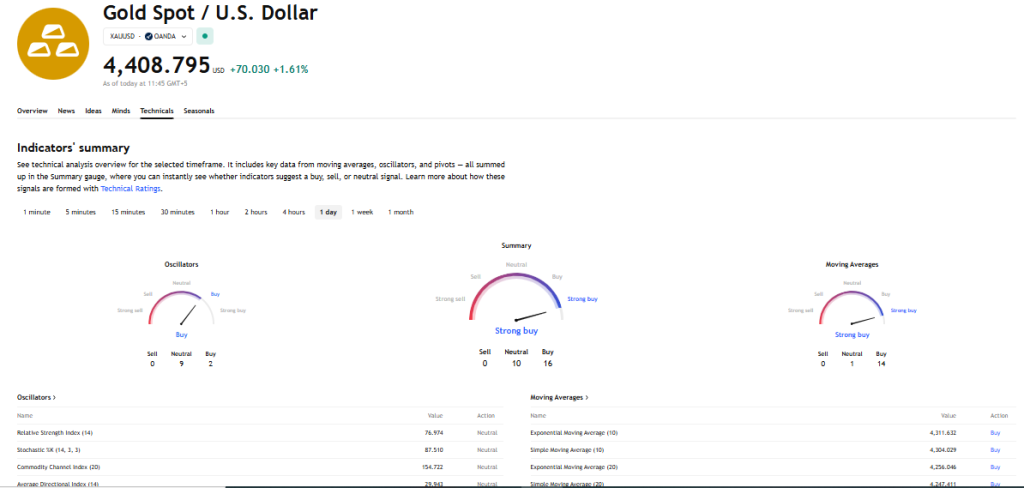
Short-term indicators show possible minor pullbacks, but the broader trend remains constructive unless critical levels break to the downside. Trading near these high levels is part of a normal consolidation after strong gains.
Simply calling gold “overvalued” at these levels misses the bigger picture. When adjusted for inflation and other factors, gold’s purchasing power remains strong. Historic comparisons show that current prices reflect long-term structural shifts rather than just short-term bubbles.
Even if price moves slow for a period, the fundamental drivers suggest that higher levels could still be justified over time.
Several risks could slow gold’s rise. A stronger-than-expected U.S. economy might delay rate cuts, boosting the dollar and pressuring gold. Geopolitical risks could ease, reducing safe-haven demand. Or central banks could slow their buying pace if prices rise too fast.
These risks do not make gold bearish. They simply show that the path to potential $5,000 levels is not guaranteed and depends on how key macro factors evolve.
Looking ahead, gold remains an important asset for diversification. Short-term moves may be volatile, but the broader trend shows strong support. Expert forecasts vary, but many see room for further gains. Central bank demand, monetary policy shifts, and ongoing uncertainty all feed into this outlook.
Even if gold does not hit exactly $5,000 in 2026, the trend toward higher ranges suggests it will remain a key part of global markets in the near future.
Many analysts see gold staying strong in 2026. Some forecasts put averages near $4,000-$4,900 per ounce by year‑end, backed by demand and macro trends.
Some major banks like Bank of America and HSBC say gold could hit or approach $5,000 in 2026 if rate cuts and safe‑haven flows persist.
Gold moves with factors like interest rates, U.S. dollar strength, central bank buying, and global risks, making it sensitive to macroeconomic shifts.
Disclaimer
The content shared by Meyka AI PTY LTD is solely for research and informational purposes. Meyka is not a financial advisory service, and the information provided should not be considered investment or trading advice.
Natural gas price failed by breaking the bullish channel’s support, affected by the continuation of the main indicators’ contradiction until this moment, which forces it to provide new sideways trading by its stability near $4.060.
The price confinement between the main support at $3.900 while $4.200 level is expected by forming strong barrier against the current trading, therefore, we recommend the neutrality for today, waiting for surpassing one of the main levels, to detect the expected trend in the near and medium period trading.
The expected trading range for today is between $3.900 and $4.200.
Trend forecast: Neutral
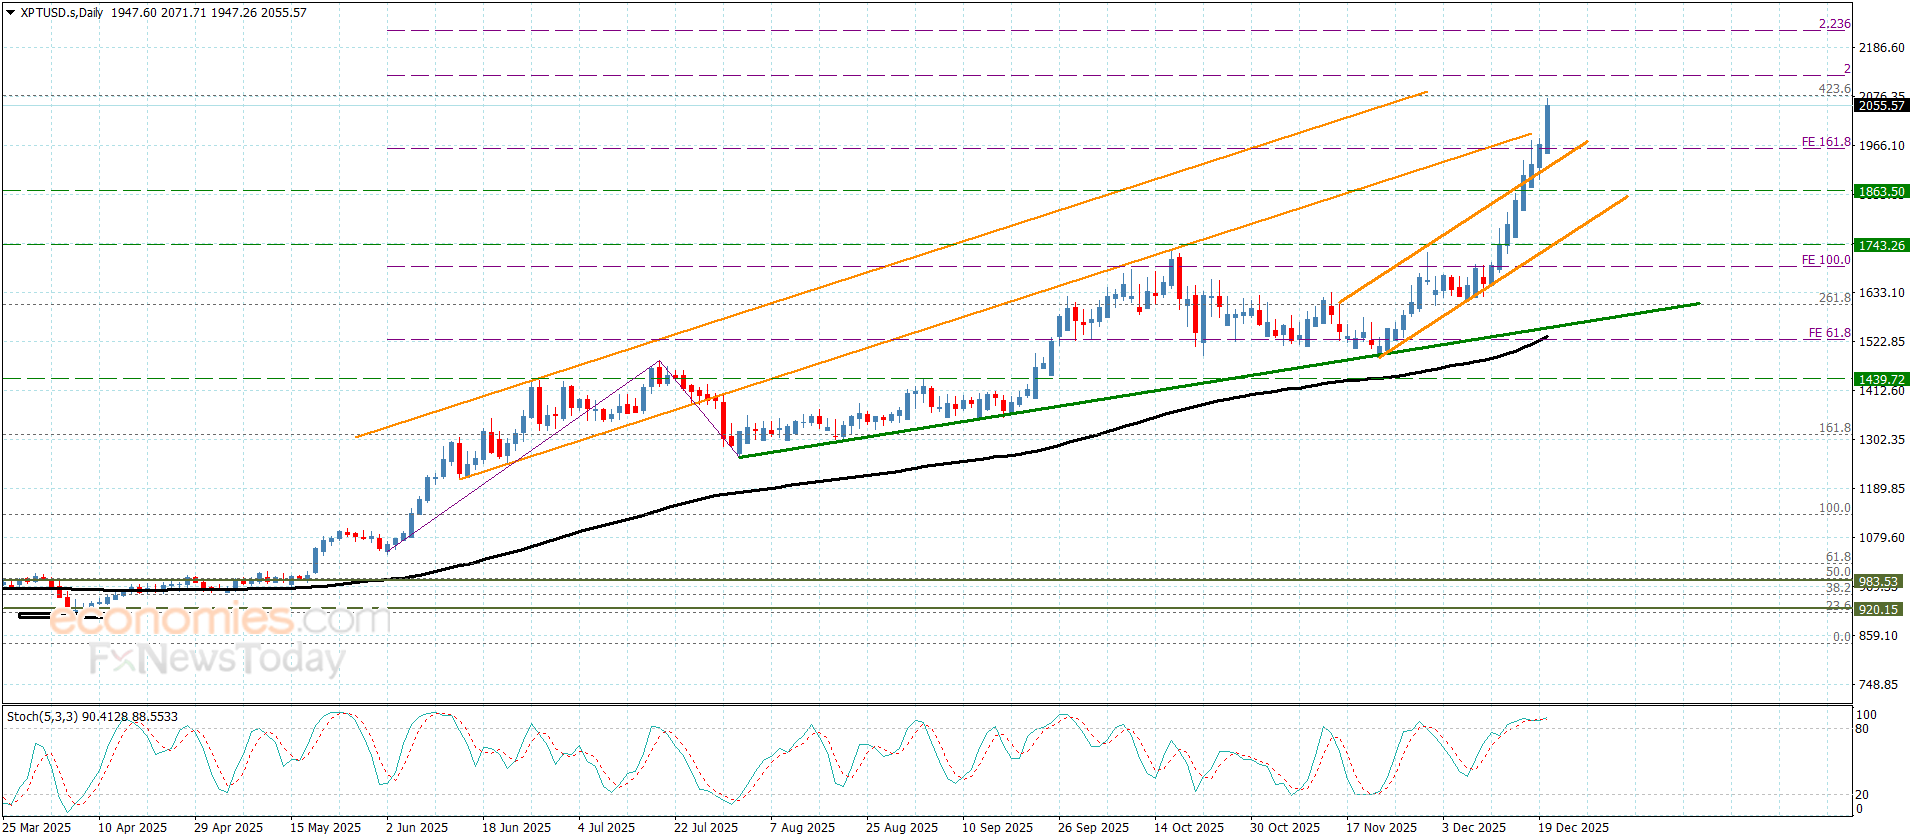
Platinum price did not get enough by its recent gains, activating with the main indicators positivity by forming strong bullish waves, to settle above the psychological barrier at $2000.00 level, recording extra historical gains by hitting $2071.00 level.
Which confirms the stability of the bullish scenario, and its stability above $2000.00 makes us expect to form new bullish waves, to attempt to reach $2085.00 and $2125.00.
The expected trading range for today is between $1970.00 and $2085.00.
Trend forecast: Bullish
Silver price (XAG/USD) trades 2.5% higher to near $69.00 during the Asian trading session on Monday, the highest level ever seen. The white metal strengthens as investors shift to a safe-haven fleet on renewed tensions between Israel and Iran.
According to a report from NBC News, Israeli officials have grown increasingly concerned that Iran is expanding production of its ballistic missile program and reconstituting its nuclear facilities, which were damaged by Israeli military strikes earlier this year, and are preparing to brief United States (US) President Donald Trump about options for attacking it again.
The scenario of geopolitical tensions increases demand for safe-haven assets, such as Silver.
On the Federal Reserve’s (Fed) monetary policy front, investors remain confident that the central bank will not reduce interest rates in the January policy meeting. Fed dovish expectations for the January meeting have not accelerated, despite the release of the soft US inflation data for November.
On Thursday, the US Consumer Price Index (CPI) data for November showed that the headline inflation cooled down to 2.7% year-on-year (YoY) from 3% in October. Economists expected the inflation data to come in higher at 3.1%. The so-called core reading, which strips out volatile food and energy items, dropped to 2.6% from estimates and the prior reading of 3%.
XAG/USD trades higher around $69.02 at the start of the week. The 20-period Exponential Moving Average at $61.14 rises firmly and sits well below the price. The wide positive spread underscores a strong uptrend but also stretched conditions.
The 14-day Relative Strength Index (RSI) at 77.44 is overbought, and a cooling phase could follow. A rising trend line from $49.96 underpins the bullish bias.
With price extended above the 20-EMA, pullbacks could find support at $61.14, preserving the advance. Momentum remains robust, yet the overbought RSI may cap near-term gains; a break below the trend line near $65 would weaken the bias and open the door for a deeper retracement toward the December 3 high near $59.00. Looking up, the psychological level of $60.00 would act as major barrier.
(The technical analysis of this story was written with the help of an AI tool.)
Silver is a precious metal highly traded among investors. It has been historically used as a store of value and a medium of exchange. Although less popular than Gold, traders may turn to Silver to diversify their investment portfolio, for its intrinsic value or as a potential hedge during high-inflation periods. Investors can buy physical Silver, in coins or in bars, or trade it through vehicles such as Exchange Traded Funds, which track its price on international markets.
Silver prices can move due to a wide range of factors. Geopolitical instability or fears of a deep recession can make Silver price escalate due to its safe-haven status, although to a lesser extent than Gold’s. As a yieldless asset, Silver tends to rise with lower interest rates. Its moves also depend on how the US Dollar (USD) behaves as the asset is priced in dollars (XAG/USD). A strong Dollar tends to keep the price of Silver at bay, whereas a weaker Dollar is likely to propel prices up. Other factors such as investment demand, mining supply – Silver is much more abundant than Gold – and recycling rates can also affect prices.
Silver is widely used in industry, particularly in sectors such as electronics or solar energy, as it has one of the highest electric conductivity of all metals – more than Copper and Gold. A surge in demand can increase prices, while a decline tends to lower them. Dynamics in the US, Chinese and Indian economies can also contribute to price swings: for the US and particularly China, their big industrial sectors use Silver in various processes; in India, consumers’ demand for the precious metal for jewellery also plays a key role in setting prices.
Silver prices tend to follow Gold’s moves. When Gold prices rise, Silver typically follows suit, as their status as safe-haven assets is similar. The Gold/Silver ratio, which shows the number of ounces of Silver needed to equal the value of one ounce of Gold, may help to determine the relative valuation between both metals. Some investors may consider a high ratio as an indicator that Silver is undervalued, or Gold is overvalued. On the contrary, a low ratio might suggest that Gold is undervalued relative to Silver.
Silver is closing out 2025 with the kind of momentum that forces both bulls and bears to pay attention. As of Sunday, December 21, 2025, the silver price (XAG/USD) is hovering around the $67-per-ounce area after a record-setting surge late last week—powered by a mix of investment flows, tight supply conditions, and an industrial demand narrative that keeps getting louder. [1]
But this is also the point in a parabolic move where markets tend to change character: liquidity thins into the holidays, positioning gets crowded, and even small headlines can trigger outsized swings. Several analysts publishing today warn that a “breather” week is possible, even if the broader trend remains bullish into 2026. [2]
Below is a complete, publication-ready roundup of today’s (21.12.2025) silver price news, forecasts, and analyses, plus the macro and technical signals traders are watching right now.
Because it’s a weekend, most “live” silver quotes are effectively tracking Friday’s U.S. session close and subsequent thin, OTC price discovery. Reuters reported that spot silver rose to about $67.14/oz on Friday (Dec. 19) after hitting a fresh record intraday high near $67.45/oz, capping a powerful weekly move. [3]
The bigger headline is the scale of the run: Reuters also noted silver has surged roughly triple-digit percentage points in 2025 (around the 120%–130% range depending on measurement), dramatically outperforming gold this year. [4]
Why this matters for today (Dec. 21):
The silver story right now is not one single catalyst—it’s a cluster of reinforcing forces.
Reuters explicitly framed the rally as heavily investment-driven, quoting market participants who emphasized that speculation is playing a major role even though fundamentals are supportive. [6]
On Friday, Reuters also pointed to ETF flows and retail speculation as a continuing theme in silver’s latest leg higher. [7]
Silver (like gold) is highly sensitive to the path of real yields and the U.S. dollar. Reuters highlighted that:
Reuters described silver’s persistent supply deficit and tightening conditions outside the U.S. as part of the bullish backdrop, adding that earlier tariff-related concerns helped pull metal toward the U.S., tightening liquidity in the London spot market. [9]
Silver’s unique twist versus gold is that it’s not just a hedge or store of value; it’s also an industrial input. Reuters cited demand prospects tied to AI data centers, solar cells, and electric vehicles as part of the “perfect storm.” [10]
One of the more interesting 2025 developments: Reuters reported that silver’s inclusion on the U.S. critical minerals list has supported prices. [11]
Here’s what the major silver-related commentary dated Sunday, December 21, 2025 is saying.
FXLeaders’ weekly outlook says silver closed at about $67.17 last Friday, framing it as a decisive post-breakout hold. Their technical roadmap is clear:
DailyForex’s weekly forecast (created Dec. 21) emphasizes the strength of the breakout while warning that moves are “messy” and volatility is elevated. The analyst’s stance: being long can still make sense, but with smaller position sizing because silver is leading the whole precious-metals complex and can whip around quickly. [13]
A PTI wire carried by The Week warns that gold and silver may take a breather next week due to year-end thin volumes, while traders focus on U.S. macro releases (GDP, housing data, durable goods, consumer confidence). [14]
It also notes that on India’s MCX:
Moneycontrol’s Dec. 21 commodities note (from Kotak Securities’ research head) presents a clean technical framework for MCX silver:
The Times of India also flags the same holiday dynamic: lower participation into Christmas and New Year can create higher sensitivity to economic releases, potentially producing sudden dips or sharp squeezes even if the longer-term trend remains constructive. [17]
With silver trading in “price discovery” territory after repeated all-time highs, forecasts are converging around a simple question:
Bull case (continuation):
Base case (pause / churn):
Bear case (profit-taking / air pocket):
Even among analysts warning about short-term volatility, the medium-term narrative remains bullish in much of today’s commentary—because the same forces that drove the 2025 surge aren’t clearly fading yet.
The important nuance: those upside projections don’t imply a smooth path. Silver is notorious for sharp corrections inside bull markets, and multiple analysts publishing this week have highlighted how quickly “stretched” conditions can unwind.
Silver’s appeal is also its danger: it often behaves like “gold with a turbocharger.” That’s great on the way up—until it isn’t.
One widely circulated warning in recent coverage: Barron’s highlighted research suggesting silver has reached historically extreme deviations versus major moving averages, conditions that in past cycles (like 2011 and 2020) were followed by steep pullbacks exceeding 20%. [25]
That doesn’t invalidate the bullish thesis—it simply reframes timing and risk. In practical terms, it means the next big move could be either:
Even in a holiday-shortened week, silver traders are watching a tight set of macro inputs because they feed directly into the dollar-rate-real-yield equation.
Across today’s Dec. 21 outlook pieces, the most-cited catalysts are:
And the most important market-structure point: because of the holidays, price action may be “subdued” at times—but paradoxically swings can be larger when participation is thin. That’s exactly why multiple analysts are warning about volatility even while staying constructive on trend. [30]
Silver is ending 2025 near record highs around $67/oz, backed by a narrative that blends Fed-cut expectations, strong industrial demand, and supply tightness with heavy investment flows. [31]
For the week ahead, the market is essentially split into two camps:
1. www.reuters.com, 2. www.theweek.in, 3. www.reuters.com, 4. www.reuters.com, 5. www.theweek.in, 6. www.reuters.com, 7. www.reuters.com, 8. www.reuters.com, 9. www.reuters.com, 10. www.reuters.com, 11. www.reuters.com, 12. www.fxleaders.com, 13. www.dailyforex.com, 14. www.theweek.in, 15. www.theweek.in, 16. www.moneycontrol.com, 17. timesofindia.indiatimes.com, 18. www.fxleaders.com, 19. www.theweek.in, 20. www.fxleaders.com, 21. www.marketpulse.com, 22. www.livemint.com, 23. www.reuters.com, 24. www.livemint.com, 25. www.barrons.com, 26. www.theweek.in, 27. www.fxleaders.com, 28. www.theweek.in, 29. www.moneycontrol.com, 30. www.theweek.in, 31. www.reuters.com, 32. www.fxleaders.com, 33. www.barrons.com
Gold is ending 2025 where it spent much of the year: near record territory, with investors debating whether the next move is a breakout—or a breath. As of Sunday, December 21, 2025, live spot pricing put gold around $4,352/oz, keeping the metal within striking distance of its 2025 record near $4,381/oz and reinforcing the narrative that bullion has shifted from a “rate-cut trade” into a structural portfolio asset for central banks and investors alike. [1]
What makes today’s setup especially interesting is the collision of three powerful themes: fresh signals that the Federal Reserve could keep rates steady for months, year-end liquidity conditions that can amplify swings, and a growing consensus among major banks that 2026 could still bring gold closer to $4,800–$5,000 even if the pace of gains slows from 2025’s historic surge. [2]
Live spot quotes on Sunday showed gold at $4,352.63/oz (12:08 PM ET), up modestly on the day. [3]
On major pricing feeds tracking XAU/USD, the current exchange rate was around 4,338.55, with an indicated daily range roughly between 4,309 and 4,356—a reminder that different feeds (spot quotes, broker composites, OTC pricing windows) can vary slightly, especially around weekends and thin liquidity. [4]
For context, gold’s 2025 run has been extraordinary: the World Gold Council notes the metal notched 50+ all-time highs this year and delivered 60%+ returns, driven by a mix of geopolitical risk, USD weakness, and momentum. [5]
A key macro headline on Dec. 21 came via Reuters: Cleveland Fed President Beth Hammack said she sees no need to change U.S. interest rates for months, with the current benchmark range at 3.5% to 3.75%, suggesting policy could stay on hold until at least spring while officials assess inflation dynamics—including the downstream effects of tariffs moving through supply chains. [6]
Why it matters for the gold price:
Gold tends to dislike “higher-for-longer” surprises because firmer rate expectations can lift real yields and support the dollar—both classic headwinds for non-yielding bullion. But the 2025 playbook has been more complicated: strong demand from central banks and diversification-focused investors has repeatedly cushioned pullbacks, even when rates didn’t fall as fast as markets hoped. [7]
The most striking feature of late-December research is how many mainstream institutions now treat $4,500+ gold as plausible—even if they warn the rally may cool.
One widely shared late-December thesis: even after the rally, gold may still be under-allocated in key markets. Business Insider, citing Goldman’s analysis, reported gold ETFs were only ~0.17% of private U.S. financial portfolios, and Goldman estimated that even small increases in allocation could have an outsized price effect in a comparatively small market. [15]
Reuters’ late-year roundup captured the scale of the move: gold posted its biggest jump since the 1979 oil crisis, with prices doubling in the last two years and reaching a record around $4,381/oz in October. [16]
Strategists highlighted several forces that turned a “normal” macro rally into something more structural:
Reuters described central-bank reserve diversification away from dollar assets as a key foundation for 2026, with official buyers stepping in when positioning looks stretched and prices dip. [17]
Gold’s 2025 story is no longer just “rates and recession.” Reuters pointed to new market participants (including corporate/crypto-linked buyers) and a broader investor pool. [18]
ING, citing World Gold Council figures, reported global gold demand reached 1,313 tonnes in Q3 2025, described as the strongest quarterly total on record, driven by investment demand (ETFs, bars, coins) and central-bank buying. [19]
Analysts cited concerns ranging from geopolitics to policy disputes and questions about Fed independence as additional support pillars for bullion going into 2026. [20]
Not everyone is comfortable with how gold behaved in 2025.
Reuters reported that the Bank for International Settlements (BIS) raised concerns about a rare co-movement of gold and equities that it says hasn’t been seen in at least half a century, suggesting “growing fragility” in a risk-on environment and questioning what happens if both stocks and gold correct together. Reuters also noted BIS commentary that gold began behaving “much more like a speculative asset,” and flagged unusual signals such as gold ETF pricing trading at a premium versus NAV (per the BIS discussion reported by Reuters). [21]
For gold investors, this matters because it challenges the simplest “safe haven always offsets equities” assumption—especially in a world where portfolio rebalancing can force selling across asset classes during sharp drawdowns.
Gold’s price is driven mainly by macro and demand—but policy and supply headlines can still shape sentiment, especially when they reinforce the “gold as sovereignty” narrative.
Reuters reported that an Italian parliamentary committee approved an amendment declaring that the central bank’s gold reserves belong to “the people,” drawing criticism from the ECB over potential implications for central bank independence. Italy’s reported stockpile is 2,452 metric tons, valued around $300 billion in the Reuters report. [22]
Even if largely symbolic, the story underscores how politically salient gold reserves have become in an era of fiscal strain and de-dollarisation debates.
On the supply side, Reuters reported Zimbabwe reversed plans to double gold royalties to 10%, keeping 5% royalties for gold between $1,200 and $5,000/oz, and applying 10% only above $5,000/oz. Reuters also noted Zimbabwe’s gold production hit 42 metric tons in the first 11 months of 2025, a record. [23]
With Christmas week beginning, many desks are lightly staffed, and liquidity can thin quickly—conditions that often amplify short-term moves in FX, rates, and metals.
India-based market coverage on Dec. 21 highlighted a common theme: year-end low volumes can mean quieter trading—or sudden swings if a surprise data print hits a thin book. Times of India reported analysts watching U.S. data such as GDP, housing statistics, and consumer confidence, while anticipating reduced participation around the holidays. [24]
A separate Dec. 21 report carried by Rediff (PTI/market commentary) similarly emphasized the risk of consolidation/correction amid low participation, while pointing to the same cluster of U.S. macro releases as near-term catalysts. [25]
Technical commentary published on Dec. 21 illustrates how tight the market’s focus has become around the highs:
The key takeaway: when a market grinds near record highs late in the year, the first big move can be exaggerated—either a breakout that forces under-allocated investors to chase, or a quick pullback driven by profit-taking and thin liquidity.
Putting the day’s headlines and the latest institutional forecasts together, the 2026 gold narrative is shaping up around three questions:
For now, price action says the bull market is not “over”—it’s being renegotiated. Gold is no longer just reacting to the next CPI print; it’s being priced as a strategic hedge against a wider set of risks: geopolitics, reserve diversification, fiscal concerns, and shifting confidence in fiat stability. [31]
1. www.jmbullion.com, 2. www.reuters.com, 3. www.jmbullion.com, 4. www.investing.com, 5. www.gold.org, 6. www.reuters.com, 7. www.reuters.com, 8. www.reuters.com, 9. www.reuters.com, 10. www.reuters.com, 11. www.reuters.com, 12. www.reuters.com, 13. www.reuters.com, 14. www.ssga.com, 15. markets.businessinsider.com, 16. www.reuters.com, 17. www.reuters.com, 18. www.reuters.com, 19. think.ing.com, 20. www.reuters.com, 21. www.reuters.com, 22. www.reuters.com, 23. www.reuters.com, 24. timesofindia.indiatimes.com, 25. money.rediff.com, 26. www.fxempire.com, 27. www.dailyforex.com, 28. www.reuters.com, 29. www.reuters.com, 30. www.reuters.com, 31. www.gold.org
December 21, 2025 — Natural gas markets are closing out the year with a familiar winter paradox: heating season is underway, but prices are being dragged lower by milder temperature forecasts and a supply picture that still looks comfortable in both the U.S. and Europe.
In the United States, NYMEX natural gas futures for January delivery slid to $3.879 per million British thermal units (mmBtu) in the latest session, touching a seven-week low as traders priced in warmer-than-normal weather into early January and continued strength in Lower 48 production. [1]
Globally, the soft tone is reinforced by weaker benchmark prices in Europe and Asia—reducing LNG “pull” from overseas and narrowing export margins. At the same time, major structural stories continue to reshape the longer-term outlook: Qatar-linked expansion activity moved forward with a new offshore contract, while at least one large proposed U.S. export project was paused amid cost and oversupply concerns. [2]
Below is a detailed look at the key news, forecasts, and market analysis shaping natural gas as of Dec. 21, 2025.
The current U.S. move is less about a sudden collapse in fundamentals and more about a rapid repricing of winter expectations. After earlier cold-driven strength, the latest model runs shifted warmer—enough to shave expected heating demand in the critical late-December/early-January window.
Reuters-reported market data showed meteorologists expecting weather to stay mostly warmer than normal through Jan. 3, reducing the volume of gas needed for residential and commercial heating. [11]
At the same time, supply remains strong. Lower 48 output has been hovering near record levels (~109.6 bcfd), giving the market less reason to pay up for winter risk. [12]
One of the most telling indicators is the forward curve. The March–April 2026 spread—nicknamed the “widow-maker” for how violently it can move when late-winter weather swings—compressed to around a 1-cent premium, an unusually calm signal for the end of winter. [13]
Storage is also helping keep a lid on panic pricing. In the same Reuters dataset, the U.S. storage position was shown close to normal—recently around 0.9% above the five-year average at the reported point in time (with totals cited around 3,579 bcf for the referenced week). [14]
That doesn’t mean winter is “solved.” It means the market currently believes supply + storage are adequate unless a sustained cold regime emerges.
U.S. LNG export demand continues to be a critical support pillar. Feedgas to the eight major U.S. LNG plants averaged around 18.5 bcfd so far this month—up from a monthly record of 18.2 bcfd in November, according to Reuters-reported figures. [15]
However, softer global gas benchmarks are complicating the picture.
Earlier in the week, Reuters reporting noted European (TTF) and Asian (JKM) benchmarks trading near multi‑month lows, with global prices declining as the winter heating season began slowly and markets weighed prospects of improved Russia-linked supply conditions over time. [16]
This matters because LNG is not just a “volume” story—it’s a margin story. When international prices fall faster than Henry Hub (or when shipping and liquefaction costs rise), U.S. cargo economics can tighten, especially for spot-linked volumes.
Operationally, traders are still tracking plant-level events. Reuters noted a shutdown of one liquefaction train at Freeport LNG in Texas during the week, a reminder that unplanned outages can quickly change short-term balances. [17]
Separately, Reuters also pointed to small flow declines at Venture Global facilities in Louisiana in recent days (as referenced in market reporting), though overall U.S. LNG feedgas stayed near record highs. [18]
One of the most important structural stories heading into 2026 isn’t a price tick—it’s what developers are doing (or not doing) with multi‑billion-dollar export projects.
Energy Transfer said it is suspending development of its Lake Charles LNG export project in Louisiana, citing a preference to focus capital on pipeline investments amid rising costs and fears of looming global oversupply as more LNG capacity comes online. The project had been planned at roughly 16.45 million tonnes per annum of liquefaction capacity. [19]
For the market, this is a two-sided signal:
While some U.S. capacity ambitions are being reassessed, Qatar’s expansion narrative keeps moving.
Italy’s Saipem won an offshore EPCI contract from QatarEnergy LNG (in partnership with China’s COOEC), with the overall contract value around $4 billion and Saipem’s share around $3.1 billion. The work is described on a multi‑year timeline, with offshore installation operations expected later in the decade. [20]
The strategic message is clear: Qatar’s North Field-linked expansion remains one of the most consequential supply additions expected for the second half of the 2020s.
For traders and policymakers, that raises the central question: Will demand growth (Europe’s LNG reliance, Asia’s industrial/power growth, and new uses like data center power demand) keep pace with the supply wave? [21]
European gas is increasingly shaped by policy—and by the reality that LNG is now a structural pillar of supply.
The European Parliament approved the bloc’s plan to phase out Russian gas imports, including halting Russian LNG by end‑2026 and ending pipeline gas imports by end‑September 2027. Reuters reported Russia accounted for about 12% of EU gas imports as of October 2025, down sharply from pre‑2022 levels. [22]
This is a long-duration bullish factor for LNG infrastructure and flexible supply—but it doesn’t automatically translate into high near-term prices if weather is mild and inventories are adequate.
Another European factor that could influence LNG flows—and compliance costs—is methane policy.
Reuters reported the U.S. asked the EU to exempt U.S. oil and gas imports from aspects of the EU’s methane emissions regulation until 2035, framing it as a trade barrier and warning of implementation challenges given complex U.S. supply chains and commingled molecules. The EU, however, signaled the legislation stands while discussing implementation pathways. [23]
For market participants, methane rules can affect contract structures, certification practices, and potentially the attractiveness of certain supply sources over time—particularly in a world where Europe is expected to remain a premium LNG buyer for years.
Even as prices soften, European gas market activity is expanding. Intercontinental Exchange (ICE) reported record trading volumes for benchmark Dutch TTF contracts in 2025 and said it is preparing to extend trading hours to better align with global cycles, reflecting how Europe’s gas pricing is increasingly connected to Henry Hub and Asian LNG benchmarks. [24]
A major regional headline this week came from the Eastern Mediterranean.
Reuters reported Israel approved what it described as its largest-ever natural gas export deal—valued around $34.67 billion—to supply Egypt with gas from the Leviathan field. The deal referenced roughly 130 bcm of gas through 2040 (or until the contract value is met), and it comes as Egypt works through an energy crunch linked to domestic production declines and rising demand. [25]
Why this matters beyond the region:
Natural gas is increasingly global: LNG prices and flows often ripple back into domestic energy bills.
In Australia, policy debate remains active over how to protect local consumers and industry from LNG-linked price pressures. Reporting highlighted concerns around high gas prices and scrutiny of mechanisms meant to ensure adequate domestic supply. [26]
For global readers, the takeaway is broader than Australia: countries that are large LNG exporters often face political pressure to “decouple” domestic pricing from international markets—especially when cost-of-living becomes a dominant theme.
Forecasting gas is notoriously difficult because weather dominates and LNG is both a demand source and a volatility amplifier. Still, several major outlooks released or highlighted in December frame today’s debate: Is the recent pullback a pause—or a reset lower?
In its December Short‑Term Energy Outlook messaging, EIA forecast Henry Hub natural gas prices at $3.56/mmBtu for 2025 and $4.01/mmBtu for 2026, and described winter conditions putting upward pressure on prices—projecting a winter average around $4.30/mmBtu in its forecast narrative. EIA also projected U.S. LNG gross exports rising to ~16 bcfd in 2026 (from ~15 bcfd in 2025). [27]
Enverus Intelligence Research projected Henry Hub prices averaging about $3.80/mmBtu through winter before softening to around $3.60/mmBtu in summer 2026, arguing the earlier run-up had gotten ahead of fundamentals amid expectations for a mild winter and continued Lower 48 supply growth. [28]
Reuters reporting on Goldman’s outlook included expectations that in 2026 Dutch TTF could average around €29/MWh and U.S. natural gas around $4.60/mmBtu, illustrating how some bank forecasts still lean above what today’s softened winter curve implies. [29]
Kpler’s European natural gas outlook suggested EU‑27 storage could end the 2025–26 winter around 36% full, with the estimate sensitive to LNG import expectations and pipeline inflows—another reminder that Europe’s balance is increasingly an LNG scheduling story. [30]
Natural gas is entering a period where small changes in weather models can drive outsized moves. Here’s what professionals are watching right now:
1. www.tradingview.com, 2. www.tradingview.com, 3. www.tradingview.com, 4. www.tradingview.com, 5. www.tradingview.com, 6. www.tradingview.com, 7. www.reuters.com, 8. www.reuters.com, 9. www.reuters.com, 10. www.eia.gov, 11. www.tradingview.com, 12. www.tradingview.com, 13. www.tradingview.com, 14. www.tradingview.com, 15. www.tradingview.com, 16. www.tradingview.com, 17. www.tradingview.com, 18. www.tradingview.com, 19. www.reuters.com, 20. www.tradingview.com, 21. www.reuters.com, 22. www.reuters.com, 23. www.reuters.com, 24. www.reuters.com, 25. www.reuters.com, 26. www.theguardian.com, 27. www.eia.gov, 28. www.mrt.com, 29. www.reuters.com, 30. www.kpler.com, 31. www.tradingview.com, 32. www.tradingview.com, 33. www.tradingview.com, 34. www.reuters.com, 35. www.reuters.com