The main tag of Gold Today Price Articles.
You can use the search box below to find what you need.
[wd_asp id=1]
The main tag of Gold Today Price Articles.
You can use the search box below to find what you need.
[wd_asp id=1]
In technical market analysis, tracking Elliott Wave structures step-by-step allows traders to stay aligned with the primary trend direction while managing risk effectively. Today, we review a recent forecast for Silver ($XAGUSD), comparing our 4-hour forecast from late September 2026 against the price action through mid-October 2026.
The Forecast: 09.24.2026
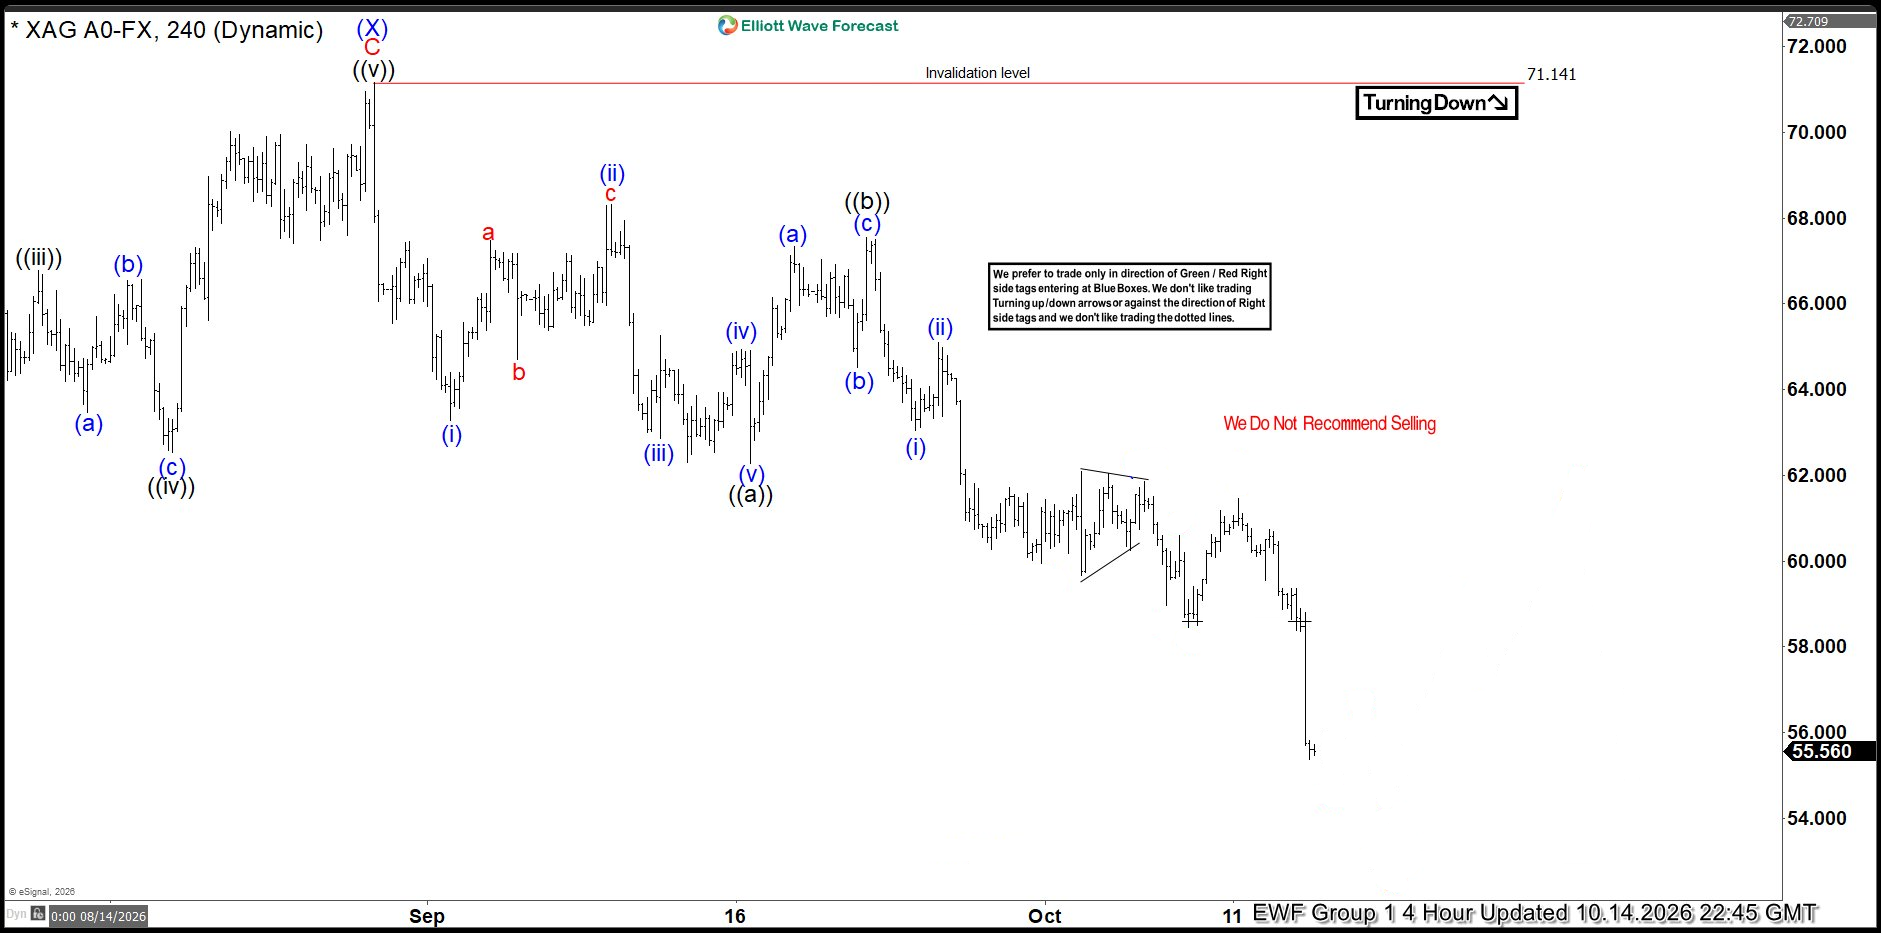
In our 09.24.2026 4-hour update, Silver was trading near 63.73 after completing a peak at the major wave (X). At the time, the Elliott Wave structure favored a bearish outlook while remaining below the key invalidation level at 71.122. The forecast called for the completion of the remaining sub-waves (iii), (iv), and (v) of ((c)), which were expected to drive price lower into the 60.414 – 58.538 target zone and complete the larger wave W. From there, a corrective wave X bounce was anticipated before Silver resumed the broader bearish sequence and continued lower. See chart below.
The Outcome: 10.14.2026
As anticipated in our October 14, 2026 4-hour update, $XAGUSD respected the invalidation level and followed the projected bearish path. Silver accelerated sharply to the downside, breaking well below the initial 60.41 – 58.53 target zone and invalidating nearby support levels along the way. The decline continued to unfold through the lower-degree waves, reinforcing the bearish momentum. Price has since extended toward the 55.56 area, confirming the strength of the downtrend while remaining firmly below the updated invalidation level at 71.141, keeping the broader bearish outlook intact. See chart below
Note: Certain labels have been intentionally concealed to protect the exclusivity of our members.
Key Takeaways for Traders
One of the key lessons from this analysis was the importance of staying aligned with the prevailing trend. By maintaining a bearish outlook while price remained below the 71.122 – 71.141 invalidation zone, traders were able to stay on the right side of the market throughout the sharp decline. Equally important was the disciplined focus on Elliott Wave structure rather than attempting to predict every short-term fluctuation. Despite several intermediate consolidations, the wave count continued to provide clear downside objectives, well-defined risk parameters, and a reliable roadmap for navigating the bearish sequence.
Why choose EWF ?
At Elliottwave Forecast (EWF), we deliver consistent market updates through regular charts update. Our analysts update 1‑hour charts four times daily and 4‑hour charts once per day across all 78 instruments. In addition, we host five live sessions each day and maintain a 24‑hour chatroom, providing clients with real‑time market guidance and answers to any questions they may have.
You can start a 14‑day trial with us today here and cancel anytime by emailing support@elliottwave-forecast.com
Follow on X @NgcoboGen
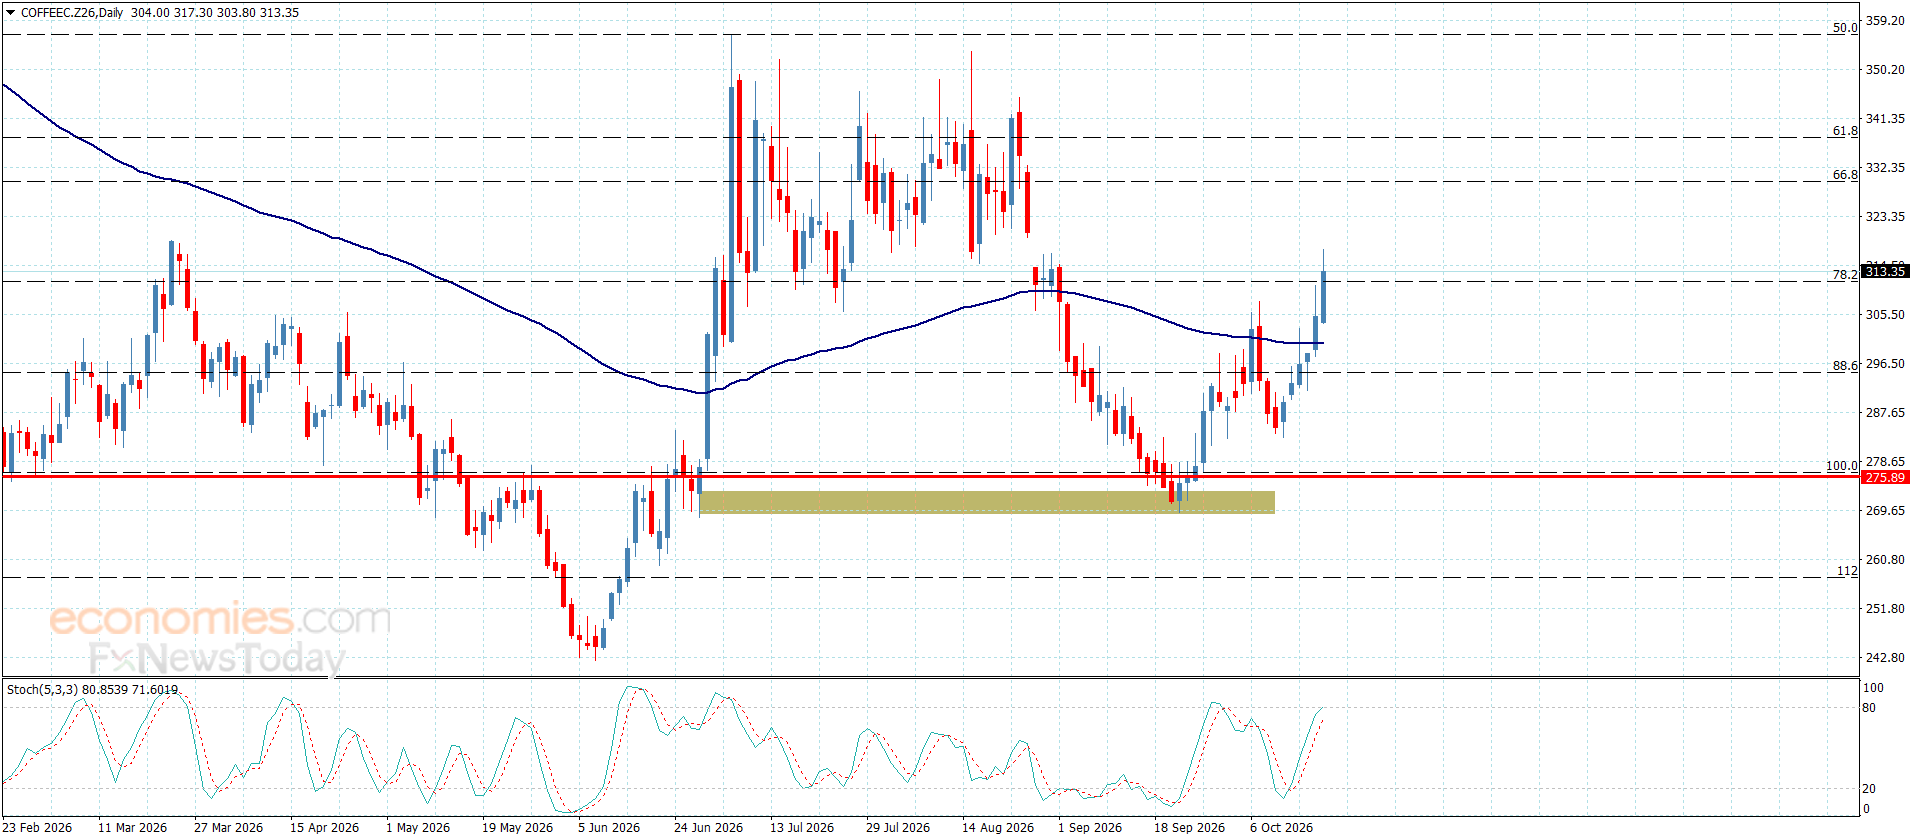
Coffee prices resumed the previously suggested bullish move, finding support above the 55-period moving average, positioned near 300.50. This has given prices room to extend their gains, reaching 317.30.
Sustained positive momentum could strengthen the bullish trend, with prices expected to challenge the resistance barrier near 320.50 soon. A break above this level would pave the way for an immediate advance toward the next major target at 329.70.
The expected trading range for today is between 307.50 and 320.50
Trend forecast: Bullish
Risk Warning: This article is provided for informational purposes only and does not constitute investment advice, investment research, or a recommendation to trade. The views expressed are those of the author and do not necessarily reflect the position of Markets.com. When considering shares, indices, forex (foreign exchange), and commodities for trading and price predictions, remember that trading CFDs involves a significant degree of risk and may not be suitable for all investors. Leveraged products can result in capital loss. Past performance is not indicative of future results. Before trading, ensure you fully understand the risks involved and consider your investment objectives and level of experience. Cryptocurrency CFD trading restrictions may apply depending on jurisdiction.

Dak Nong continues to have the highest purchase prices, while Lam Dong is at the lower end of the price list. This article was prepared on the evening of October 19th for October 20th, 2026, when the international market is still trading and the new harvest in Vietnam has begun.

Compared to last weekend, coffee prices in all four growing regions increased by 200 VND/kg on October 19th. Dak Lak and Gia Lai had the same purchase price of 93,000 VND/kg, 200 VND/kg lower than Dak Nong.
| Area | Prices as of October 19, 2026, VND/kg | Change compared to last weekend, VND/kg |
|---|---|---|
| Dak Lak | 93,000 | +200 |
| Lam Dong | 92,300 | +200 |
| Gia Lai | 93,000 | +200 |
| Dak Nong (formerly Lam Dong) | 93,200 | +200 |
The difference between the highest and lowest prices is 900 VND/kg. The average price index published in the tracking table reached 93,100 VND/kg; this is the source index, not the arithmetic average of the four local prices in the table.
The increase of 200 VND/kg was on October 19th and does not yet reflect transactions on October 20th.
At the latest update on the evening of October 19th (Vietnam time), the reference prices for both Robusta and Arabica were higher than the previous session’s levels on the same tracking chart.
| Market, contract | Prices quoted during the October 19th trading session. | Prices may change according to the price list. |
|---|---|---|
| Robusta London, November 2026 — RCX6 | 3,463 USD/ton | +41 USD/ton, equivalent to +1.20% |
| Arabica New York, December 2026 — KCZ6 | 310.72 cents/lb | +5.12 cents/lb, equivalent to +1.68% |
The figures above are reference prices while the trading session is in progress. Changes are calculated based on the previous session’s price from the same price list, not combined with closing prices from other sources.
If the upward trend in the international market continues until the end of the session, domestic purchase prices on October 20th may receive further support. However, the closing price is not enough to confirm that the domestic market will rise immediately at the start of the new day.
The harvest in Vietnam has begun, gradually replenishing the market supply. As sales increase, the upward price trend may face resistance, especially if businesses are slow to buy. Therefore, developments at the end of the international trading session and actual purchasing demand need to be monitored together.

OPEC+ policy also needs to be thought of in specific terms. Seven participating countries agreed on October 4 to maintain September-required production levels for November, with their next meeting set for November 1. That is a production policy decision, not proof that every country has produced the required volume or successfully exported it.
For Brent, verified changes in shipping access, delivered supply, and refinery throughput would therefore carry more weight than an unconfirmed geopolitical headline. Higher transport costs can be altering delivered economics, but this report does not assign a fresh freight or insurance premium without an official measurement. While the WTI U.S. stock draw is relevant through trade connections, it does not establish the same degree of tightness in every international crude grade, such as Brent.
Regional detail also causes a few wrinkles. South Central stocks were at 1,097 Bcf, compared with a five-year average of 1,132 Bcf. Within that region, salt cavern stocks were 236 Bcf against a 279 Bcf average. Other regions partially offset that shortfall in the national comparison. These figures are relevant to the Gulf area balance associated with Henry Hub, but do not by themselves establish any pipeline constraint.
The latest official weather outlook leans against a broad late-October heating surge. NOAA’s Climate Prediction Center issued a discussion at 3 p.m. EDT on Oct. 18 for Oct. 24-28. It favored above-normal temperatures across most of the eastern half of the country, with probabilities exceeding 80% in parts of the Upper Midwest. Cooler-than-normal odds were elevated in parts of the West, while portions of the eastern seaboard leaned closer to normal.
These are probabilities relative to seasonal norms, not measured temperatures or quantified gas-demand forecasts. A warm Upper Midwest could restrain heating needs compared with a colder alternative. However, the location and duration of any outbreaks of cold will still matter, and warm conditions can retain some cooling demand in the very deep South.
EIA’s October Short-Term Energy Outlook provides a broader benchmark with an important timing limitation. Released on Oct. 6 and current through Oct. 1, it forecasts storage of 3,850 Bcf at the end of October, roughly 2% above the five-year average. This is a modeled result, not gas already measured in storage. It also predates NOAA’s Oct. 18 forecast and subsequent operational developments.
As of writing, gold is near $4,184 on the 1-hour chart. What’s notable is how the price has been consolidating in a tight range of $4,176 to $4,201 during the recovery from the mid-month lows. Meanwhile, the rising trendline is reaching the $4,176 support, and both moving averages are located underneath. The faster of the two has crossed above the slower, which is constructive for the short-term outlook.
The initial resistance is at $4,201, a level that has been holding rejections over the past few sessions. A break above that would put $4,218 and then $4,240 in sight. Below, a breakdown of $4,176 and the trendline would open up support at $4,152, and then $4,132 and $4,111.
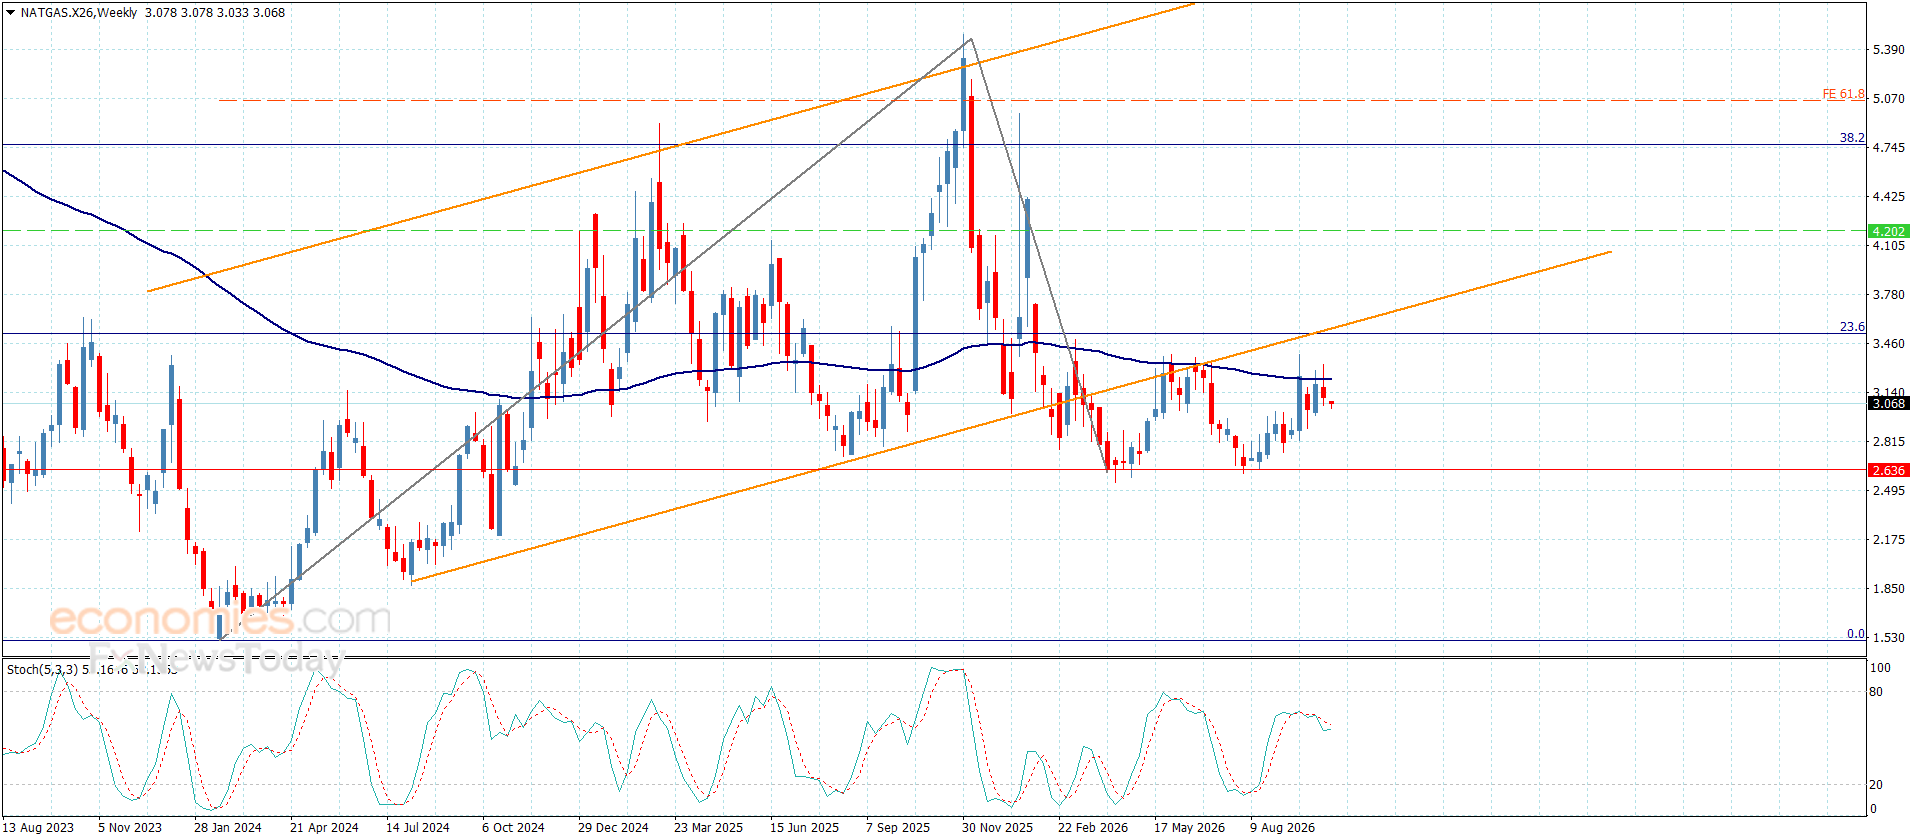
Natural gas prices have recently been forced into some sideways trading, stabilizing near $3.060 amid conflicting signals from the main technical indicators, particularly as the 55-period moving average continues to form a strong resistance barrier near $3.250.
We emphasize the importance of gathering additional positive momentum to maintain stability above the support level at $2.850, before attempting to renew pressure on the 55-period moving average. This could create an opportunity to achieve further gains, with the next targets currently standing at $3.420 and $3.550.
The expected trading range for today is between $3.00 and $3.250.
Trend forecast: Bullish
Investments in cryptocurrencies, including but not limited to purchasing Global X Copper Miners xStock and other digital assets through Bybit, carry significant market risk. Should the digital asset you are seeking not be currently available on Bybit, please be advised that it will be introduced in the near future. Bybit disclaims all liability for any results or outcomes of such investments. The information regarding pricing and other relevant data presented herein is derived from publicly available sources. This content does not reflect the official stance of Bybit and should not be construed as investment advice, a recommendation, or an offer to buy, sell, or hold any form of digital assets.
Investors are urged to thoroughly evaluate their financial capacity for trading or holding digital assets and are advised to seek consultation from qualified legal, tax, or investment professionals based on individual circumstances.
For comprehensive details, please review Bybit’s Terms of Service.
That was a number buyers could work with on Thursday. It was not enough to keep them involved Friday.
Storage is still 1.3% above the five-year seasonal average, even though inventories are 4.1% below a year ago. The EIA still sees end-of-October storage reaching 3,985 Bcf, the highest level in 10 years and 5% above the five-year average.
European gas prices reached a 3.75-year high Friday. Storage was 74% full on October 14, well below the 89% five-year seasonal average.
U.S. LNG flows were 20.5 Bcf per day, up 6.2% from the prior week. That is still the bullish side of the trade.
Physical prices fell into the weekend outside the East. The market has European demand in front of it, but the weather trade is still winning at home.
LNG can keep the demand side from disappearing. It cannot create heating demand when the weather is not there.
Lower-48 dry gas production reached 113.9 Bcf per day Friday, up 5.0% from a year earlier, according to BNEF. Lower-48 gas demand was 71.5 Bcf per day, up 1.1% from a year earlier.
That production number is what makes the storage forecast hard to dismiss. The EIA raised its 2027 dry gas production estimate to 116.0 Bcf per day from 115.3 Bcf per day in July. Baker Hughes added one gas rig Friday, bringing the count to 133, just under the September 25 three-year high of 135.
The TCO outage gave the market a supply story Thursday. The expectation that the outage will be resolved Saturday gave traders less reason to carry that premium into the weekend.
The mild forecast gets the first vote when trading opens. Thursday’s smaller storage build, high European prices and strong LNG flows are still part of the bullish case. But the TCO repair, production at 113.9 Bcf per day and warm weather through month-end are the reasons buyers left Friday’s trade.
The November trend turned down after the break under $3.092. The two main tops at $3.334 and $3.395 leave the bias to the downside. The 50-day moving average at $3.068 held Friday’s low, but a sustained move under it puts the main bottoms between $2.912 and $2.896 back in front of the market.
December has the weaker chart after failing at its 50-day moving average. The current setup is bearish with December natural gas futures on the weak side of the 50-day moving average during a swing-chart downtrend. The $3.448 to $3.394 area is Monday’s first line. A recovery through the zone would ease the pressure. A break under it leaves $3.234 as the next major downside target.
More Information in our Economic Calendar.