The main tag of Gold Today Price Articles.
You can use the search box below to find what you need.
[wd_asp id=1]
The main tag of Gold Today Price Articles.
You can use the search box below to find what you need.
[wd_asp id=1]
Gold Price Forecast: XAU/USD Retains Bearish Bias as Markets Brace for Fed Decision
Gold prices are holding a bearish bias as of mid-March 2025, with the XAU/USD pair trading under pressure ahead of the U.S. Federal Reserve’s upcoming monetary policy decision. The precious metal remains constrained by a strengthening U.S. dollar and rising bond yields, which continue to diminish the appeal of non-yielding assets like gold.
From a technical perspective, gold has failed to reclaim key resistance levels near $2,150 per ounce, with sellers maintaining control below the 50-day moving average. The daily chart shows a series of lower highs since late February, suggesting that momentum has shifted in favor of bears. Immediate support lies at the $2,080 region, a break of which could open the door toward the $2,020 area.
The Relative Strength Index (RSI) on the daily timeframe has dipped below 45, indicating bearish momentum without being oversold. This leaves room for further downside before the asset enters technically oversold territory. Traders are watching for a decisive close below $2,080 to confirm the next leg lower.
The Federal Reserve is widely expected to hold interest rates steady at its March 2025 meeting, but the focus will be on the accompanying dot plot and Chair Jerome Powell’s commentary. Persistent inflation data in recent months has reduced expectations for near-term rate cuts, a scenario that typically weighs on gold prices.
Higher interest rates increase the opportunity cost of holding gold, which offers no yield. The U.S. Dollar Index (DXY) has climbed to a three-month high, further pressuring XAU/USD. Market pricing currently reflects only a 30% probability of a rate cut by June 2025, down from over 60% at the start of the year.
For physical gold holders and ETF investors, the current environment suggests a cautious approach. The bearish bias does not guarantee a sustained selloff, but it does indicate that the path of least resistance is lower in the near term. Safe-haven demand remains a supportive factor amid geopolitical uncertainties, but it has been insufficient to overcome macro headwinds.
Investors should monitor the Fed’s language on inflation and the economic outlook closely. A hawkish surprise could accelerate gold’s decline, while any dovish signals may trigger a short-term relief rally. The $2,080 support level will be the key line in the sand for traders this week.
Gold retains a bearish bias as of mid-March 2025, with technical indicators and macro factors aligning against the precious metal. The upcoming Federal Reserve decision represents the most significant near-term catalyst. A break below $2,080 would likely confirm further downside, while a hawkish Fed outcome could reinforce the current trend. Investors should remain focused on the central bank’s forward guidance for clearer direction.
Q1: Why is gold price bearish heading into the Fed week?
Gold is under pressure due to a stronger U.S. dollar, rising bond yields, and reduced expectations for Federal Reserve rate cuts. These factors collectively reduce the appeal of non-yielding assets like gold.
Q2: What is the key support level for XAU/USD right now?
The immediate support level is near $2,080 per ounce. A decisive break below this level could open the door toward the $2,020 region.
Q3: How could the Fed decision affect gold prices?
A hawkish Fed stance, signaling delayed rate cuts, would likely pressure gold further. Conversely, any dovish signals could trigger a short-term rally. The dot plot and Powell’s commentary will be critical.
This post Gold Price Forecast: XAU/USD Retains Bearish Bias as Markets Brace for Fed Decision first appeared on BitcoinWorld.
Silver Price Forecast: XAG/USD Rebounds as US Dollar Weakens
Silver prices (XAG/USD) recovered ground on [current trading date], snapping a recent losing streak as the US Dollar eased against a basket of major currencies. The rebound comes after a period of selling pressure that pushed the white metal to multi-week lows, with traders now assessing whether the move marks a temporary correction or the start of a more sustained uptrend.
The primary catalyst for the silver rebound is a softening of the US Dollar. The US Dollar Index (DXY) slipped lower on [current trading date], retreating from recent highs as market participants digested mixed economic data and adjusted expectations for Federal Reserve interest rate policy. A weaker dollar makes dollar-denominated commodities like silver more attractive to holders of other currencies, typically providing a tailwind for prices.
Additionally, a slight dip in US Treasury yields reduced the opportunity cost of holding non-yielding assets like silver. The metal has also found some support from renewed safe-haven demand amid lingering geopolitical uncertainties, though gains have been capped by a generally cautious risk appetite in broader financial markets.
From a technical perspective, XAG/USD is attempting to build on its recovery after finding buying interest near the $[support level] area. The immediate resistance level to watch is around $[resistance level], a zone that previously acted as support. A decisive break above this level could open the door for a test of the next resistance band near $[next resistance level].
On the downside, the recent low near $[support level] remains the key support to defend. A break below this level would negate the current recovery attempt and expose the next support zone near $[next support level]. The 14-day Relative Strength Index (RSI) is hovering near the oversold threshold, suggesting that selling pressure may be exhausted in the near term, but a clear directional catalyst is still lacking.
The current price action in silver underscores the metal’s sensitivity to US Dollar dynamics and interest rate expectations. For traders, the focus remains on upcoming US economic data releases, particularly inflation figures and employment reports, which could influence the Federal Reserve’s policy path. A more dovish Fed outlook would likely weaken the dollar further, providing additional support for silver and gold.
However, silver’s dual nature as both a precious metal and an industrial metal adds complexity to its outlook. Concerns about global industrial demand, particularly from China, could limit upside potential even if the dollar weakens. Investors should monitor industrial production data and manufacturing PMIs for signals on demand trends.
The silver price recovery is primarily a function of short-term US Dollar weakness, offering some relief after recent losses. While technical indicators suggest the potential for further gains, the sustainability of the move depends on incoming economic data and shifts in Federal Reserve policy expectations. Traders should remain cautious and watch for a confirmed break above key resistance levels before committing to a bullish stance.
Q1: Why does silver price move inversely to the US Dollar?
Silver is priced in US Dollars. When the dollar weakens, it takes fewer units of other currencies to buy the same amount of silver, increasing demand and pushing prices higher. Conversely, a stronger dollar makes silver more expensive for foreign buyers, typically weighing on prices.
Q2: What are the key support and resistance levels for XAG/USD right now?
As of [current trading date], immediate support is near $[support level], with the next key support at $[next support level]. On the upside, resistance is seen at $[resistance level], followed by $[next resistance level]. These levels are dynamic and can shift with market conditions.
Q3: How does Federal Reserve policy affect silver prices?
Federal Reserve interest rate decisions impact the US Dollar and Treasury yields. Higher rates tend to strengthen the dollar and increase the opportunity cost of holding non-yielding silver, which is bearish. Expectations of rate cuts or a pause in tightening typically support silver prices by weakening the dollar and lowering yields.
This post Silver Price Forecast: XAG/USD Rebounds as US Dollar Weakens first appeared on BitcoinWorld.
Copper price failed in breaching the barrier at $6.5100, forcing it to delay the bullish trend and providing a clear negative rebound, to settle near $6.2500, the current decline will not affect the chances of renewing the bullish trend, depending on the stability of the extra support at $6.1000, to wait for gathering positive momentum and begin forming bullish waves, to repeat the pressure on the mentioned barrier.
While the decline below the additional support and providing negative close will increase the strength of the bearish corrective track, to expect suffering several losses by reaching $5.9200 and $5.8100.
The expected trading range for today is between $6.1500 and $6.5000
Trend forecast: Fluctuated within the bullish trend
At 5:35 a.m. Eastern Time today, oil was priced at $97.04 per barrel with Brent serving as the benchmark (we’ll explain different benchmarks later in this article). That’s a drop of $1.45 compared with yesterday morning and around $27.50 higher than the price one year ago.
It’s impossible to forecast oil prices with detailed precision. Many different elements affect the market, but ultimately it boils down to supply and demand. When worries about economic recession, war, and other large-scale disruptions increase, oil’s path can shift fast.
Gas prices at the pump don’t only track crude oil. They also include what it takes to refine and move that fuel, the taxes layered on top, and the extra markup your local station adds to stay in business.
Since crude oil generally makes up a majority of the per-gallon cost, changes in its price have an outsized impact. When oil surges, gas prices typically rise in tandem. But when oil retreats, gas prices often lag on the way down, a trend sometimes described as “rockets and feathers.”
In case of emergency, the U.S. has a store of crude oil known as the Strategic Petroleum Reserve. Its primary purpose is energy security in case of disaster (think sanctions, severe storm damage, even war). But it can also go a long way toward softening crippling price hikes during supply shocks.
It’s not a long-term answer and is more meant to provide temporary relief, assisting consumers and keeping critical parts of the economy running, like key industries, emergency services, public transportation, etc.
Both oil and natural gas are key sources of the energy we use every day. Because of this, a big change in oil prices can affect natural gas. For example, if oil prices increase, some industries may swap natural gas for some segments of their operations where possible, which increases demand for natural gas.
To gauge oil’s performance, we often turn to two benchmarks:
Between these two, Brent better represents global oil performance because it prices much of the world’s traded crude. And, it’s often the best way to track historical oil performance. In fact, even the U.S. Energy Information Administration now uses Brent as its primary reference in its Annual Energy Outlook.
Looking at the Brent benchmark across several decades, oil has been anything but steady. It’s seen spikes due to factors such as wars and supply cuts, and it’s also seen crashes from global recessions and an oversupply (called a “glut”). For example:
All to say, oil’s historical performance has been anything but smooth. Again, it’s hugely affected by wars, recessions, OPEC whims, evolving energy initiatives and policies, and much more.
Looking to stay up-to-date regarding the latest energy developments? Check out our recent coverage:
The current price of oil per barrel depends largely on supply and demand, including news about potential future supply and demand (geopolitics, decisions made by OPEC+, etc.). In the U.S., prices also move based on how friendly an administration is to drilling, as it can affect future supply. For example, 2025 saw the Trump administration move to reopen more than 1.5 million acres in the Coastal Plain of the Arctic National Wildlife Refuge for oil and gas leasing, reversing the Biden administration’s policy of limiting oil drilling in the Arctic.
The price of oil updates constantly when the “futures” markets are open. A futures market is effectively an auction where people agree to buy or sell oil in the future. As long as people and companies are trading contracts, the oil price is changing.
In short, shale is rock that contains oil and natural gas. Think of shale as energy yet to be tapped. The more shale the U.S. accesses, the more energy we’ll have—and the more easily oil prices can keep from spiking as much thanks to a greater supply.
When oil is expensive, it tends to make everyday items cost more. This can be related to energy (your heating, gas utilities, etc.), but it’s also due to the logistics involved with making those items accessible to you. Shipping, for example, can affect the price of things at the grocery store, as it’s more expensive to get those products from warehouses and farms onto the shelf.
The article covers the following subjects:
Consider long positions from corrections above 79.67 with a target of 105.17–115.50.
Breakout and consolidation below 79.67 will allow the asset to continue declining to the levels of 67.00–58.50.
On the weekly chart, correction (2) of larger degree has formed, with wave C of (2) completed as its part. On the daily time frame, ascending wave (3) is likely developing. Within it, wave 1 of (3) of smaller degree and correction 2 of (3) have formed, and wave 3 of (3) has started unfolding. On the H4 chart, wave i of 3 continues to develop, with wave (iii) of i unfolding as its part. If the presumption is correct, WTI will continue to rise to 105.17–115.50. The level of 79.67 is critical in this scenario as a breakout below it will enable the asset to continue declining to the levels of 67.00–58.50.
This forecast is based on the Elliott Wave Theory. When developing trading strategies, it is essential to consider fundamental factors, as the market situation can change at any time.
The content of this article reflects the author’s opinion and does not necessarily reflect the official position of LiteFinance broker. The material published on this page is provided for informational purposes only and should not be considered as the provision of investment advice for the purposes of Directive 2014/65/EU.
According to copyright law, this article is considered intellectual property, which includes a prohibition on copying and distributing it without consent.
Copper price failed in breaching the barrier at $6.5100, forcing it to delay the bullish trend and providing a clear negative rebound, to settle near $6.2500, the current decline will not affect the chances of renewing the bullish trend, depending on the stability of the extra support at $6.1000, to wait for gathering positive momentum and begin forming bullish waves, to repeat the pressure on the mentioned barrier.
While the decline below the additional support and providing negative close will increase the strength of the bearish corrective track, to expect suffering several losses by reaching $5.9200 and $5.8100.
The expected trading range for today is between $6.1500 and $6.5000
Trend forecast: Fluctuated within the bullish trend
Domestic coffee prices today
Coffee prices today in the domestic market continue to be maintained below the 97,000 VND/kg mark after recent adjustment sessions.
According to the morning update on July 24, coffee prices in the Central Highlands region are commonly in the range of 95,900-96,500 VND/kg.
In Dak Lak, coffee prices were recorded at 96,400 VND/kg. Gia Lai also traded around 96,400 VND/kg.
In Lam Dong, coffee prices are at 95,900 VND/kg, the lowest among the surveyed areas.
The old Dak Nong area continues to have the highest price, reaching 96,500 VND/kg.
Thus, the domestic coffee price level has retreated quite far from the area approaching 99,000 VND/kg before. However, the price is still maintained at a high level compared to the beginning of July.
World coffee prices
In the world market, coffee prices continued to decrease in the most recent session.
On the London exchange, the September 2026 Robusta futures contract fell more than 2%, to around 3,705-3,708 USD/ton. The November 2026 futures contract also fell, to around 3,699 USD/ton.
On the New York exchange, the September 2026 Arabica futures fell 7.25 US cents/lb, to 309.40 US cents/lb. The December 2026 futures also fell 7.25 US cents/lb, to 296.45 US cents/lb.
This development shows that world coffee prices are still in a correction phase after a period of strong increase before. Robusta decreased deeper, putting more pressure on the domestic market, because Vietnam is a major Robusta producer.
Coffee price assessment
Domestic coffee prices currently have no clear signs of recovery, while world prices continue to decline. For Vietnamese coffee, the diễn biến on the London exchange is still a factor that needs to be closely monitored due to its direct impact on Robusta.
From a global market perspective, the International Coffee Organization (ICO) said that the average ICO aggregate price index in June 2026 reached 248.90 US cents/lb, down 2.8% compared to May 2026. ICO’s report also recorded a period of deep price decline in June before recovering towards the end of the month.
Regarding supply, the Foreign Agricultural Services Agency under the US Department of Agriculture (USDA/FAS) forecasts that Vietnam’s coffee production in the 2026-2027 crop year will reach 32.5 million bags converted to green beans, of which Robusta accounts for the majority. The prospect of increased supply is a factor that can curb price increases in the medium term.
For Brazil, USDA/FAS forecasts coffee production in the 2026-2027 crop year to reach 71.9 million bags, an increase of 14% compared to the previous crop year. This is a factor that continues to be monitored by the market, especially with the Arabica group.
Regarding weather, the Central Highlands is in the rainy season. The National Center for Hydro-Meteorological Forecasting predicts that in the period from July 21st to August 20th, the Central Highlands and Southern regions will have many days of showers and thunderstorms, with days of moderate to heavy rain, concentrated in the afternoon and night.
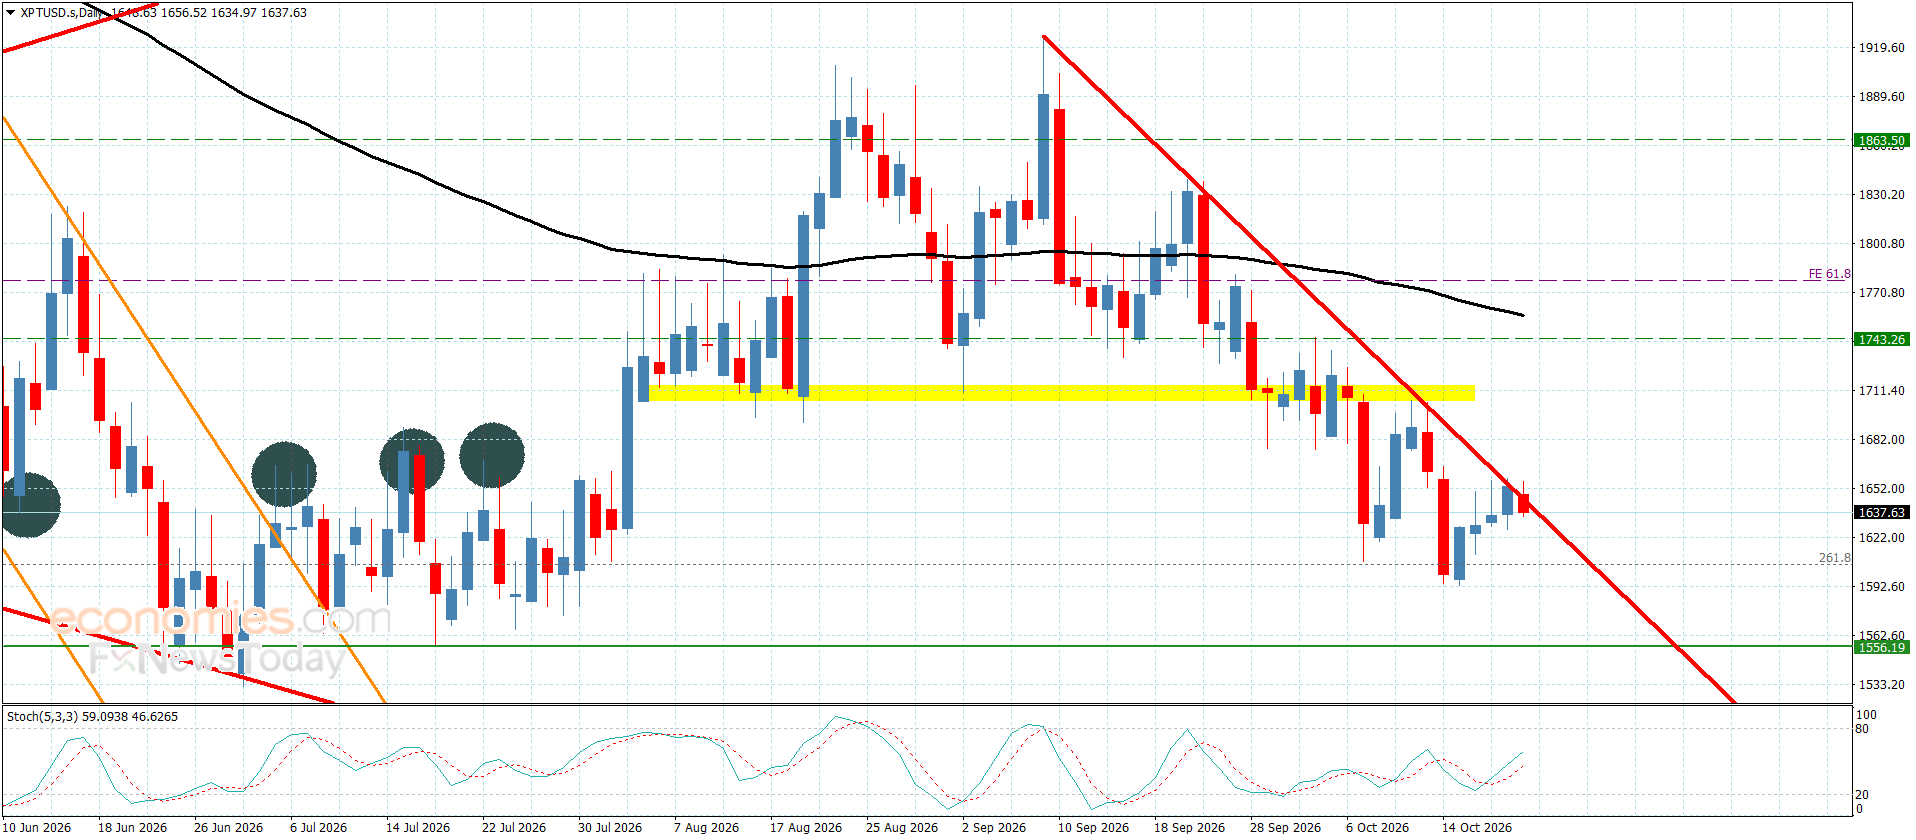
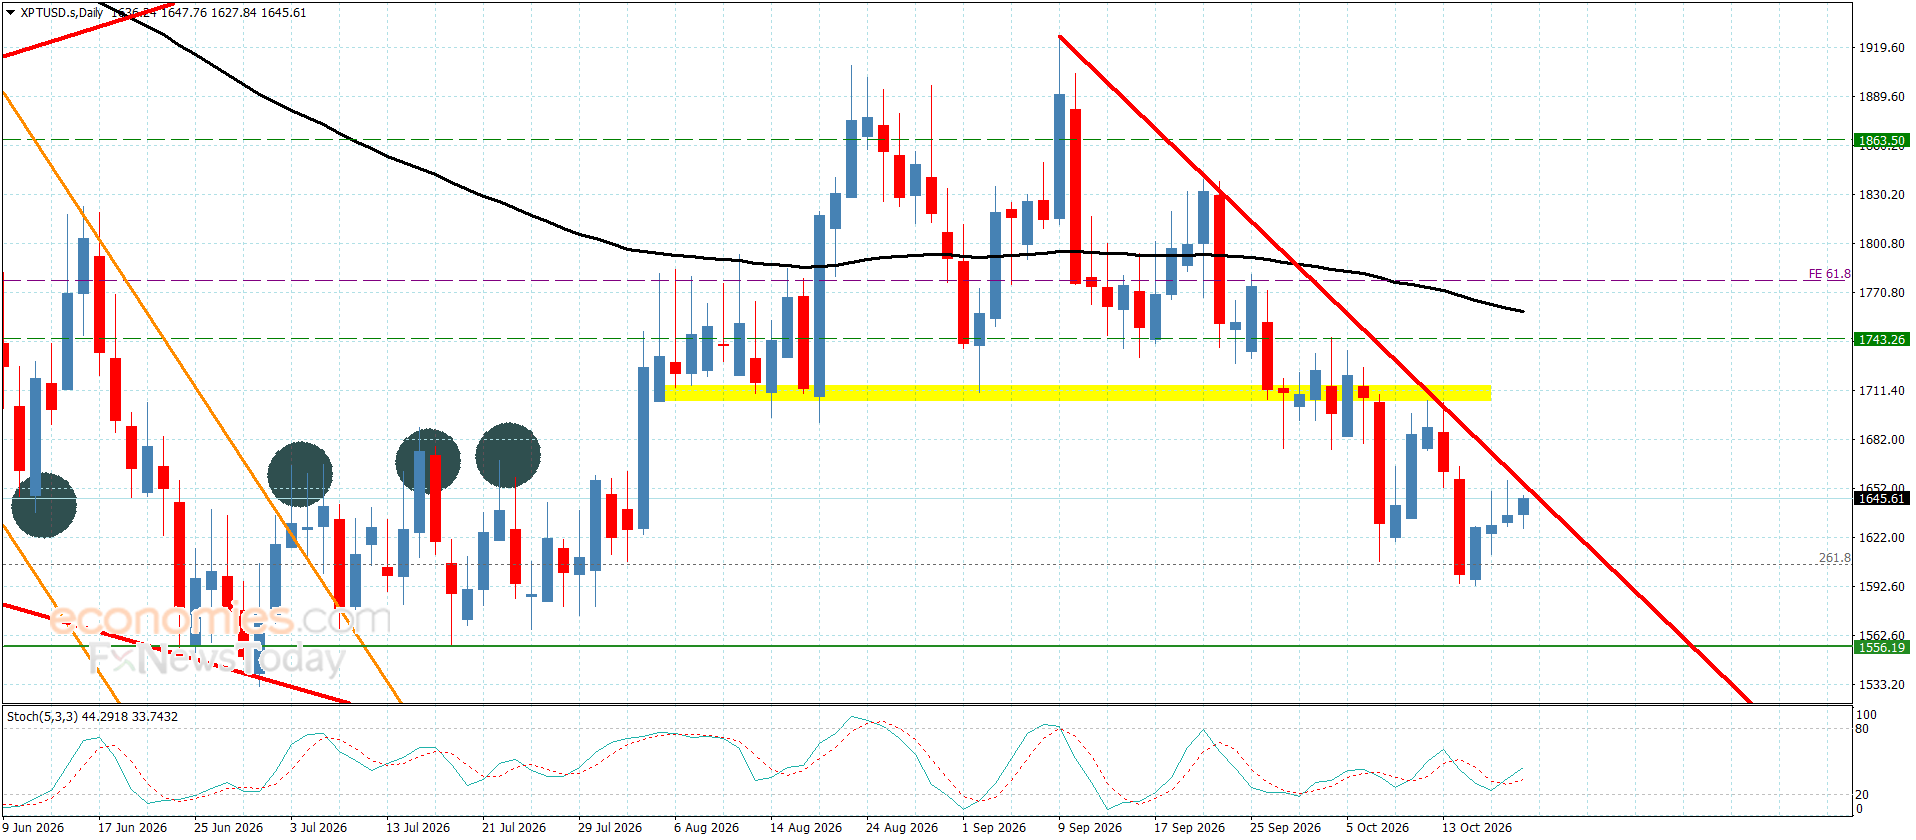
Platinum price provided positive closes above $1605.00 level, attempting to confirm the bullish corrective scenario, to rally towards $1655.00 level, confirming the bullish corrective scenario, to rally towards $1655.00 level, benefiting from the continuation of providing positive momentum by stochastic rally above 50 level in the last period.
We expect renewing the bullish attempts in the current period, pushing the barrier at $1690.00 to form initial target for the current trading, and surpassing it will extend the trading towards $1740.00 reaching $1790.00 resstance.
The expected trading range for today is between $1620.00 and $1690.00
Trend forecast: Bullish