The main tag of Gold Today Price Articles.
You can use the search box below to find what you need.
[wd_asp id=1]
The main tag of Gold Today Price Articles.
You can use the search box below to find what you need.
[wd_asp id=1]
Spot Gold pierced the $2,600 mark in the American session, further retreating from Friday’s peak at $2,638. Sentiment leads the way, with the US Dollar (USD) gaining momentum after Wall Street’s opening amid the poor performance of local indexes. Thin trading conditions exacerbate stocks’ decline, spurring USD near-term demand. Nevertheless, and despite near-term losses, the three major indexes are heading to close another year with solid gains.
Additionally, market players drop high-yielding assets amid uncertainty over what 2025 may bring. The United States (US) Federal Reserve (Fed) has recently announced it will slow the pace of interest rate cuts amid stubbornly high inflation. Also, former president Donald Trump will return to the White House on January 20 and his anticipated protectionism measures may mean even higher inflationary pressures ahead.
From a technical point of view, the daily chart for XAU/USD shows the pair has met intraday sellers around a bullish 100 Simple Moving Average (SMA), while the 20 SMA turns south above the longer one. Technical indicators, in the meantime, gain bearish traction within negative levels, favoring a downward extension towards the December low at $2,582.93.
In the near term, and according to the 4-hour chart, the bearish case is also solid. XAU/USD is currently developing below all its moving averages, with the 20 SMA gaining downward strength below the longer ones. At the same time, technical indicators head lower almost vertically, currently approaching oversold readings.
Support levels: 2,595.80 2,582.90 2,570.10
Resistance levels: 2,604.20 2,617.55 2,632.00
A winter cold blast is causing natural gas to spike.
That’s what Phil Flynn, a senior market analyst at the PRICE Futures Group, told Rigzone in an exclusive interview on Monday when asked why the U.S. natural gas price is rising today.
Flynn, who highlighted to Rigzone that the commodity “open[ed]… up over 10 percent higher” said “predictions of an arctic cold blast, and the possibility that this January may be the coldest in 30 years, is suddenly changing the fundable”.
“Not only will we see record demand but also the possibility of natural gas production freeze offs,” Flynn warned.
The PRICE Futures Group senior market analyst told Rigzone that the natural gas market “hasn’t really had to face a real winter”.
“Now we will test the bearish narratives in the market,” Flynn added.
When he was asked why the U.S. natural gas price is rising today in a separate exclusive interview on Monday, Gabriel Odiase, an analyst at the Agriculture and Horticulture Development Board (AHBD), said, “mainly uncertainties around the renewal, or not, of the major contract for transporting Russian gas through Ukraine, which is set to expire at the end of December”.
“This contract, between Russia’s Gazprom and Ukraine’s Naftogaz, has been key for delivering Russian gas to Europe,” Odiase told Rigzone.
“The contract expiry could shape Europe’s gas supply and market dynamics. This may potentially increase demand for LNG, as cover, at the start of the new year,” Odiase went on to state.
The U.S. Energy Information Administration’s (EIA) latest weekly natural gas storage report, which was released on December 27 and includes data for the week ending December 20, stated that “working gas in storage was 3,529 billion cubic feet as of Friday, December 20, 2024, according to EIA estimates”.
“This represents a net decrease of 93 billion cubic feet from the previous week. Stocks were 14 billion cubic feet higher than last year at this time and 166 billion cubic feet above the five-year average of 3,363 billion cubic feet,” the report added.
“At 3,529 billion cubic feet, total working gas is within the five-year historical range,” the EIA report went on to state.
The EIA’s next weekly natural gas storage report is scheduled to be released on January 3. It will show data for the week ending December 27.
In its latest short term energy outlook (STEO), which was released in December, the EIA raised its Henry Hub natural gas spot price forecast for 2024 and 2025.
According to its December STEO, the EIA sees the Henry Hub spot price averaging $2.19 per million British thermal units (MMBtu) in 2024 and $2.95 per MMBtu in 2025. The EIA’s previous November STEO projected that the Henry Hub spot price would average $2.17 per MMBtu in 2024 and $2.90 per MMBtu in 2025.
In another exclusive interview, ex-Independent Petroleum Association of America (IPAA) Chief Economist Frederick J. Lawrence told Rigzone on December 19 that natural gas prices had “rallied over the past two days based on forecasts of colder weather anticipated in January”.
“In addition to more frosty weather arriving after the Christmas holiday, natural gas storage also proved more robust as of December 13. The latest storage number showed a net decrease in storage of 125 billion cubic feet compared to the previous week,” he added.
“Stocks at 3,622 billion cubic feet remain 20 billion cubic feet higher than last year and 123 billion cubic feet higher than the five year average,” he went on to state.
To contact the author, email andreas.exarheas@rigzone.com
Silver price (XAG/USD) trades cautiously near Friday’s low around $29.50 in thin volume conditions before New Year on Monday. The white metal is broadly under pressure as the outlook of the US Dollar (USD) remains firm on expectations that a moderate policy-easing cycle by the Federal Reserve (Fed) in 2025 will keep US Treasury yields elevated.
10-year US Treasury yields are down 0.5% in Monday’s European session but are still almost 15% higher this calendar year near 4.60%.
The US Dollar Index (DXY), which tracks the Greenback’s value against six major currencies, ticks lower but remains broadly sideways around 108.00.
Market speculation for the Fed to follow a slower rate-cut path next year stemmed from the central bank’s latest dot plot, which showed that policymakers collectively see the Federal fund rate heading to 3.9% by the end of 2025.
Fed policymakers shifted their stance on interest rates from ‘dovish’ to ‘cautious’ as they were upbeat about the United States’ (US) economic growth. Additionally, a slowdown in the disinflation process in the last few months forced them to guide fewer rate cuts for the next year.
This week, investors will focus on the US ISM Manufacturing PMI data for December, which will be released on Friday. The Manufacturing PMI is estimated to have come in at 48.3, slightly lower than 48.4, which suggests that manufacturing output contracted at a slightly faster pace.
Silver price stays below the upward-sloping trendline after a breakdown near $30.00, which is plotted from the February 29 low of $22.30 on a daily timeframe,. The white metal wobbles around the 200-day Exponential Moving Average (EMA), suggesting that the longer-term outlook is uncertain.
The 14-day Relative Strength Index (RSI) falls inside the 20.00-40.00. A fresh bearish momentum would trigger if it sustains in that range.
Looking down, the September low of $27.75 would act as key support for the Silver price. On the upside, the 50-day EMA around $30.90 would be the barrier.
Silver is a precious metal highly traded among investors. It has been historically used as a store of value and a medium of exchange. Although less popular than Gold, traders may turn to Silver to diversify their investment portfolio, for its intrinsic value or as a potential hedge during high-inflation periods. Investors can buy physical Silver, in coins or in bars, or trade it through vehicles such as Exchange Traded Funds, which track its price on international markets.
Silver prices can move due to a wide range of factors. Geopolitical instability or fears of a deep recession can make Silver price escalate due to its safe-haven status, although to a lesser extent than Gold’s. As a yieldless asset, Silver tends to rise with lower interest rates. Its moves also depend on how the US Dollar (USD) behaves as the asset is priced in dollars (XAG/USD). A strong Dollar tends to keep the price of Silver at bay, whereas a weaker Dollar is likely to propel prices up. Other factors such as investment demand, mining supply – Silver is much more abundant than Gold – and recycling rates can also affect prices.
Silver is widely used in industry, particularly in sectors such as electronics or solar energy, as it has one of the highest electric conductivity of all metals – more than Copper and Gold. A surge in demand can increase prices, while a decline tends to lower them. Dynamics in the US, Chinese and Indian economies can also contribute to price swings: for the US and particularly China, their big industrial sectors use Silver in various processes; in India, consumers’ demand for the precious metal for jewellery also plays a key role in setting prices.
Silver prices tend to follow Gold’s moves. When Gold prices rise, Silver typically follows suit, as their status as safe-haven assets is similar. The Gold/Silver ratio, which shows the number of ounces of Silver needed to equal the value of one ounce of Gold, may help to determine the relative valuation between both metals. Some investors may consider a high ratio as an indicator that Silver is undervalued, or Gold is overvalued. On the contrary, a low ratio might suggest that Gold is undervalued relative to Silver.
Silver price (XAG/USD) recovers its recent losses from the previous session, trading around $29.50 per troy ounce during the Asian hours on Monday. However, trading volume is lighter than usual ahead of the New Year holiday.
The safe-haven Silver appreciates as traders anticipate signals regarding the United States (US) economy under the President-elect Trump administration and the Federal Reserve’s (Fed) interest rate outlook for 2025.
The potential for Donald Trump’s tariffs and trade policies could trigger trade conflicts, increasing the risk aversion sentiment and supporting the demand for safe-haven assets like Silver. However, the outlook for fewer Fed rate cuts in 2025 might cap the upside for the price of the non-yielding Silver. The Fed cut its benchmark interest rate by a quarter point at the December meeting, and the latest Dot Plots indicated two rate cuts next year.
The US Dollar Index (DXY), which measures the value of the US Dollar (USD) against its six major peers, hovers around 108.00, slightly below its highest level since November 2022. Any further strengthening of the Greenback could limit the upside of the dollar-denominated precious commodities like Silver, as a stronger USD makes these assets more expensive for holders of other currencies.
Additionally, the safe-haven demand for Silver could gain upward support from heightened geopolitical risks stemming from the prolonged Russia-Ukraine conflict and ongoing tensions in the Middle East. On Sunday, Israeli forces carried out attacks on two hospitals in northern Gaza, including a strike on the upper floor of al-Wafaa Hospital in Gaza City, which killed at least seven people and critically wounded others.
Silver is a precious metal highly traded among investors. It has been historically used as a store of value and a medium of exchange. Although less popular than Gold, traders may turn to Silver to diversify their investment portfolio, for its intrinsic value or as a potential hedge during high-inflation periods. Investors can buy physical Silver, in coins or in bars, or trade it through vehicles such as Exchange Traded Funds, which track its price on international markets.
Silver prices can move due to a wide range of factors. Geopolitical instability or fears of a deep recession can make Silver price escalate due to its safe-haven status, although to a lesser extent than Gold’s. As a yieldless asset, Silver tends to rise with lower interest rates. Its moves also depend on how the US Dollar (USD) behaves as the asset is priced in dollars (XAG/USD). A strong Dollar tends to keep the price of Silver at bay, whereas a weaker Dollar is likely to propel prices up. Other factors such as investment demand, mining supply – Silver is much more abundant than Gold – and recycling rates can also affect prices.
Silver is widely used in industry, particularly in sectors such as electronics or solar energy, as it has one of the highest electric conductivity of all metals – more than Copper and Gold. A surge in demand can increase prices, while a decline tends to lower them. Dynamics in the US, Chinese and Indian economies can also contribute to price swings: for the US and particularly China, their big industrial sectors use Silver in various processes; in India, consumers’ demand for the precious metal for jewellery also plays a key role in setting prices.
Silver prices tend to follow Gold’s moves. When Gold prices rise, Silver typically follows suit, as their status as safe-haven assets is similar. The Gold/Silver ratio, which shows the number of ounces of Silver needed to equal the value of one ounce of Gold, may help to determine the relative valuation between both metals. Some investors may consider a high ratio as an indicator that Silver is undervalued, or Gold is overvalued. On the contrary, a low ratio might suggest that Gold is undervalued relative to Silver.
Gold price (XAU/USD) attracts some buyers to around $2,625 during the early Asian session on Monday. Donald Trump’s tariffs and trade policies could trigger trade conflicts, supporting the yellow metal. However, the outlook for fewer Federal Reserve (Fed) rate cuts in 2025 might cap the upside for Gold price. Trading volume is lighter than usual ahead of the New Year holiday.
Donald Trump’s potential return to the White House might intensify global trade tensions, fueling geopolitical crises and likely lifting the Gold price. “Trade tensions, potential conflicts, and unpredictable policies under his leadership might drive investors toward gold as a safe-haven asset,” said the managing director of RiddiSiddhi Bullions Limited.
Additionally, the escalating geopolitical tensions in the Middle East and the ongoing Russia-Ukraine war could boost the Gold price, a traditional safe-haven asset. On Sunday, Israeli forces carried out attacks on two hospitals in northern Gaza, including a strike on the upper floor of al-Wafaa Hospital in Gaza City, which killed at least seven people and critically wounded others.
On the other hand, the rising expectations for fewer Fed rate cuts could underpin the Greenback and exert some selling pressure on the USD-denominated commodity price. A strengthening USD generally weighs on bullion, reducing its appeal to investors seeking non-yielding assets.
Gold has played a key role in human’s history as it has been widely used as a store of value and medium of exchange. Currently, apart from its shine and usage for jewelry, the precious metal is widely seen as a safe-haven asset, meaning that it is considered a good investment during turbulent times. Gold is also widely seen as a hedge against inflation and against depreciating currencies as it doesn’t rely on any specific issuer or government.
Central banks are the biggest Gold holders. In their aim to support their currencies in turbulent times, central banks tend to diversify their reserves and buy Gold to improve the perceived strength of the economy and the currency. High Gold reserves can be a source of trust for a country’s solvency. Central banks added 1,136 tonnes of Gold worth around $70 billion to their reserves in 2022, according to data from the World Gold Council. This is the highest yearly purchase since records began. Central banks from emerging economies such as China, India and Turkey are quickly increasing their Gold reserves.
Gold has an inverse correlation with the US Dollar and US Treasuries, which are both major reserve and safe-haven assets. When the Dollar depreciates, Gold tends to rise, enabling investors and central banks to diversify their assets in turbulent times. Gold is also inversely correlated with risk assets. A rally in the stock market tends to weaken Gold price, while sell-offs in riskier markets tend to favor the precious metal.
The price can move due to a wide range of factors. Geopolitical instability or fears of a deep recession can quickly make Gold price escalate due to its safe-haven status. As a yield-less asset, Gold tends to rise with lower interest rates, while higher cost of money usually weighs down on the yellow metal. Still, most moves depend on how the US Dollar (USD) behaves as the asset is priced in dollars (XAU/USD). A strong Dollar tends to keep the price of Gold controlled, whereas a weaker Dollar is likely to push Gold prices up.
Dutch Bros Inc. NYSE: BROS is a thriving drive-thru coffee shop operator and franchisor operating 950 shops across 18 states. While primarily focused on coffee drinks, they also offer teas, smoothies, protein and energy drinks. They prioritize speed and efficiency with an app-driven, drive-thru-focused operating model catering to the on-the-go lifestyles of their customers.
(As of 12/27/2024 05:45 PM ET)
▼
$56.10
The company reported 29% YoY revenue growth and 2.7% YoY same-store sales (SSS) growth in its third quarter of 2024. The most impressive statistic is the average unit volume (AUV) of $2 million in sales generated within the confines of 950 square feet, which is the average size per shop.
The retail/wholesale sector company competes with Starbucks Co. NASDAQ: SBUX and Luckin Coffee Inc. OTCMKTS: LKNCY. Starbucks had 40,199 stores (52% company-owned and 48% licensed) at the end of its fiscal Q4 2024, adding 722 net new stores. Dutch Bros plans to add 150 stores in 2024.
Like CAVA Group Inc. NYSE: CAVA, Dutch Bros also has a promote-from-within philosophy as they map out the 6 steps to working your way up to a regional operator from Broista. They have 400 operator candidates with an average tenure of more than seven years. Each person in the pipeline is ready to be activated as a market operator. Dutch Bros received over 400,000 applications annually for 11,000 open field positions.
Dutch Bros reported Q3 2024 EPS of 16 cents, beating consensus estimates by 4 cents. Revenue rose 27.9% YoY to $338.2 million, firmly beating $324.97 million consensus estimates. System same-shop sales (SSS) rose 2.7% YoY, and transactions rose 0.8% YoY. Company-operated SSS rose 4% YoY, and transactions grew 2.4%. Dutch Bros opened 38 news shops, including 33 company-operated across 11 states. Company-operated shop gross profit rose to $68.4 million, up from $57 million last year.
The Dutch Rewards loyalty program saw the largest number of sign-ups since its launch, with over 1 million thanks to the rollout of its mobile ordering, of which 858 shops have enabled. In Q3, over 67% of total transactions were from Dutch Rewards members. Mobile orders make up 7% of total revenue, leaving much room for growth.
| High Forecast | $65.00 |
|---|---|
| Average Forecast | $51.27 |
| Low Forecast | $36.00 |
For the full year 2024, Dutch Bros raised its revenue guidance to $1.255 billion to $1.260 billion, up from previous guidance of $1.215 billion to $1.230 billion, versus $1.23 billion consensus estimates. SSS growth is expected to be around 4.25% YoY, up from low single digits, and SSS growth for Q4 is expected to be between 1% and 2%. The total number of system shop openings in 2024 is expected to be around 150.
Dutch Bros sells a very limited number of food items. By limited, we mean four items to be exact: chocolate chip muffin tops, lemon poppyseed muffin tops, orange cranberry muffin tops and granola bars. Just as Starbucks instituted snacks and hot breakfast items to bolster their food sales, Dutch Bros has been experimenting with expanded bakery and sweet and savory hot food items in six shops in Q3. The initial response has been excellent, and the company is looking to roll out more food items in 2026.
Dutch Bros CEO Christine Barone commented, “Based on the early results, it is likely a more robust food venue will play a role for Dutch Bros in the future, and we will continue our testing in the coming quarters. With food making up less than 2% of our sales right now, we clearly see the opportunity.”
A pennant pattern is a combination of a flagpole representing a parabolic price surge and a symmetrical triangle pattern at the peak comprised of a descending upper trendline and an ascending lower trendline converging at the apex point. A breakout occurs when the stock surges above the upper trendline, and a breakdown occurs if the stock falls below the lower trendline.
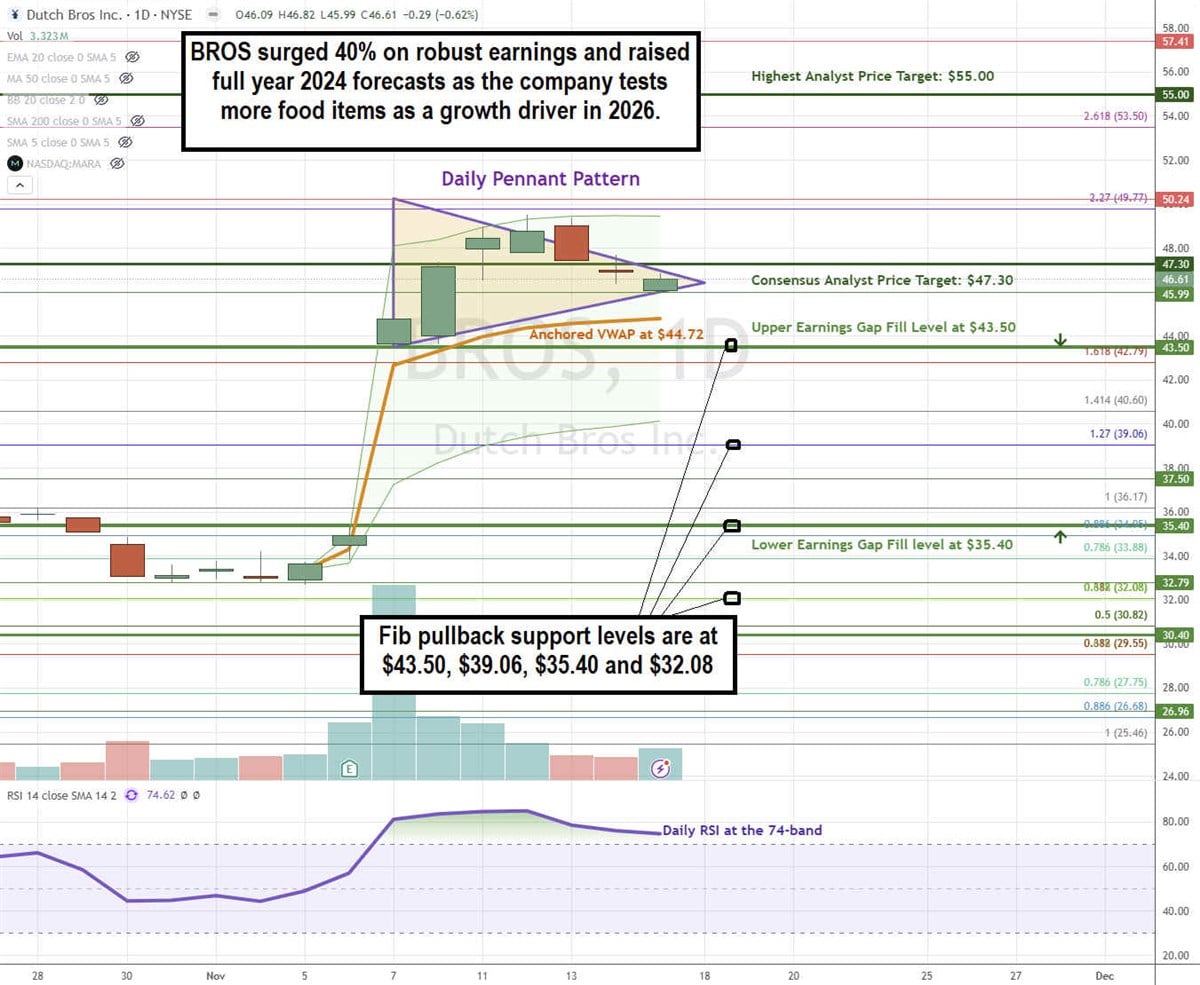
BROS formed the daily pennant after peaking at $50.24 following its Q3 earnings beat. The pennant is comprised of lower highs illustrated by the descending upper trendline and higher lows indicated by the ascending lower trendline. The daily anchored VWAP support is at $44.72. The daily RSI has been holding above the 70-band since the earnings price gap. Earnings price gap fill levels are at $43.50 and $35.40. Fibonacci (Fib) pullback support levels are at $43.50, $39.06, $35.40, and $32.08.
BROS’s average consensus price target is $47.30, implying a 1.4% upside and its highest analyst price target is $55.00. Eight analysts have Buy ratings, and three have Hold ratings on the stock. The stock has a 10.79% short interest.
Actionable Options Strategies: Bullish options investors can buy BROS stock on a deeper pullback using cash-secured puts at the gap fill and Fib pullback support levels.
Before you consider Dutch Bros, you’ll want to hear this.
MarketBeat keeps track of Wall Street’s top-rated and best performing research analysts and the stocks they recommend to their clients on a daily basis. MarketBeat has identified the five stocks that top analysts are quietly whispering to their clients to buy now before the broader market catches on… and Dutch Bros wasn’t on the list.
While Dutch Bros currently has a “Moderate Buy” rating among analysts, top-rated analysts believe these five stocks are better buys.

Just getting into the stock market? These 10 simple stocks can help beginning investors build long-term wealth without knowing options, technicals, or other advanced strategies.
Given that today’s low maintained the integrity of the uptrend relative to the trend line, it could be the completion of a pullback that is followed by strength. But what makes it interesting is that a drop below today’s low would question the integrity of the uptrend price structure as the trendline would be broken. Potential support around the 20-Day MA would already be broken prior to the trendline being reached. So, the bullish thesis would be proven wrong if there was a drop below today’s low.
A decisive decline below today’s low of 3.29 puts the recent interim swing low at 3.09 and the swing low at 2.98 (C, red) in view of being tested as support. Significantly, potential support around the 50-Day MA is also around the prior low, at 3.02. Together, a potentially significant support zone from 3.09 to 2.98 is identified.
Take note that the breakout from a symmetrical triangle pattern triggered above the 3.02 swing high. A test of that price area as support would be the second test following the triangle breakout and would follow the initial pullback to 2.98. Nonetheless, price behavior will lead the way forward by how it behaves around key price levels.
The next sign of strength would be with a rally above today’s high of 3.45. That would put natural gas back above the 20-Day prior support line and in place to track higher. Initial resistance may be seen around the prior highs of 3.55 or the 2023 high of 3.64.
A long-term bullish signal was triggered only recently in natural gas as it broke out above the top of the triangle pattern at 3.02 on November 20. That advance also triggered a continuation of the rising trend that began from the February trend low. The subsequent rise above the 2023 peak provided additional evidence for the bulls as that rise initiated a longer bullish trend reversal signal.
For a look at all of today’s economic events, check out our economic calendar.
Silver price (XAG/USD) falls to near $29.60 in a thin trading volume session following holidays on Christmas and Boxing Day on Friday. The white metal is under pressure even though tensions in the Middle East region between Israel and Iran have escalated.
On Thursday, Israel launched missiles at the Iran-backed Houthis military and bombed Yemini airport. After the air assault, Israeli Prime Minister Benjamin Netanyahu said in an interview with an Israeli TV station of the Houthis, “We are just getting started with them”. Israel retaliated to last week’s air assault by Iran.
Historically, heightened geopolitical tensions improve the demand for safe-haven assets, such as Silver.
Meanwhile, the US Dollar Index (DXY), which tracks the Greenback’s value against six major currencies, oscillates in a tight range above the key support of 108.00. 10-year US Treasury yields rise to near 4.61%. Higher yields on interest-bearing assets elevate the opportunity cost of non-yielding assets, making them an expensive bet for investors.
US bond yields remain firm on expectations that the Federal Reserve (Fed) will deliver fewer interest rate cuts in 2025. The Fed is expected to slow down the policy-easing cycle amid confidence in the United States (US) economic outlook.
Silver price stays below the upward-sloping trendline, plotted from the February 29 low of $22.30 on a daily timeframe, after a breakdown near $30.00. The white metal wobbles around the 200-day Exponential Moving Average (EMA), suggesting that the longer-term outlook is uncertain.
The 14-day Relative Strength Index (RSI) rebounds to near 40.00. A fresh bearish momentum would trigger if it fails to break above that level.
Looking down, the September low of $27.75 would act as key support for the Silver price. On the upside, the 50-day EMA around $30.90 would be the barrier.
Silver is a precious metal highly traded among investors. It has been historically used as a store of value and a medium of exchange. Although less popular than Gold, traders may turn to Silver to diversify their investment portfolio, for its intrinsic value or as a potential hedge during high-inflation periods. Investors can buy physical Silver, in coins or in bars, or trade it through vehicles such as Exchange Traded Funds, which track its price on international markets.
Silver prices can move due to a wide range of factors. Geopolitical instability or fears of a deep recession can make Silver price escalate due to its safe-haven status, although to a lesser extent than Gold’s. As a yieldless asset, Silver tends to rise with lower interest rates. Its moves also depend on how the US Dollar (USD) behaves as the asset is priced in dollars (XAG/USD). A strong Dollar tends to keep the price of Silver at bay, whereas a weaker Dollar is likely to propel prices up. Other factors such as investment demand, mining supply – Silver is much more abundant than Gold – and recycling rates can also affect prices.
Silver is widely used in industry, particularly in sectors such as electronics or solar energy, as it has one of the highest electric conductivity of all metals – more than Copper and Gold. A surge in demand can increase prices, while a decline tends to lower them. Dynamics in the US, Chinese and Indian economies can also contribute to price swings: for the US and particularly China, their big industrial sectors use Silver in various processes; in India, consumers’ demand for the precious metal for jewellery also plays a key role in setting prices.
Silver prices tend to follow Gold’s moves. When Gold prices rise, Silver typically follows suit, as their status as safe-haven assets is similar. The Gold/Silver ratio, which shows the number of ounces of Silver needed to equal the value of one ounce of Gold, may help to determine the relative valuation between both metals. Some investors may consider a high ratio as an indicator that Silver is undervalued, or Gold is overvalued. On the contrary, a low ratio might suggest that Gold is undervalued relative to Silver.
From a fundamental analysis standpoint, there are concerns about whether or not demand will be strong enough to warrant higher pricing, but I do think eventually demand does pick up. Keep in mind that the central banks around the world continue to loosen monetary policy, and eventually that should have some type of influence on business expenditures. If the economy starts moving again, the first place that you see benefit from it typically will be the crude oil markets, as energy of course is necessary for the economy to get going, especially when you’re talking about international trade.

The technical analysis for this crude oil market is fairly neutral at the moment, but it is worth noting that we are hanging around the crucial 50 Day EMA. The $72.50 level above is a significant amount of resistance and breaking above that would obviously be a major victory for the bulls. The 200 Day EMA sits just above there, and I do think that is going to be a bit of an issue. On the other hand, to the downside we have plenty of support near the $67 level, and then again at the $65 level. When you look at the longer-term charts, the $65 level is a major support level going back at least a couple of years. This suggests to me that perhaps we are getting close to bottoming completely, and now we are just waiting for some type of fundamental reason to continue going higher. I think we get that sooner or later, but again, I think this is probably a story for 2025.
In the meantime, I think a lot of traders are just simply buying the dips and taking advantage of “cheap barrels of oil” anytime they get the opportunity. However, I don’t know that many people out there are confident enough to hang onto their long positions, and that might be part of what we are seeing play out on the charts.
Ready to trade the daily crude oil Forex forecast? Here’s a list of some of the best Oil trading platforms to check out.
Natural gas rallied to a new trend high of 4.01 on Thursday and generated another sequential higher daily high and higher low, the sixth day in a row. At the time of this writing, it continues to trade near the lows of the day, which was 3.67.
That is short-term support and if it is broken to the downside a drop to test support around the prior trend high of 3.56 is likely or a test of the 20-Day MA, currently at 3.37. The 20-Day line is a key dynamic support indicator for the near-term bull trend as it was tested and held as support on several days since the October swing low (red). That trend is marked by a rising ABCD pattern (red).
If natural gas can retain a position above the 20-Day line, it has a chance to continue higher as the uptrend lower boundary would be retained. It is interesting to notice that there are several rising trendlines that cross above current price levels at approximately 4.39 and 4.45.
Those levels are within a potential resistance zone that begins around 4.33 to 4.42. That price level is the initial target from the red ABCD pattern shown on the chart. The crossovers also show possible resistance around the price zone. Therefore, it makes sense to expand the target zone to 4.33 to 4.45.
Notice that natural gas could continue to advance higher and stay within the top channel line and internal rising trend line. Together, they generate a potential rising wedge pattern. One possibility to consider is that natural gas could proceed and stay within the boundaries of the pattern to eventually reach the 4.33 target without breaking through either boundary line of the wedge.
For a look at all of today’s economic events, check out our economic calendar.


")
