The main tag of Gold Today Price Articles.
You can use the search box below to find what you need.
[wd_asp id=1]
The main tag of Gold Today Price Articles.
You can use the search box below to find what you need.
[wd_asp id=1]
Silver Price Forecast: XAG/USD Bulls Target Breakout Above $63.30 Resistance
Silver (XAG/USD) is pressing against a key resistance zone near $63.30 as of this analysis, with buyers showing renewed conviction to push the precious metal to fresh highs. The ongoing challenge of this level suggests a potential breakout, though traders remain cautious ahead of broader market catalysts.
The $63.30 area has emerged as a critical technical barrier for silver, representing a confluence of prior swing highs and psychological round-number resistance. Bulls have repeatedly tested this zone over the past sessions, but each attempt has met with selling pressure. A decisive close above this level could open the door to the next upside targets, while repeated failures may signal a period of consolidation.
From a technical perspective, the recent price action shows higher lows on the intraday charts, indicating that buyers are stepping in at higher levels. This pattern, combined with positive momentum indicators, suggests that the path of least resistance is to the upside. However, volume and volatility remain key factors to watch, as a breakout without sufficient participation could prove false.
Silver’s strength is being supported by a combination of factors, including a softer U.S. dollar, rising industrial demand, and shifting expectations around global monetary policy. As of mid-2025, the Federal Reserve’s stance on interest rates has become a major driver for precious metals, with any hint of easing typically boosting non-yielding assets like silver.
Additionally, silver’s dual role as both a precious and industrial metal has made it a beneficiary of the global push toward green technologies. Solar panels, electric vehicles, and 5G infrastructure all rely heavily on silver, creating a structural demand backdrop that continues to attract long-term investors.
If silver manages to close above $63.30 on a daily basis, the next resistance levels to watch would be around $65.00 and then the psychological $70.00 mark. Traders often use such breakouts to enter long positions, with stop-loss orders placed below the breakout level to manage risk. Conversely, a failure to break higher could lead to a pullback toward the $60.00 support zone, where buyers may find renewed interest.
Silver is at a pivotal juncture, with the $63.30 resistance level acting as the focal point for bulls and bears alike. While the technical setup favors an eventual breakout, traders should remain vigilant about external factors such as U.S. economic data and geopolitical developments that could influence the metal’s direction. A confirmed breakout would likely attract additional momentum buying, while a rejection could prompt a near-term correction.
Q1: What is the current silver price forecast?
As of this analysis, silver (XAG/USD) is testing resistance at $63.30. If bulls break above this level, the next targets are $65.00 and $70.00. Failure to break could lead to a pullback toward $60.00.
Q2: Why is silver rallying?
Silver is benefiting from a weaker U.S. dollar, strong industrial demand (especially from green technologies), and expectations of potential Fed rate cuts, which make precious metals more attractive.
Q3: What are the key resistance and support levels for silver?
Key resistance is at $63.30, followed by $65.00 and $70.00. On the downside, support is seen at $60.00, with additional support near $58.00.
This post Silver Price Forecast: XAG/USD Bulls Target Breakout Above $63.30 Resistance first appeared on BitcoinWorld.
Crude oil price jumped for the third consecutive day, with Brent hitting a high of $83.75, up by 7.30% from its lowest level this week. This rebound happened after China boosted its oil purchases and after Iran published details of the Strait of Hormuz reopening.
China boosts oil purchases
One reason why crude oil prices have not surged during the US-Iran war is that China has largely stayed away from the market.
Now, however, there are signs that Beijing is starting to buy oil again as its strategic petroleum reserves falls. Data released today showed that pipeline and seaborne flows jumped to 35.73 million tons in July, up by 22% from a month earlier.
It imported about 8.45 million barrels of crude oil per day. While this is much lower than it used to import before the war, there is a possibility that Beijing will increase its purchases later this year.
Such a move will lead to more oil demand as the country rushes to fill its strategic petroleum reserves. This is important because China is the biggest importers of crude oil in the world.
Iran shares details of its deal with Oman
Crude oil price is also rising as investors react to the details of the Iran-Oman deal to reopen the Strait of Hormuz. One notable part of the deal is that the two sides will not charge a toll for now.
However, Iran will control inbound traffic, while Oman will control the outbound one. As part of the agreement, Iran has insisted that it will not allow U.S and Israeli ships from transiting the strait. Also, countries that have harmed Iran will not be allowed to pass through the Strait until a compensation plan is made. Iran plans to impose a 20% fee for these countries.
It is unclear whether the Trump administration will endorse the deal. Also, it is unclear whether Trump will end the blockade it has placed on Iran. What is clear, however, is that the Strait of Hormuz will not go back to how it used to be in the future.
In the long-term, countries like Saudi Arabia and the UAE will invest heavily on pipelines to avoid the Strait. Indeed, the UAE has said that it will be independent of the Strait in the coming years.
Meanwhile, Houthis have continued to attack Saudi Arabian ships and troops. They attacked a Saudi tanker in the Red Sea, off the coast from the Yanbu export terminal. An escalation could have an impact on oil prices.
Most notably, the US and Iran have not yet reached a ceasefire agreement, meaning that the war may resume at any time. Iran may also use the latest reports on US weapons to restart the war and put more pressure on Trump. https://twitter.com/mb_ghalibaf/status/2085433285602136467
Brent crude oil price forecast
Crude oil price chart | Source: TradingView
The daily chart shows that Brent crude price peaked at $101.9 in July and then plunged to a low of $78.30 as Trump and Iran restarted their war. Recently, it bounced back to $83.70, which coincides with the 50-day Exponential Moving Average (EMA).
The price has moved above the Ultimate Support of the Murrey Math Lines level of $75. Therefore, the price will likely continue rising in the near term, potentially to the Major S/R pivot point of $100. A drop below the support of $78 will invalidate the bullish outlook.
Gold Price Forecast: XAU/USD Extends Rally, Bulls Set Sights on $4,380
Gold prices extended their upward move on Thursday, with XAU/USD trading firmer as bulls target the $4,380 area, according to the latest technical outlook. The precious metal has shown resilience amid mixed economic signals, and market participants are closely watching key resistance levels.
The current rally in gold is underpinned by a combination of factors, including persistent geopolitical uncertainties, central bank buying, and expectations of a more accommodative monetary policy stance from major central banks. As of this week, spot gold has gained momentum, breaking above previous consolidation ranges. Traders are now focusing on whether the bulls can sustain the push toward the $4,380 level, which represents a significant psychological and technical barrier.
From a technical perspective, the daily chart shows that gold has formed a series of higher lows, indicating strong buying interest on dips. The Relative Strength Index (RSI) remains in bullish territory but is not yet overbought, suggesting room for further upside. A clear break above the $4,380 area could open the door for a test of the next resistance zone, while failure to do so might lead to a short-term pullback toward support levels.
The broader market context remains supportive for gold, as real yields stay low and inflation concerns persist in several economies. Additionally, central banks, particularly in emerging markets, have been diversifying their reserves into gold, providing a solid demand base. This backdrop has attracted both institutional and retail investors looking for a safe-haven asset amid volatility in equity markets and currency fluctuations.
For traders, the key levels to watch are the immediate support at $4,300, followed by the $4,250 zone, which could act as a buffer in case of a correction. On the upside, a sustained move above $4,380 would confirm the bullish momentum and could lead to accelerated buying, potentially pushing prices toward the $4,420–$4,450 region. However, market participants should remain cautious, as any unexpected economic data or policy shift could quickly alter the outlook.
Understanding the gold price forecast is crucial for investors who use gold as a hedge against inflation or currency depreciation. The current rally reflects a broader trend of risk aversion and portfolio diversification. If gold breaks above $4,380, it could signal further gains, making it an opportune time for investors to review their positions. Conversely, a rejection at this level might suggest a consolidation phase, prompting a more cautious approach.
Gold’s rally continues to gain traction, with bulls eyeing the $4,380 level as the next major target. While the technical and fundamental backdrop remains supportive, traders should monitor key economic releases and geopolitical developments for potential volatility. A clear breakout above $4,380 could confirm the bullish trend, but until then, caution is advised.
Q1: What is the current gold price target?
The current upside target for XAU/USD is the $4,380 area, as per the latest technical analysis. This level represents a key resistance zone that bulls are aiming to break.
Q2: What factors are driving the gold rally?
The rally is driven by geopolitical uncertainties, central bank buying, and expectations of looser monetary policy. Low real yields and inflation concerns also support gold’s appeal as a safe-haven asset.
Q3: What happens if gold fails to break $4,380?
If gold fails to break above $4,380, it could lead to a short-term pullback toward support levels at $4,300 or $4,250. Traders may then look for a consolidation pattern before the next directional move.
This post Gold Price Forecast: XAU/USD Extends Rally, Bulls Set Sights on $4,380 first appeared on BitcoinWorld.
For now, the 100-day moving average presents key resistance that could lead to a pullback or consolidation. However, the next higher target is defined by the 200-day moving average, now near $4,496. It represents a more significant resistance zone given its long-term timeframe and therefore may be tested before the current advance reaches its conclusion. The path toward that higher target, however, may depend on how gold responds to the initial resistance near $4,392.
Friday’s extension of the rally confirmed a recovery above the long-term uptrend line that had shown signs of resistance over the past couple of days. A recovery above the trendline is another piece of bullish technical evidence for gold. It follows the recent reclaim of the 20-day and 50-day moving averages, a breakout above a downtrend line, and a trend reversal signal on a move above the lower swing high at $4,203. Together, these developments strengthen the case that the broader trend has shifted back in favor of the bulls.
Near-term support is Friday’s low of $4,230, especially since it aligns closely near the uptrend line, followed by the lower swing high at $4,203. Key dynamic support is indicated by the 50-day moving average near $4,152. The magnitude of any pullback will assist in gauging demand, and it may determine whether the 200-day moving average is tested, if it doesn’t occur during this initial sharp advance.
Thus, Friday’s strong close not only reinforces the recent bullish reversal but also sets up the next test: whether buyers can push through the $4,382-$4,392 resistance zone without a meaningful pullback, keeping the higher $4,496 target in view.
Silver price surges nearly 3% as it clears the 50-day Simple Moving Average (SMA) at $62.13, and reclaims the $63.00 figure as it struggles to surpass key resistance seen at $63.28, the July 6 high.
Silver trades sideways, but bulls are gaining traction, as indicated by the Relative Strength Index (RSI). The RSI crossed above its 50-neutral level, poised to hit the overbought 70 level, rather sooner than later.
This suggests that the white metal could test higher prices, once it crosses the $65.00 mark. A breach of the latter will expose the 100-day SMA at $68.98, before testing the psychological $70.00 mark. Once cleared, the 200-day SMA becomes the next ceiling level at $71.22.
If XAG/USD retreats below the $63.00, a retracement towards the 50-day SMA is on the cards. On further weakness, Silver could fall towards the $60.00 mark, followed by the August 3 low of $56.57.
Silver is a precious metal highly traded among investors. It has been historically used as a store of value and a medium of exchange. Although less popular than Gold, traders may turn to Silver to diversify their investment portfolio, for its intrinsic value or as a potential hedge during high-inflation periods. Investors can buy physical Silver, in coins or in bars, or trade it through vehicles such as Exchange Traded Funds, which track its price on international markets.
Silver prices can move due to a wide range of factors. Geopolitical instability or fears of a deep recession can make Silver price escalate due to its safe-haven status, although to a lesser extent than Gold’s. As a yieldless asset, Silver tends to rise with lower interest rates. Its moves also depend on how the US Dollar (USD) behaves as the asset is priced in dollars (XAG/USD). A strong Dollar tends to keep the price of Silver at bay, whereas a weaker Dollar is likely to propel prices up. Other factors such as investment demand, mining supply – Silver is much more abundant than Gold – and recycling rates can also affect prices.
Silver is widely used in industry, particularly in sectors such as electronics or solar energy, as it has one of the highest electric conductivity of all metals – more than Copper and Gold. A surge in demand can increase prices, while a decline tends to lower them. Dynamics in the US, Chinese and Indian economies can also contribute to price swings: for the US and particularly China, their big industrial sectors use Silver in various processes; in India, consumers’ demand for the precious metal for jewellery also plays a key role in setting prices.
Silver prices tend to follow Gold’s moves. When Gold prices rise, Silver typically follows suit, as their status as safe-haven assets is similar. The Gold/Silver ratio, which shows the number of ounces of Silver needed to equal the value of one ounce of Gold, may help to determine the relative valuation between both metals. Some investors may consider a high ratio as an indicator that Silver is undervalued, or Gold is overvalued. On the contrary, a low ratio might suggest that Gold is undervalued relative to Silver.
At 5:20 a.m. Eastern Time today, oil was priced at $86.04 per barrel with Brent serving as the benchmark (we’ll explain different benchmarks later in this article). That’s a gain of $2.40 compared with yesterday morning and around $19 higher than the price one year ago.
It’s impossible to forecast oil prices with detailed precision. Many different elements affect the market, but ultimately it boils down to supply and demand. When worries about economic recession, war, and other large-scale disruptions increase, oil’s path can shift fast.
Gas prices at the pump don’t only track crude oil. They also include what it takes to refine and move that fuel, the taxes layered on top, and the extra markup your local station adds to stay in business.
Since crude oil generally makes up a majority of the per-gallon cost, changes in its price have an outsized impact. When oil surges, gas prices typically rise in tandem. But when oil retreats, gas prices often lag on the way down, a trend sometimes described as “rockets and feathers.”
In case of emergency, the U.S. has a store of crude oil known as the Strategic Petroleum Reserve. Its primary purpose is energy security in case of disaster (think sanctions, severe storm damage, even war). But it can also go a long way toward softening crippling price hikes during supply shocks.
It’s not a long-term answer and is more meant to provide temporary relief, assisting consumers and keeping critical parts of the economy running, like key industries, emergency services, public transportation, etc.
Both oil and natural gas are key sources of the energy we use every day. Because of this, a big change in oil prices can affect natural gas. For example, if oil prices increase, some industries may swap natural gas for some segments of their operations where possible, which increases demand for natural gas.
To gauge oil’s performance, we often turn to two benchmarks:
Between these two, Brent better represents global oil performance because it prices much of the world’s traded crude. And, it’s often the best way to track historical oil performance. In fact, even the U.S. Energy Information Administration now uses Brent as its primary reference in its Annual Energy Outlook.
Looking at the Brent benchmark across several decades, oil has been anything but steady. It’s seen spikes due to factors such as wars and supply cuts, and it’s also seen crashes from global recessions and an oversupply (called a “glut”). For example:
All to say, oil’s historical performance has been anything but smooth. Again, it’s hugely affected by wars, recessions, OPEC whims, evolving energy initiatives and policies, and much more.
Looking to stay up-to-date regarding the latest energy developments? Check out our recent coverage:
The current price of oil per barrel depends largely on supply and demand, including news about potential future supply and demand (geopolitics, decisions made by OPEC+, etc.). In the U.S., prices also move based on how friendly an administration is to drilling, as it can affect future supply. For example, 2025 saw the Trump administration move to reopen more than 1.5 million acres in the Coastal Plain of the Arctic National Wildlife Refuge for oil and gas leasing, reversing the Biden administration’s policy of limiting oil drilling in the Arctic.
The price of oil updates constantly when the “futures” markets are open. A futures market is effectively an auction where people agree to buy or sell oil in the future. As long as people and companies are trading contracts, the oil price is changing.
In short, shale is rock that contains oil and natural gas. Think of shale as energy yet to be tapped. The more shale the U.S. accesses, the more energy we’ll have—and the more easily oil prices can keep from spiking as much thanks to a greater supply.
When oil is expensive, it tends to make everyday items cost more. This can be related to energy (your heating, gas utilities, etc.), but it’s also due to the logistics involved with making those items accessible to you. Shipping, for example, can affect the price of things at the grocery store, as it’s more expensive to get those products from warehouses and farms onto the shelf.
The article covers the following subjects:
Consider long positions from corrections above 67.00 with a target of 105.17–115.50.
Breakout and consolidation below 67.00 will allow the asset to continue declining to the levels of 58.50–50.00.
A descending correction (2) appears to have formed on the weekly chart, with wave C of (2) completed as its part. On the daily time frame, an ascending wave (3) is likely developing. Within it, the first wave of smaller degree 1 of (3) has formed, a downward correction 2 of (3) has been completed, and wave 3 of (3) has started forming. Wave i of 3 is still developing on the H4 chart, with a local correction (ii) of i completed as part of its structure. If the presumption is correct, WTI will continue to rise to 105.17–115.50 in wave (iii) of i. The level of 67.00 is critical in this scenario as a breakout below it will enable the asset to continue declining to the levels of 58.50–50.00.
This forecast is based on the Elliott Wave Theory. When developing trading strategies, it is essential to consider fundamental factors, as the market situation can change at any time.
The content of this article reflects the author’s opinion and does not necessarily reflect the official position of LiteFinance broker. The material published on this page is provided for informational purposes only and should not be considered as the provision of investment advice for the purposes of Directive 2014/65/EU.
According to copyright law, this article is considered intellectual property, which includes a prohibition on copying and distributing it without consent.
As summer enters its final stretch, the U.S. natural gas market remains well supplied despite higher year-over-year demand trends. According to preliminary data from Rystad Energy, total natural gas demand, including exports, of more than 118 Bcf per day through July is running 2.5 percent above the same period in 2025. Growth has been driven by LNG feedgas deliveries and higher power sector consumption despite flagging industrial and residential/commercial demand signals. On the supply side, dry gas production for the year so far has averaged 111.1 Bcf per day, 4.3 percent higher than year-ago levels, and underground storage inventories remain nearly 7 percent above the five-year average.
Looking ahead, 2026 average annual daily production is expected to rise 4.7 percent over 2025 levels, according to recent forecasts from Rystad Energy. Despite an expected increase in total natural gas demand of nearly 3 percent year over year, Rystad Energy lowered its price forecast in the July North America Gas Market Report (July Market Report). The current forecast now expects Henry Hub prices to average $3.31 per MMBtu in 2026, down 6.2 percent from the June forecast, on a looser market and bearish market fundamentals.
Natural gas prices declined in July amid record production and softer LNG feedgas demand. Henry Hub futures prices fell nearly 15 percent for the month, from $3.22 per MMBtu on July 1 to $2.75 per MMBtu on July 31. In the day-ahead spot market, Henry Hub prices followed a similar trend, declining 22.7 percent from $3.35 per MMBtu on July 1 to $2.59 per MMBtu on July 31, according to data from Argus Media.
Average day-ahead spot prices fell to discounted levels in most regions relative to Henry Hub during July as regional supply and demand dynamics influenced local pricing (all in $/MMBtu):
Most regional indexes averaged below Henry Hub during July. Regional average price differentials ranged from nearly flat in Louisiana/Southeast and the Northeast, to discounts greater than $0.70 per MMBtu in the Rockies/Northwest, Southwest, and Appalachia.
Both spot prices and futures at Henry Hub have remained below $3 in August to date, reinforcing recent bearish trends. As of August 5, prices settled at $2.69 per MMBtu in the day-ahead spot market and $2.60 per MMBtu in the futures market.
The U.S. experienced a two-week decline in temperatures through the end of July, even as conditions remained above the 30-year normal. For the week ending August 1, temperatures were 6.7 percent cooler than the same week last year but 10.7 percent warmer than the 30-year normal, according to cooling degree days (CDDs) weighted by electric home air conditioning customers. Regionally, CDD data were mixed, with four regions – the West North Central, West South Central, Mountain, and Pacific – running warmer than last year. All but three regions – the Middle Atlantic, East North Central, and New England – were warmer than normal. Despite the late-month moderation, July finished 1.1 percent warmer than last year and 18.4 percent warmer than normal.
The National Oceanic and Atmospheric Administration’s (NOAA) 8–14-day temperature outlook for August 13–19 favors above-normal temperatures across much of the continental U.S., Alaska, and Hawaii. The highest probabilities are expected across the South and Midwest, where chances exceed 60 percent in portions of the Gulf Coast states, Oklahoma, and Arkansas. Near- and below-normal temperatures are favored across the Northeast and portions of the northern tier. At the time of writing, NOAA’s National Hurricane Center is monitoring two disturbances in the Pacific, each with a less than 40 percent chance of cyclone formation in the next seven days. No tropical cyclone activity is expected in the next seven days in the Atlantic.
Total natural gas demand, including exports, averaged 113.8 Bcf per day in July, rising 2.8 percent above the previous record for the month set in July 2025, according to preliminary data from Rystad Energy. Growth was driven primarily by higher export demand, with LNG feedgas and pipeline exports to Mexico increasing 7.8 percent year-over-year. Domestic demand also increased, supported by record electric power consumption and higher industrial natural gas demand. Preliminary data from Rystad shows that electric power demand averaged 49.6 Bcf per day in July, which would be a new monthly record for the sector, while industrial consumption rose 3.2 percent year-over-year. Residential and commercial demand declined year-over-year, averaging 3.3 Bcf per day in July.
Month-over-month trends were more mixed. LNG exports averaged 15.8 Bcf per day in July, declining 1.2 percent from June due to the ongoing Freeport LNG outage and slower-than-expected Golden Pass LNG ramp-up. However, total export demand still increased 2.0 percent month-over-month, supported by a 10.4 percent increase in pipeline exports to Mexico amid strong cooling demand.
Dry natural gas production averaged 112.2 Bcf per day in July, up 3.9 percent from July 2025 and marking a record high for the month, according to preliminary data from Rystad Energy. In its July Market Report, Rystad revised its forecast for 2026 exit-to-exit production growth to 2.8 Bcf per day, meaning production at year-end 2026 is expected to be 2.8 Bcf per day higher than at year-end 2025. This is up from the 2.4 Bcf per day increase projected in its June forecast. Production growth has been concentrated in the Haynesville Basin, where the company Citadel-backed Apex has accounted for more than 800 MMcf per day of growth so far in 2026. Looking ahead, Rystad expects exit-to-exit production growth to accelerate to 5.0 Bcf per day in 2027, supported by stronger LNG capacity additions and rising natural gas demand from AI data centers.
In July, LNG feedgas flows averaged 17.4 Bcf per day, declining 1.2 percent from June and remaining below early-year highs of nearly 19 Bcf per day, according to preliminary data from Rystad Energy. Rystad Energy’s July Market Report attributed the decline to another maintenance period at Freeport LNG, which began in early July and is expected to continue through the end of August. Flows have averaged approximately 0.7 Bcf per day below normal intake levels during the outage. Feedgas intake at Golden Pass LNG also remained below expected levels as the facility’s ramp-up progressed more slowly than anticipated. The combination of reduced LNG feedgas demand has contributed to additional supply availability in the domestic market, supporting downward pressure on natural gas prices.
According to Reuters, the July slowdown in U.S. LNG exports coincided with higher global natural gas prices. Preliminary data from financial firm LSEG indicate that exports declined by 0.1 million metric tons (MMT), from 10.6 MMT in June to 10.5 MMT in July. Over the same period, prices increased at key Asian and European trading hubs. Asia’s benchmark Japan Korea Marker averaged $19.10 per MMBtu in July, increasing 10.2 percent from June, while Europe’s Dutch Title Transfer Facility averaged $18.07 per MMBtu, up 37.0 percent from the June average. Europe remained the primary destination for U.S. LNG cargoes as buyers continued to replenish storage inventories ahead of the winter heating season. U.S. LNG shipments to Europe increased to 4.8 million metric tons (MMT) in July from 4.4 MMT in June, accounting for nearly half of total U.S. LNG exports.
In other LNG news:
The EIA reported a 33 Bcf net injection into underground storage for the week ending July 31, bringing lower 48 natural gas inventories to 3,117 Bcf. The weekly refill was driven by net injections of 24 Bcf and 20 Bcf in the East and Midwest, respectively, while other regions posted net withdrawals of up to 6 Bcf in the South Central. Working gas stocks now sit 6.7 percent above the five-year average but 0.4 percent below year-ago levels. Regional storage inventories remain in surplus territory relative to their respective five-year averages, while only the East and Midwest remain above year-ago levels.
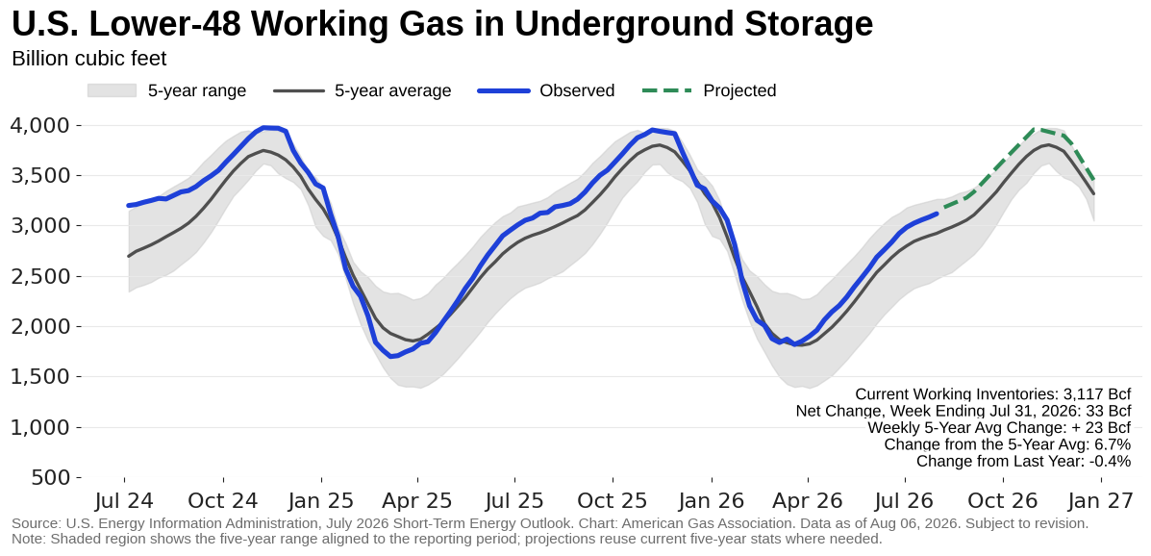
After adjusting for weather, July storage injections averaged 1.2 Bcf per day higher than normal, according to Rystad Energy’s July Market Report.
Cross-border pipeline flows showed mixed trends for the week ending August 5, according to preliminary data from Rystad Energy. Compared to last week, imports from Canada and exports to Mexico decreased, falling 2.1 percent and 5.0 percent, respectively. On a year-over-year basis, imports to Canada decreased by 8.1 percent while exports to Mexico rose 7.9 percent on higher cooling demand.
The EIA reports that the value of natural gas trade with Canada increased in 2025, as natural gas prices increased from 2024 all-time lows on an inflation adjusted basis. U.S. natural gas exports to Canada, made up primarily of pipeline exports, averaged 2.8 Bcf per day, up 4 percent year over year, and increased 77 percent in value to $2.6 billion. At the same time U.S. imports from Canada averaged 8.6 Bcf per day in 2025, 1 percent above 2024 levels, while the value of those imports increased by 52 percent.
U.S. drilling rig count increased by one for the week ending July 31, bringing the total count to 588, according to data from Baker Hughes. This increase was driven by oil-directed rigs, rising by one to 451, while natural gas-directed rigs and miscellaneous rigs remained unchanged at 127 and ten, respectively. Total U.S. rigs are up 48 from the same week last year, an increase of 8.9 percent. Natural gas-directed rigs increased by three for this period, a 2.4 percent increase, with oil rigs up 41, a 10 percent increase.
For questions please contact Juan Alvarado | jalvarado@aga.org, Liz Pardue | lpardue@aga.org, or Lauren Scott | lscott@aga.org
To be added to the distribution list for this report, please notify Lucy Castaneda-Land | lcastaneda-land@aga.org
Notice
In issuing and making this publication available, AGA is not undertaking to render professional or other services for or on behalf of any person or entity. Nor is AGA undertaking to perform any duty owed by any person or entity to someone else. Anyone using this document should rely on his or her own independent judgment or, as appropriate, seek the advice of a competent professional in determining the exercise of reasonable care in any given circumstances. The statements in this publication are for general information and represent an unaudited compilation of statistical information that could contain coding or processing errors. AGA makes no warranties, express or implied, nor representations about the accuracy of the information in the publication or its appropriateness for any given purpose or situation. This publication shall not be construed as including advice, guidance, or recommendations to take, or not to take, any actions or decisions regarding any matter, including, without limitation, relating to investments or the purchase or sale of any securities, shares or other assets of any kind. Should you take any such action or decision; you do so at your own risk. Information on the topics covered by this publication may be available from other sources, which the user may wish to consult for additional views or information not covered by this publication
Data Disclaimer Notice: S&P Global Energy
Reproduction of any information, data or material, including ratings (“Content”) in any form is prohibited except with the prior written permission of the relevant party. Such party, its affiliates and suppliers (“Content Providers”) do not guarantee the accuracy, adequacy, completeness, timeliness, or availability of any Content and are not responsible for any errors or omissions (negligent or otherwise), regardless of cause, or for the result obtained from the use of such Content. In no event shall Content Providers bed liable for any damages, costs, expenses, legal fees, or losses (including lost income or lost profit and opportunity costs) in connection with any use of the Content. A reference to a particular investment or security, a rating or any observation concerning an investment that is part of the Content is not a recommendation to buy, sell or hold such investment or security, does not address the suitability of an investment or security and should not be relied on as investment advice. Credit ratings are statements of opinions and are not statement of fact.
Copyright © 2026 American Gas Association. All rights reserved.Natural Gas Market Indicators – July 9, 2026
Every major industrial transition in modern history has been preceded by a period where the physical inputs required for that transition are systematically undervalued. The electrification of the twentieth century, the postwar manufacturing boom, the infrastructure buildout of emerging markets in the 2000s — each of these cycles began with commodities priced as mundane inputs and ended with them priced as strategic necessities. The question worth asking today is not whether copper is heading higher, but whether the magnitude of the move ahead has been genuinely absorbed by markets.
The answer, according to a growing number of commodity analysts and institutional market participants, appears to be no. The structural case for copper reaching extraordinary price levels over the next several years is not built on a single demand driver or a temporary supply shock. It is built on the convergence of multiple independent demand forces — AI infrastructure, energy transition electrification, and industrial reshoring — colliding simultaneously with a supply chain that requires a decade or more to meaningfully respond.
Understanding the scale of the copper price to $40,000 thesis requires grounding the conversation in current market data. As of May 2026, LME copper spot prices were tracking near $13,483 per tonne, according to FRED data series. The metal had already reached a record high of approximately $13,967 per tonne in January 2026, according to Reuters reporting at the time.
The $40,000 per tonne forecast, most prominently associated with commodities trader Pierre Andurand’s four-year projection framework, represents a fundamentally different price regime. To contextualise that number:
| Benchmark | Price | Context |
|---|---|---|
| LME Copper Spot (May 2026) | ~$13,483/tonne | FRED data series |
| LME Record High | ~$13,967/tonne | January 2026, Reuters |
| $40,000/tonne Target | ~$18.14/lb | Andurand four-year forecast |
| Implied Upside from Jan 2026 Record | ~+186% | If $40,000 target is reached |
A move of this magnitude would be classified, in commodity cycle terminology, as a classic boom-bust formation completing its final phase. It is precisely the kind of triple-digit percentage move that experienced commodity investors specifically watch for — and that, according to certain market participants, has not yet materialised for copper in the way it already has for gold and silver.
One market commentator with decades of experience tracking commodity cycles has noted that copper has not yet made the kind of explosive, parabolic move that characterises the final stage of a commodity supercycle. Gold and silver completed significant portions of that arc in recent years. Copper, by contrast, has been rising gradually — which from a contrarian, cycle-aware perspective, suggests the largest portion of the move may still lie ahead.
What distinguishes the current copper thesis from previous commodity bull narratives is that the demand drivers are not variations on a single theme. They are structurally independent, additive, and operating on different timescales. Furthermore, critical minerals demand across each of these sectors is accelerating simultaneously, compounding the pressure on available supply.
Renewable energy infrastructure is materially more copper-intensive per megawatt of generating capacity than fossil fuel systems. Wind turbines, solar installations, transmission upgrades, and battery storage infrastructure all require substantial copper at every layer. This is not a speculative demand driver — it is a function of physics and engineering.
This is the demand driver that most investors have been slowest to fully quantify. Physical AI infrastructure is copper-intensive at a scale that is easy to underestimate. Server farms, high-voltage cabling, power distribution systems, cooling infrastructure, and grid connections all consume copper in significant quantities.
One informed market perspective frames this dynamic clearly: America’s push to deploy AI at scale and compete with China’s technological ambitions represents an enormous capital demand that flows directly into copper-intensive physical infrastructure. Hyperscale computing companies are already absorbing disproportionate amounts of available capital in credit markets, which has a secondary effect of tightening liquidity for traditional industrial borrowers — a dynamic that constrains new supply development precisely when demand is accelerating.
The US-China industrial competition has moved beyond trade policy into a full-scale economic mobilisation. Rebuilding domestic manufacturing capacity, securing strategic supply chains, and developing the physical infrastructure required to compete at an industrial level all require significant copper inputs. This is an economy-of-war dynamic operating at a peacetime industrial scale. The base of the value pyramid — the raw material inputs that underpin everything from consumer electronics to defence systems — is being revalued from commodity-level pricing toward something closer to a strategic necessity.
The core insight here is that copper functions as an economic chokepoint. It is not merely an input — it is a bottleneck. And the scale of what is being built simultaneously across AI, energy, and reshoring means that bottleneck is tightening from multiple directions at once.
A critical distinction that often gets lost in copper market commentary is the difference between a supply shortage and a demand acceleration event. Current copper production and recycling volumes are substantial. There is not, at this moment, a dramatic shortfall in available copper. What is happening is something more structurally significant: an unprecedented acceleration in demand is colliding with a supply chain that simply cannot respond quickly enough.
Mine development timelines illustrate the problem precisely. The copper supply crunch stems not from a lack of geological resources, but from the structural inability of the industry to bring new capacity online quickly enough. Consequently:
This supply response lag is structural, not cyclical. It cannot be solved by a price signal alone, because even a dramatically higher copper price today would not produce meaningful new supply for most of this decade. The market is being asked to fund infrastructure-level demand growth using a supply chain that operates on geological timescales.
One of the more reliable indicators that institutional participants believe a commodity price move is imminent is large-scale merger and acquisition activity within that sector. Anglo American’s progression toward combining operations with Glencore in what would constitute a major copper mining entity is particularly instructive. When organisations of that scale are willing to restructure and take on the execution risk of a significant merger, it signals that the people with the deepest operational knowledge of the sector believe the upside justifies the risk.
Furthermore, majors and junior partnerships are increasingly forming as larger players seek to lock in future copper resources through strategic stakes in earlier-stage projects. This is not coincidental. Mining company executives and institutional shareholders with direct geological and operational visibility are making large bets on copper’s future price trajectory. That institutional behaviour is worth treating as a signal, not merely as background noise.
The intuitive response to a commodity bull thesis is to seek maximum leverage through small-cap explorers and junior developers. The logic appears straightforward: if copper triples, a small mining company with copper in the ground should multiply many times over. In practice, this reasoning consistently underestimates the structural risks that are specific to junior mining.
A principle that has been articulated by experienced commodity investors for generations holds that the fastest way to destroy value in mining is to start digging a hole. The Mark Twain observation that a mine is a hole in the ground with a liar at the top and a fool at the bottom remains more operationally relevant than most retail investors appreciate.
The specific failure modes in junior and mid-tier mining include:
Recognising management red flags early is therefore essential for anyone considering exposure through smaller operators, as the warning signs are often present long before the financial damage becomes apparent.
Margins not expanding despite rising spot prices is one of the clearest red flags available to investors in mining companies. If a company cannot convert a significant commodity price appreciation into proportional earnings growth, the question of where those economics are going deserves a direct answer.
The comparison table below illustrates the risk-adjusted tradeoffs across different copper investment vehicles:
| Investment Vehicle | Leverage to Copper Price | Key Risk Factors | Liquidity |
|---|---|---|---|
| Major diversified miners (BHP, Rio Tinto) | Moderate | Hedging, diversification dilutes exposure | High |
| Pure-play large-cap copper producers | High | Operational surprises, hedging disclosure | High |
| Mid-tier copper developers | Very High | Financing risk, execution risk | Moderate |
| Junior copper explorers | Extreme | Geological risk, management quality, dilution | Low |
| Copper ETFs / futures | Direct price exposure | Contango drag, no equity leverage | High |
Gold and silver have both undergone significant price appreciation over recent years, completing what experienced cycle observers describe as a classic boom-bust formation arc. The precious metals have reached levels where the incremental upside, while potentially real, is being measured in percentages rather than multiples.
Copper has not yet completed that formation. It has been rising, but without the parabolic blow-off phase that characterises the final stage of a commodity supercycle. For investors oriented toward return asymmetry, this is a materially different positioning opportunity.
The framing that some sophisticated market participants use is direct: achieving 25% annual returns through diversified, lower-risk positions is achievable without requiring significant commodity exposure. Choosing to take on commodity risk is only justified if the potential return is of a genuinely different order of magnitude. A triple-digit percentage move qualifies. An incremental 20-30% upside in a metal already trading near all-time highs does not, by that logic, justify the same level of conviction.
Understanding how different types of investors approach commodity markets helps explain why copper may still be underappreciated despite the structural case being relatively clear. Four distinct archetypes exist in resource markets:
The consistent insight from experienced commodity investors is that geological and quantitative analysis is the most durable edge available in this sector. Once an investor has been misled by a compelling narrative attached to a poor geological asset, the pattern recognition that develops from that experience is valuable. However, skilled promoters in junior mining are extraordinarily persuasive, and the stories rarely change — only the names of the projects and the people telling them do.
One underappreciated approach to capturing commodity exposure involves specifically seeking assets that are undervalued precisely because they are currently unfashionable. Large, well-capitalised commodity businesses trading at deep value multiples with reliable dividend yields present a fundamentally different risk profile than junior explorers with compelling narratives.
The contrarian logic is straightforward: when an asset is genuinely disliked by the market, the selling pressure has already been absorbed. When sentiment eventually turns — whether driven by earnings improvement, commodity price appreciation, or simply a rotation in market attention — the re-rating happens quickly and those who positioned early capture the majority of the move.
In addition, copper investment strategies that focus on contrarian value positioning rather than narrative-driven speculation tend to produce more consistent outcomes across commodity cycles. The commodity to watch is not the one generating the most headlines, but the one that has not yet attracted sufficient attention to have priced in the structural demand story quietly building beneath the surface.
The $40,000 per tonne forecast is based on the convergence of structural demand growth across AI infrastructure, energy transition electrification, and industrial reshoring, combined with a supply chain that requires 10 or more years to meaningfully expand capacity. It represents a scenario where demand acceleration significantly outpaces supply response over a multi-year period.
The $40,000 target is most prominently associated with commodities trader Pierre Andurand, who outlined a four-year forecast framework placing copper in a fundamentally different price regime driven by the demand dynamics described above.
Andurand’s framework operates on approximately a four-year timeline from the point of the forecast. This is consistent with the mine development lag that prevents new supply from responding quickly to price signals.
As of May 2026, LME copper spot was tracking near $13,483 per tonne. The January 2026 record high was approximately $13,967 per tonne.
The term shortage is somewhat misleading. Current production is substantial, and recycling adds meaningful volume. The more precise framing is that a supply tightening exists, and the primary driver of the bull thesis is a demand acceleration that the existing supply chain cannot match. The shortage, if it materialises, will be a future condition created by demand outpacing a structurally constrained supply response.
Large-cap pure-play copper producers carry the most direct earnings leverage to a sustained copper price increase. Diversified majors with significant copper operations also benefit, though the effect is diluted by other commodity exposures. Infrastructure and electrical equipment manufacturers would see input cost pressures, partially offsetting their operational tailwinds.
Options include large-cap copper producer equities, copper-focused ETFs, and commodity futures for sophisticated investors comfortable with contango dynamics. Each vehicle carries different risk-reward characteristics. Retail investors should conduct independent research and consider professional financial advice before taking positions in any commodity-linked investment. This article does not constitute financial advice.
The structural bull case for the copper price to $40,000 can be summarised concisely:
The commodity cycle framework that experienced investors have used for decades remains relevant: the time to establish meaningful exposure is before the parabolic phase, not during it. Once copper completes the boom-bust formation that gold and silver have already partly traced, the opportunity to position at current levels will have passed.
This article is intended for informational and educational purposes only. It does not constitute financial advice, investment recommendations, or an offer to buy or sell any financial product. Commodity markets are volatile and involve significant risk of loss. Past price cycles are not a reliable indicator of future outcomes. Readers should seek independent financial advice before making investment decisions.
Discovery Alert’s proprietary Discovery IQ model scans ASX announcements in real time, instantly identifying significant mineral discoveries — including copper — and translating complex geological data into actionable insights before the broader market has a chance to react. Explore historic examples of major discovery returns and begin your 14-day free trial at Discovery Alert to secure your market-leading edge.