The main tag of Gold Today Price Articles.
You can use the search box below to find what you need.
[wd_asp id=1]
The main tag of Gold Today Price Articles.
You can use the search box below to find what you need.
[wd_asp id=1]
Domestic coffee prices today
Coffee prices today in the domestic market turned down sharply after the previous increase session. According to giacaphe. com, the average coffee price on August 7 was 97,400 VND/kg, down 1,500 VND/kg compared to the previous day. The highest level in key regions of the Central Highlands was recorded at 97,500 VND/kg.
In Dak Lak, coffee prices were recorded at 97,300 VND/kg, down 1,500 VND/kg compared to the previous session.
In Lam Dong, coffee price today reached 96,800 VND/kg, down 1,500 VND/kg.
In Gia Lai, coffee prices are at 97,300 VND/kg, down 1,500 VND/kg compared to the previous day.
The old Dak Nong area recorded a level of 97,500 VND/kg, down 1,500 VND/kg.
After the increase brought prices close to 99,000 VND/kg, the domestic coffee price level has receded deeply to the 97,000 VND/kg zone. The decrease range of 1,500 VND/kg caused domestic prices to lose most of the increase of the previous session.
World coffee prices
In the world market, coffee prices fell on both the London and New York exchanges.
According to Barchart, the September 2026 Arabica futures contract closed down 5.25 US cents/lb, equivalent to 1.61%. The final price was recorded at 321.65 US cents/lb.
Robusta London also fell more sharply in percentage margin. Robusta contract for September 2026 delivery fell 93 USD/ton, equivalent to 2.39%, to 3,798 USD/ton.
This development creates clear pressure on domestic coffee prices, as Robusta London is an important reference for Vietnamese coffee.
Coffee price assessment
Coffee prices today decreased in the same direction as the world market. Robusta lost nearly 100 USD/ton in the most recent session, making it difficult for domestic purchasing prices to maintain the close range of 99,000 VND/kg.
According to Barchart, coffee prices fall as drier weather forecasts in Brazilian coffee growing areas may help coffee beans dry faster and support farmers to accelerate harvest progress. Barchart also quoted Somar Meteorologia as saying that the Minas Gerais region did not record rain in the week ending August 2.
On the supporting side, the progress of Arabica harvesting in Brazil is still slower than the same period. Barchart recorded that Cooxupe cooperative members harvested 67.3% of the expected output as of July 31, lower than 74.2% in the same period last year. However, this factor was not enough to stop the decline in the recent session.
Regarding domestic weather, the National Center for Hydro-Meteorological Forecasting said that on the day and night of August 7, the Central Highlands area will have showers and thunderstorms in some places; especially in the afternoon and evening, there will be scattered showers and thunderstorms, locally heavy rain. Lowest temperature 20-23 degrees C, highest temperature 27-30 degrees C.
This season’s thunderstorms need to be monitored in terms of garden care, pest and disease prevention, and goods preservation.
Coffee prices today decreased sharply domestically and in the same direction as Robusta and Arabica in the world. In the coming sessions, developments on the London exchange, New York exchange, USD/VND exchange rate and demand for export purchases will continue to dominate the domestic price level.
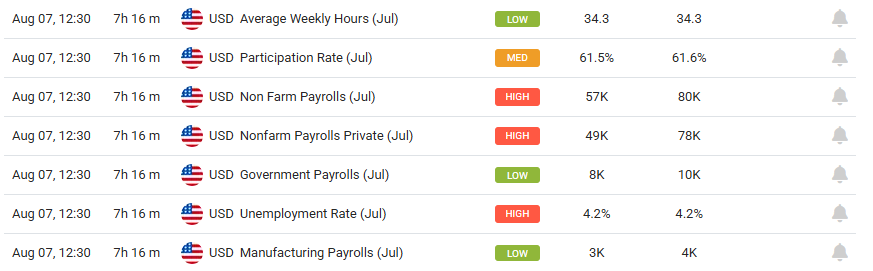
Gold (XAU/USD), trading around $4,254, is on pace for its most profitable weekly close since January after rising 5% this week. Falling oil prices, a weaker dollar, and declining Treasury yields have driven recent movement. In combination with weaker private-sector hiring, expectation for a September Fed rate hike has decreased. The key fundamental data will be today’s U.S. Non-Farm Payrolls, reported at 8:30 a.m. ET. According to the Reuters poll, private-sector payrolls are expected to add 80,000, while the unemployment rate remains unchanged at 4.2%.
Gold has shifted from consolidation to strong recovery. However, buyers will need to push the breakout further after Friday’s labor report. XAU/USD may find a floor near $4,200 in response to falling yields and soft payrolls. However, stronger payrolls and wages may predict Fed tightening and profit-taking.
As the most recent labor data sent mixed signals, the data clearly showed a decline in hiring momentum. ADP data showed that private-sector employers added 44,000 jobs in July, revised down from 95,000 in June and below expectations which were between 70,000-75,000. Limited job growth came from the services sector, while the goods-producing sector saw a decline.
The soft hiring data and falling yields and dollar support gold. Non-yielding bullion benefits from falling yields, as the opportunity cost for holding gold decreases.
Initial jobless claims slightly increased to 199,000 for the week ending August 1 and are still at low levels historically. Continuing claims increased to about 1.80 million, and layoffs decreased to a two-year low. Reuters noted the numbers point to a stable labor market with low hiring.
Traditionally, demand and supply in the labor market have created an environment of “slow-hire, slow-fire,” but no significant labor downturn has been observed.
Friday has been marked on the calendars for the official employment report, as it has become the most important short-term event. According to the latest Reuters poll, the Non-Farm Payroll numbers for the month of July should be around 80,000, up from 57,000 in June. The unemployment rate is projected to stay flat at 4.2%. Annual wage growth is expected to be around 3.5%.
The report should be out by 8:30 am EDT, so until then, any numbers are simply estimates. A significant shortfall in the payrolls (80,000) combined with lower wage growth or downward revisions to wage growth would likely push Treasury yields lower and increase support for gold, as it would give the Fed more reason to pause in September.
For a strong NFP report, the contrary would happen. Markets are indicating that the inflation outlook is unfettered and containment measures cannot yet be applied. Reuters is reporting a 55% chance of an increase in September, down from 63% the previous week. The Fed still has time to consider the data.
For the first time in months days, falling energy prices have helped drive the gold markets in the strongest direction. Gold has a inverse relation to the inflation cycle in that falling oil prices and inflation reduces the need for the Federal Reserve to raise interest rates, which have the most impact on gold in 2026.
The initial U.S.-Iran conflict created and sustained an environment of geopolitical uncertainty that did not impact gold because both oil and inflation, and yields and the dollar were high. Without the conflict, energy inflation and yields will improve for gold in 2026 as yields and inflation will trend lower.
On Friday, gold spot prices increased by 5 percent, which was an indication that gold’s strongest weekly return was about to be realized since January.
The continuous buying of gold to protect against potential geopolitical instability provides a foundation for the price of gold to increase in the long term despite downturns in the market.
The World Gold Council has shown that due to the liquidity and diversification that gold provides, gold is used by Central Banks for protection against geopolitically and financially risky investments and thus gold will retain its value for the longer term more so than other investments due to interest rates, dollar and geopolitical risk.
In 2026, the price of gold improved from the record low of $4,000 in June to $4,250. The macro status of gold and the improvement of the economy was reflected in its price, however, the jobs report from Friday was still able to negatively impact gold’s price.
Gold keeps its bullish sentiment by breaking through the descending trend line and the symmetrical triangle that lasted multiple weeks. Currently, the price stands at $4,254, just below Thursday’s seven-week high.
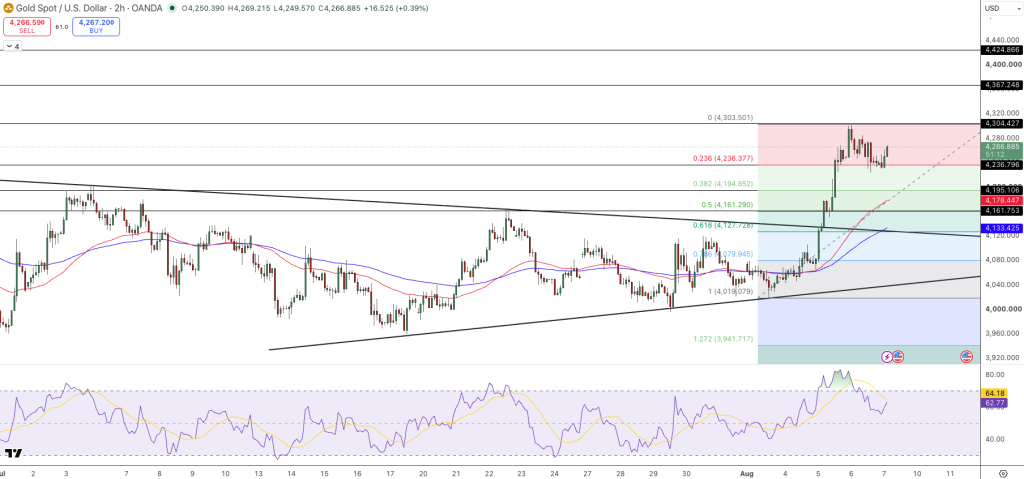
Gold remains above the 50-period EMA at $4,178 and the 100-period EMA at $4,133. After going into the overbought region, the RSI has retreated and the price has shown a lack of upward momentum.
Gold has maintained its bullish behavior as long as the price remains above the $4,236 support level. If the resistance of $4,280 is broken, price targets become $4,303 and $4,367, while a break of $4,195 would indicate the exhaustion of the post-breakout bullish momentum.
Gold is appreciating this week in conjunction with declining Oil prices, decreased U.S. hiring, diminished expectations for an additional Federal Reserve rate hike, declining Treasury yields, and a depreciating dollar.
The most recent economist projections by Reuters show an anticipated increase in employment by 80,000 with July’s Unemployment rate remaining unchanged at 4.2%.
The upcoming breakout level of XAU/USD is $4280 with a subsequent target of $4303 and $4367. Support of XAU/USD is found at $4236 and $4195.

Arslan Ali Butt
Lead Markets Analyst – Multi-Asset (FX, Commodities, Crypto)
Arslan Ali Butt serves as the Lead Commodities and Indices Analyst, bringing a wealth of expertise to the field. With an MBA in Behavioral Finance and active progress towards a Ph.D., Arslan possesses a deep understanding of market dynamics.
His professional journey includes a significant role as a senior analyst at a leading brokerage firm, complementing his extensive experience as a market analyst and day trader. Adept in educating others, Arslan has a commendable track record as an instructor and public speaker.
His incisive analyses, particularly within the realms of cryptocurrency and forex markets, are showcased across esteemed financial publications such as ForexCrunch, InsideBitcoins, and EconomyWatch, solidifying his reputation in the financial community.
Domestic coffee prices today
Coffee prices today in the domestic market increased compared to the previous day. According to giacaphe. com, coffee prices on August 6th averaged 98,900 VND/kg, up 600 VND/kg. The highest price in key Central Highlands regions was recorded at 99,000 VND/kg.
In Lam Dong, coffee prices today reached 98,300 VND/kg, an increase of 700 VND/kg compared to the previous day. This is the lowest level in the regions.
In Gia Lai, coffee prices were recorded at 98,800 VND/kg, an increase of 500 VND/kg compared to the previous session.
The old Dak Nong area recorded a level of 99,000 VND/kg, an increase of 700 VND/kg. This is the highest level among the surveyed areas.
After two consecutive increasing sessions, domestic coffee prices have approached the 110,000 VND/kg mark. Compared to the August 4 session, the average level has increased by about 2,400 VND/kg.
World coffee prices
In the world market, coffee prices increased in the most recent session. According to data from Barchart, the September 2026 Arabica contract closed the session up 2.80 US cents/lb, equivalent to 0.86%, to 326.90 US cents/lb.
Robusta London futures for September 2026 also increased by 37 USD/ton, equivalent to 0.96%. With this increase, Robusta futures for September 2026 contracts increased to 3,891 USD/ton.
This development shows that world coffee prices are clearly supporting the domestic market more. Robusta increasing by nearly 1% is a noteworthy sign for purchasing prices in Vietnam, as this is the main coffee group of the domestic market.
Coffee price assessment
Domestic coffee prices continued to increase as both Robusta and Arabica in the world went up. The increase of 600 VND/kg brought the average price close to 99,000 VND/kg, narrowing the gap with the region of 100,000 VND/kg.
According to Barchart, coffee prices increased in the most recent session due to global weather factors and slower Brazil harvest progress than the same period.
For the Vietnamese market, Robusta London is still a variable that needs to be closely monitored. If the September futures contract remains above the 3,800 USD/ton range, domestic coffee prices will have more support in the short term.
Regarding domestic weather, the National Center for Hydro-Meteorological Forecasting said that on the day and night of August 6, the Central Highlands area will be cloudy, with showers and thunderstorms in some places; especially in the afternoon and evening, there will be scattered showers and thunderstorms, locally heavy rain. The lowest temperature is 20-23 degrees Celsius, the highest is 26-29 degrees Celsius, in some places above 29 degrees Celsius. Rain and thunderstorms this season need to be monitored at the stages of garden care, pest and disease prevention and goods preservation.
Coffee prices today continue to increase domestically and in the same direction as the world market. In the coming sessions, the developments of Robusta London, USD/VND exchange rate, inventory and demand for export purchases will continue to dominate the domestic price level.
Silver price (XAG/USD) remains stronger for the fourth consecutive day, trading around $62.20 per troy ounce during the Asian hours on Thursday. The price of the non-yielding Silver gains momentum as news of a deal to partially reopen the Strait of Hormuz pushed oil prices lower, significantly easing broader market concerns surrounding inflation and the outlook for interest rates.
The shift comes as Iran and Oman reached an agreement on a temporary shipping route through the strategic waterway, boosting global expectations for increased Middle Eastern energy flows. A joint statement from both nations is currently in its final drafting stages. While the proposed route is slated to operate for two to four months, Tehran made it clear that this arrangement does not represent a complete reopening of the strait.
According to TD Securities, the current structure of the oil market suggests that recent price moves are being driven more by positioning than by any material shift in underlying supply-demand dynamics. Strategists there highlight that “this time around, timespreads remain much stronger, which is the clearest signal that spec flows chasing headlines are doing the heavy lifting as opposed to any loosening of the fundamentals.” In their view, the resilience of timespreads reinforces the message from physical flows that the crude market remains fundamentally tight, even as headline risk and speculative activity exert outsized influence on day-to-day price action.
Meanwhile, economic data in the US added to the market dynamics. ADP figures released on Wednesday revealed that US private-sector employment grew by just 44,000 jobs in July, a sharp deceleration from the 98,000 added in June that fell well short of the 70,000-market consensus. With labor market cooling in focus, traders are now closely watching Thursday’s US Initial Jobless Claims and Friday’s Nonfarm Payrolls (NFP) report.
Fed’s Cook speech scores 7.2/10 on the FXS Speechtracker, modestly above the 6.5/10 historical average, signaling a slightly more forceful tone relative to the established baseline. The remarks balance recognition of a sturdy job market and resilient expansion with a clear emphasis that inflation threats surpass job market concerns, underscoring a firm commitment to restoring price stability while keeping rate hikes conditional on the disinflation trend failing to reappear. Overall, the message leans hawkish on inflation risks but stops short of pre-committing to imminent tightening, which is supportive for the Dollar and broadly cautious for risk-sensitive assets.
The FXS Fed Sentiment Index fell by 1.93 points to 140.92, indicating a modest pullback in perceived hawkishness following the speech. Despite the decline, the index remains well above the neutral 100 threshold, showing that Fed communication is still firmly in hawkish territory even as the immediate tightening impulse eases slightly according to the FXS Fed Sentiment Index and FXS Speechtracker.
XAG/USD trades around $62.20. is holding a near-term bullish bias as it advances above the nine-day Exponential Moving Average (EMA) at $59.76 while still trading below the 50-day EMA at $62.69, which caps the topside for now. The 14-day Relative Strength Index (RSI) at 56.81 leans constructive, suggesting firm positive momentum, while the FXS Fed Sentiment Index at 140.92 hints that broader macro sentiment remains supportive rather than euphoric.
On the topside, immediate resistance is defined by the 50-day EMA at $62.69; a clear daily close above this barrier would open the door toward the next structural hurdles at $90.03 and $96.62, though these latter levels remain distant in the current trading context. On the downside, initial support is seen at the nine-day EMA at $59.76, ahead of the horizontal floor at $55.63.
(The technical analysis of this story was written with the help of an AI tool. Know more.)
Silver flirted with $63 on Wednesday, its highest in over a month amid renewed market optimism. Investors welcomed news hinting at a soon-to-come deal between the United States (US) and Iran.
XAU/USD traded as high as $62.78 early in the American session, following headlines indicating that the US Treasury lifted counter-terrorism sanctions imposed on three airlines and two aircraft linked to the Islamic Revolutionary Guard Corps (IRGC) and three airlines.
A Treasury official clarified that the decision was not related to US negotiations with Iran over a possible deal to end hostilities in the Gulf, according to Reuters, yet market players dropped the Greenback on hopes that a deal is closer. The encouraging headline was reinforced by reports suggesting that a deal between Oman and Iran is done, pending Tehran’s approval.
The USD was also pressured by local data, as the ADP Employment Change survey showed that the US private sector added measly 44K in July, missing expectations of 70K and below the 98K recorded in June. Also, the ISM Services Purchasing Managers’ Index printed at 54.1 in July, slightly better than the previous 54, although below the 54.5 expected.
Broad USD weakness keeps precious metals near recent highs, with XAU/USD now hovering around the $62 level.
In the 4-hour chart, XAG/USD trades at $62.00, extending its recovery above the critical $61 mark, a former relevant low now an immediate relevant support. The pair holds well above the 20-period Simple Moving Average (SMA) at $59.32 and the longer-term 100- and 200-period SMAs at $58.15 and $58.99, respectively, which now underpin the uptrend. The Momentum indicator gains modest upward traction above its midline, while the Relative Strength Index (RSI) indicator consolidates around 74, far from signaling exhaustion but instead reflecting the latest advance.
In the daily chart, Silver retains a constructive near-term bias as it trades well above the 20-day SMA at $58.30, while the 100-day and 200-day SMAs at $69.22 and $71.06, respectively, remain well overhead, signaling that the broader trend is still capped despite the latest rebound. Momentum has improved, with the 14-day Relative Strength Index around 56 and the 14-day Momentum indicator turning firmly positive, which suggests buyers currently have the upper hand.
On the downside, immediate support is seen at the short-term 20-period SMA at $59.32, followed by the 200-period SMA at $58.99 and the 100-period SMA at $58.15, where any dip would likely attract fresh demand while these levels hold. On the topside, initial resistance is seen at the 100-day SMA near $69.22, followed by the 200-day SMA at $71.06, a cluster that is likely to act as a tougher supply zone if the rally extends. Once beyond it, however, the path towards $100 will be much clearer.
(The technical analysis of this story was written with the help of an AI tool. Know more.)
Domestic coffee prices today
Coffee prices today in the domestic market have not recorded a newer update table on giacaphe. com. According to the latest data being displayed, the average coffee price is at 96,500 VND/kg; the highest level in key regions of the Central Highlands is also 96,500 VND/kg.
In Lam Dong, coffee prices were recorded at 96,000 VND/kg, unchanged compared to the previous table. This is a low level among regions with detailed data.
In Gia Lai, coffee prices are at 96,500 VND/kg, unchanged compared to the previous day.
The old Dak Nong area recorded a level of 96,500 VND/kg. In the latest updated table, this region decreased by 200 VND/kg compared to the previous session.
The domestic coffee price level is still lower than the area close to 99,000 VND/kg recorded at the end of July. However, the price has not fallen deeper but is temporarily holding around 96,000-96,500 VND/kg.
World coffee prices
In the world market, coffee prices recovered in the most recent session.
According to Barchart, the September 2026 Arabica futures contract closed at 324.10 US cents/lb. This session, Arabica increased by 4.60 US cents/lb, equivalent to 1.44%.
Robusta London futures for September 2026 also increased. According to Barchart, this contract closed at $3,854/ton, up $68/ton, equivalent to 1.80%.
This development shows that world coffee prices have recovered after the previous decline. Robusta increased more strongly than Arabica in percentage, which could create psychological support for the domestic market if domestic prices are updated.
Coffee price assessment
Domestic coffee prices are currently still hovering around 96,500 VND/kg, while world prices have increased again. This deviation is mainly due to the fact that the domestic price list has not been updated further, so it is not possible to confirm that domestic prices have reacted to the recovery of the international exchange.
According to Barchart, coffee prices increased as buying and selling pressure appeared after the forecast of rain in Minas Gerais, Brazil’s largest coffee growing region, a factor that could continue to slow down harvest progress. Barchart also noted that Brazil’s harvest progress is slower than the same period, creating price support.
For the Vietnamese market, Robusta London is still a variable that needs to be closely monitored due to its direct impact on domestic purchasing prices. If Robusta maintains the above 3,800 USD/ton range, domestic coffee prices may be supported in the coming sessions.
Regarding the weather, the National Center for Hydro-Meteorological Forecasting said that on the day and night of August 5, the Central Highlands area will have showers and thunderstorms in some places; especially in the afternoon and evening, there will be scattered showers and thunderstorms, locally heavy rain. Lowest temperature 20-23 degrees C, highest 27-30 degrees C, in some places above 30 degrees C.
This season’s thunderstorms need to be monitored in terms of garden care, pest and disease prevention, and goods preservation.
WTI crude oil experienced a dramatic 4% decline on August 4, 2026, falling to $77.11 per barrel as markets reacted to news of potential US-Iran diplomatic progress. This significant price movement reflects the ongoing geopolitical tensions surrounding the Strait of Hormuz, through which approximately 20% of global oil shipments pass daily. For investors, this volatility presents both challenges and opportunities across the energy sector, from major oil producers to renewable energy alternatives.
The current market dynamics are shaped by competing forces: supply constraints caused by Middle East conflicts and the potential relief from diplomatic solutions. According to portfolio manager Greg Sharenow at Pimco, the oil market remains in an “absolute supply shortage state,” with traders now dealing with unprecedented volatility in Hormuz Strait flows. This environment demands careful portfolio positioning and strategic thinking about energy exposure.
The Strait of Hormuz has emerged as the focal point of global oil market anxiety. As one of the world’s most critical maritime chokepoints, any disruption to this passage has immediate and severe implications for global energy supply. The ongoing Middle East conflicts have created genuine supply bottlenecks, with Pimco’s analysis confirming that the market is experiencing structural shortages beyond typical cyclical fluctuations.
Traders and analysts have shifted their focus from monitoring daily production changes of several hundred thousand barrels to managing the risk of complete flow disruptions through Hormuz. This paradigm shift has introduced extreme volatility into oil pricing mechanisms, with geopolitical headlines now capable of moving prices by several percentage points within hours. The current environment represents one of the most unpredictable periods for energy markets in recent years.
The announcement by US Treasury Secretary Scott Bessent regarding potential US-Iran agreement discussions has injected significant uncertainty into oil markets. The prospect of reopening the Strait of Hormuz to unrestricted traffic would represent a dramatic supply shock, potentially adding millions of barrels per day back to global markets. This possibility has triggered immediate selling pressure on crude futures as traders price in improved supply conditions.
However, investors should remain cautious about overinterpreting preliminary diplomatic signals. Historical precedents suggest that negotiations between the US and Iran often involve extended timelines and multiple reversals. The current price decline may reflect optimism that exceeds near-term realistic outcomes, creating potential for volatility if diplomatic progress stalls.
ExxonMobil (XOM) remains a bellwether for large-cap energy exposure, with its integrated operations providing some insulation from pure commodity price volatility. The company’s downstream refining and chemical operations can benefit from lower input costs when crude prices decline, partially offsetting upstream production revenue reductions.
Chevron (CVX) offers similar integrated exposure with a strong balance sheet that enables continued dividend growth even during commodity downturns. Both companies have used recent years of higher prices to reduce debt and improve operational efficiency, positioning them well for various price environments.
The oilfield services sector presents a leveraged play on oil price stability and production activity. Companies like Schlumberger and Halliburton benefit from increased drilling and completion activity when oil prices support new project economics. Current volatility may actually benefit these companies in the medium term, as producers rush to secure equipment and services during price uncertainty.
For investors seeking broader exposure, the Energy Select Sector SPDR Fund (XLE) provides diversified access to the entire sector, reducing single-company risk while maintaining correlation with oil price movements.
Lower oil prices provide immediate relief to airline operators, where fuel represents 20-30% of operating costs. Major carriers like Delta Air Lines and United Airlines typically see margin expansion during crude price declines, with the benefits often appearing in quarterly results within one to two quarters.
The transportation sector more broadly benefits from reduced diesel costs, improving profitability for trucking companies and logistics operators. Investors should monitor inventory builds at transportation companies, as lower fuel costs sometimes coincide with broader economic slowing that could reduce shipping volumes.
Lower gasoline prices effectively provide a tax cut to consumers, freeing up discretionary income for spending on retail, dining, and entertainment. Historical correlations suggest that periods of declining oil prices typically support outperformance in consumer discretionary sectors, particularly among companies serving middle-income demographics.
The decline in oil prices creates competitive pressure on renewable energy adoption, particularly in transportation and heating applications where direct fuel switching occurs. Solar and wind power, primarily competing with natural gas and coal in electricity generation, face less direct impact but still benefit from general energy price stability rather than volatility.
Long-term renewable energy investors should view current oil price weakness as a potential buying opportunity rather than a structural threat. The energy transition continues to be driven by policy support, technological improvement, and climate considerations rather than short-term commodity price movements. Companies like NextEra Energy maintain strong growth trajectories regardless of oil price fluctuations.
The sharp decline to $77 places WTI crude near key technical support levels established during previous consolidation phases. The psychological $75 level represents the next major support zone, with a break below potentially triggering algorithmic selling and accelerating downside momentum toward $70.
On the upside, resistance now forms at the previous support level around $80, with a sustained move back above this threshold requiring either reversal of diplomatic optimism or new supply disruption catalysts. The 50-day and 200-day moving averages, currently around $82 and $78 respectively, provide additional reference points for technical traders.
Options markets are pricing elevated implied volatility, reflecting genuine uncertainty about near-term price direction. The skew toward put options suggests institutional hedging against further downside, while elevated call open interest at higher strikes indicates expectations for potential snapback rallies on any negative diplomatic developments.
The current oil market volatility driven by US-Iran diplomatic developments presents a classic risk-reward scenario for energy investors. While the potential for supply normalization offers relief to global markets, the uncertainty surrounding actual implementation creates trading opportunities for prepared investors.
For long-term portfolio construction, maintaining diversified energy exposure through integrated majors and quality oilfield services companies offers the most balanced approach. Short-term traders may find opportunities in volatility strategies or tactical sector rotation plays benefiting from lower oil prices.
Ready to analyze energy stocks with AI-powered tools? Try the Intellectia AI Screener to identify the best opportunities in today’s volatile energy markets. Our AI-driven analysis helps you navigate complex sector dynamics and find stocks poised to benefit from changing oil price environments.
For investors seeking personalized stock picks in the energy sector and beyond, explore our AI Stock Picker feature. Join thousands of investors using artificial intelligence to enhance their investment decisions and stay ahead of market trends.