The main tag of Gold News Today Articles.
You can use the search box below to find what you need.
[wd_asp id=1]

1 10, 2025

Natural Gas Price Forecast: Strengthens Above Uptrend Line, as First Target Reached

By |2025-10-01T00:23:48+03:00October 1, 2025|Forex News, News|0 Comments


ABCD Pattern and Key Pivot Levels

While strength has been confirmed, natural gas now confronts a decision zone. The ABCD measured move symmetry between the rising AB and CD legs aligns with the 100% projected target at $3.34. This creates the possibility of a pivot and pullback, especially since a lower gap remains unfilled and the market has yet to revisit the 20-Day and 50-Day moving averages for support. These moving averages, converging near $3.00, represent important levels to watch if selling pressure emerges.

Path Toward 200-Day Average

A strong daily close above today’s high could open the door to higher levels. The next upside zone lies near the 200-Day moving average at $3.49, reinforced by the 127.2% ABCD projection at $3.50. The overlap of multiple indicators at this level strengthens its potential importance as resistance. Before that target is reached, however, natural gas must break decisively above a descending trendline, a move that would further confirm strengthening demand.

Outlook

The interaction with the long-term uptrend line has turned into a bullish signal. A sustained close above the 200-Day average would mark a significant shift in trend dynamics and encourage further bullish momentum. Until then, the $3.25 level serves as immediate support, while the $3.34–$3.35 area defines the near-term decision point for traders.

For a look at all of today’s economic events, check out our economic calendar.


Source link

30 09, 2025

Oil Price Forecast – Will WTI (CL=F) and Brent (BZ=F) Sink Below $60 on OPEC+ Supply Push?

By |2025-09-30T20:21:54+03:00September 30, 2025|Forex News, News|0 Comments


WTI (CL=F) and Brent (BZ=F) Under Pressure After Saudi Signals Supply Hike

Crude benchmarks are retreating sharply, with West Texas Intermediate sliding 2.82% to $61.69 per barrel and Brent down 2.48% to $65.33. The drop was ignited by reports that Saudi Arabia is pressing OPEC+ ministers to accelerate the reinstatement of 1.66 million barrels per day of supply that had been cut under voluntary quotas. This proposal, now expected to dominate the upcoming OPEC+ virtual meeting, represents a strategic pivot from defending prices toward reclaiming market share, underscoring Riyadh’s willingness to test downside resilience in the oil market.

Inventory Builds in the U.S. Complicate OPEC+ Narrative

Fresh EIA data showed a 2.4 million barrel build in U.S. commercial crude stockpiles last week, defying expectations of a draw and amplifying pressure on prices. Refineries moving into seasonal maintenance reduced throughput, aggravating the supply overhang. Gasoline prices also reflected weakness, down nearly 2.85% to $1.95 per gallon. Together, these figures undermine the short-term bullish case and support the market’s view that a glut may form even if OPEC+ decides not to accelerate its supply hike.

Asia Buys the Dip While India Shifts Crude Mix

Lower prices are stimulating bargain hunting in Asia. Imports across the continent are rising, with India playing a pivotal role. The country’s top refiner, IOC, bypassed U.S. crude at its latest tender, instead securing West African and Middle Eastern barrels. This pivot reflects the narrow arbitrage between WTI and seaborne alternatives but also signals how pricing in Asia can quickly reshape flows. India continues to buy Russian oil aggressively, taking advantage of deepening discounts as Russia struggles with refining outages caused by Ukrainian drone strikes.


Geopolitical and Structural Risks Add Volatility to CL=F and BZ=F

Oil’s weakness is not purely supply-driven. Ongoing geopolitical risk, from Venezuelan military confrontations in the Caribbean to Houthi missile activity near Saudi lanes, is simmering in the background. Yet the overriding narrative is excess supply, not disrupted flows. Analysts warn that if Brent breaks below $65 and WTI under $60, psychological thresholds could fuel momentum selling. ING projects OPEC+ will keep production unchanged, but Saxo Bank highlights a “floor” around current prices, arguing that disruptions in Iraq and Kazakhstan—both exceeding quotas—could cap downside. Still, Saudi Arabia’s push suggests the kingdom sees current demand elasticity as too fragile to support a rally, particularly with Chinese demand showing signs of slowing.

Medium-Term Outlook and Investment Implications

With OPEC+ having already unwound 2.2 million barrels per day of cuts this year, the market is now staring at the potential of another rapid flood of supply. The result is a widening consensus that oil could revisit levels not seen since 2021. Traders are now debating whether CL=F will retest $60, a level that could trigger U.S. shale producers to reconsider drilling programs, or whether Brent (BZ=F) stabilizes near $65 with support from Asian imports. For investors, the equation is clear: while supply-driven weakness creates a bearish short-term setup, any reversal in OPEC+ policy or geopolitical flare-up could flip sentiment instantly.

That’s TradingNEWS


Source link

30 09, 2025

XAU/USD breaks $3,800 to new all-time highs

By |2025-09-30T14:16:55+03:00September 30, 2025|Forex News, News|0 Comments


  • Gold breaks above $3,800, fulfilling forecasts and setting fresh all-time highs.
  • Fed cuts, central bank buying, and ETF inflows drive momentum as safe-haven demand grows.
  • Technical roadmap eyes $3,880–$3,900, with $3,825–$3,835 FVG and $3,800 as critical support.

Gold rally materializes: From forecast to reality

In last week’s forecast, we outlined the potential for gold to break above $3,800 once buyers defended the $3,791–$3,758 Fair Value Gap. That roadmap has now unfolded: XAU/USD surged decisively to fresh all-time highs, confirming the bullish structure that had been building.

The breakout was also highlighted in our recent YouTube market update, where we anticipated the conditions for gold’s upside momentum. That projection has since been validated in price action, with gold bulls taking full control.

Fed policy tailwind: Lower yields, higher Gold

The Federal Reserve’s latest 25 bps rate cut has once again reduced real yields, directly fueling gold’s rise. Investors are no longer just pricing in the cut itself—they’re positioning for a series of further adjustments into year-end. This repricing of U.S. interest rate expectations has made non-yielding assets like gold more attractive.

What makes this policy tailwind more powerful is the Fed’s balance of language: while acknowledging inflation risks, officials have been forced to weigh a slowing labor market and softer business activity. Markets are leaning toward at least two more cuts before December, leaving gold well-supported on dips.

Why Gold is breaking all-time highs

Gold’s surge into record territory is not a short-lived anomaly—it’s the culmination of several converging forces:

  • Erosion of Real Yields – Each Fed rate cut chips away at real returns on U.S. assets, lifting gold as an alternative store of value.
  • Structural Buying From Central Banks – Heavy purchases from China, India, and emerging markets highlight a global diversification away from the U.S. dollar.
  • ETF & Institutional Flows – Record inflows into gold-backed ETFs indicate growing conviction from funds and asset managers.
  • Geopolitical Tensions – Middle East conflicts, U.S.–China tariff disputes, and cyber risk events sustain gold’s safe-haven role.
  • Dollar Weakness Rotation – As investors reprice the U.S. rate path, capital shifts away from the dollar into tangible hedges like bullion.

Combined, these forces have built the perfect backdrop for gold’s historic breakout—fueling momentum not just from speculators, but also from long-term strategic buyers.

Why Gold favors a bullish bias over shorts

Gold’s underlying structure and demand profile tilt decisively toward the upside, making bullish setups far more favorable than shorting attempts:

  • Structural Demand – Central banks remain net buyers, cushioning dips.
  • Policy Environment – Fed easing historically aligns with strong gold rallies.
  • Safe-Haven Flows – Risk events continue to attract capital into bullion.
  • Price Action – Every new high has historically been followed by further extensions, not sustained reversals.

Short plays may exist tactically in overheated conditions, but the macro and structural landscape continues to favor the bulls.

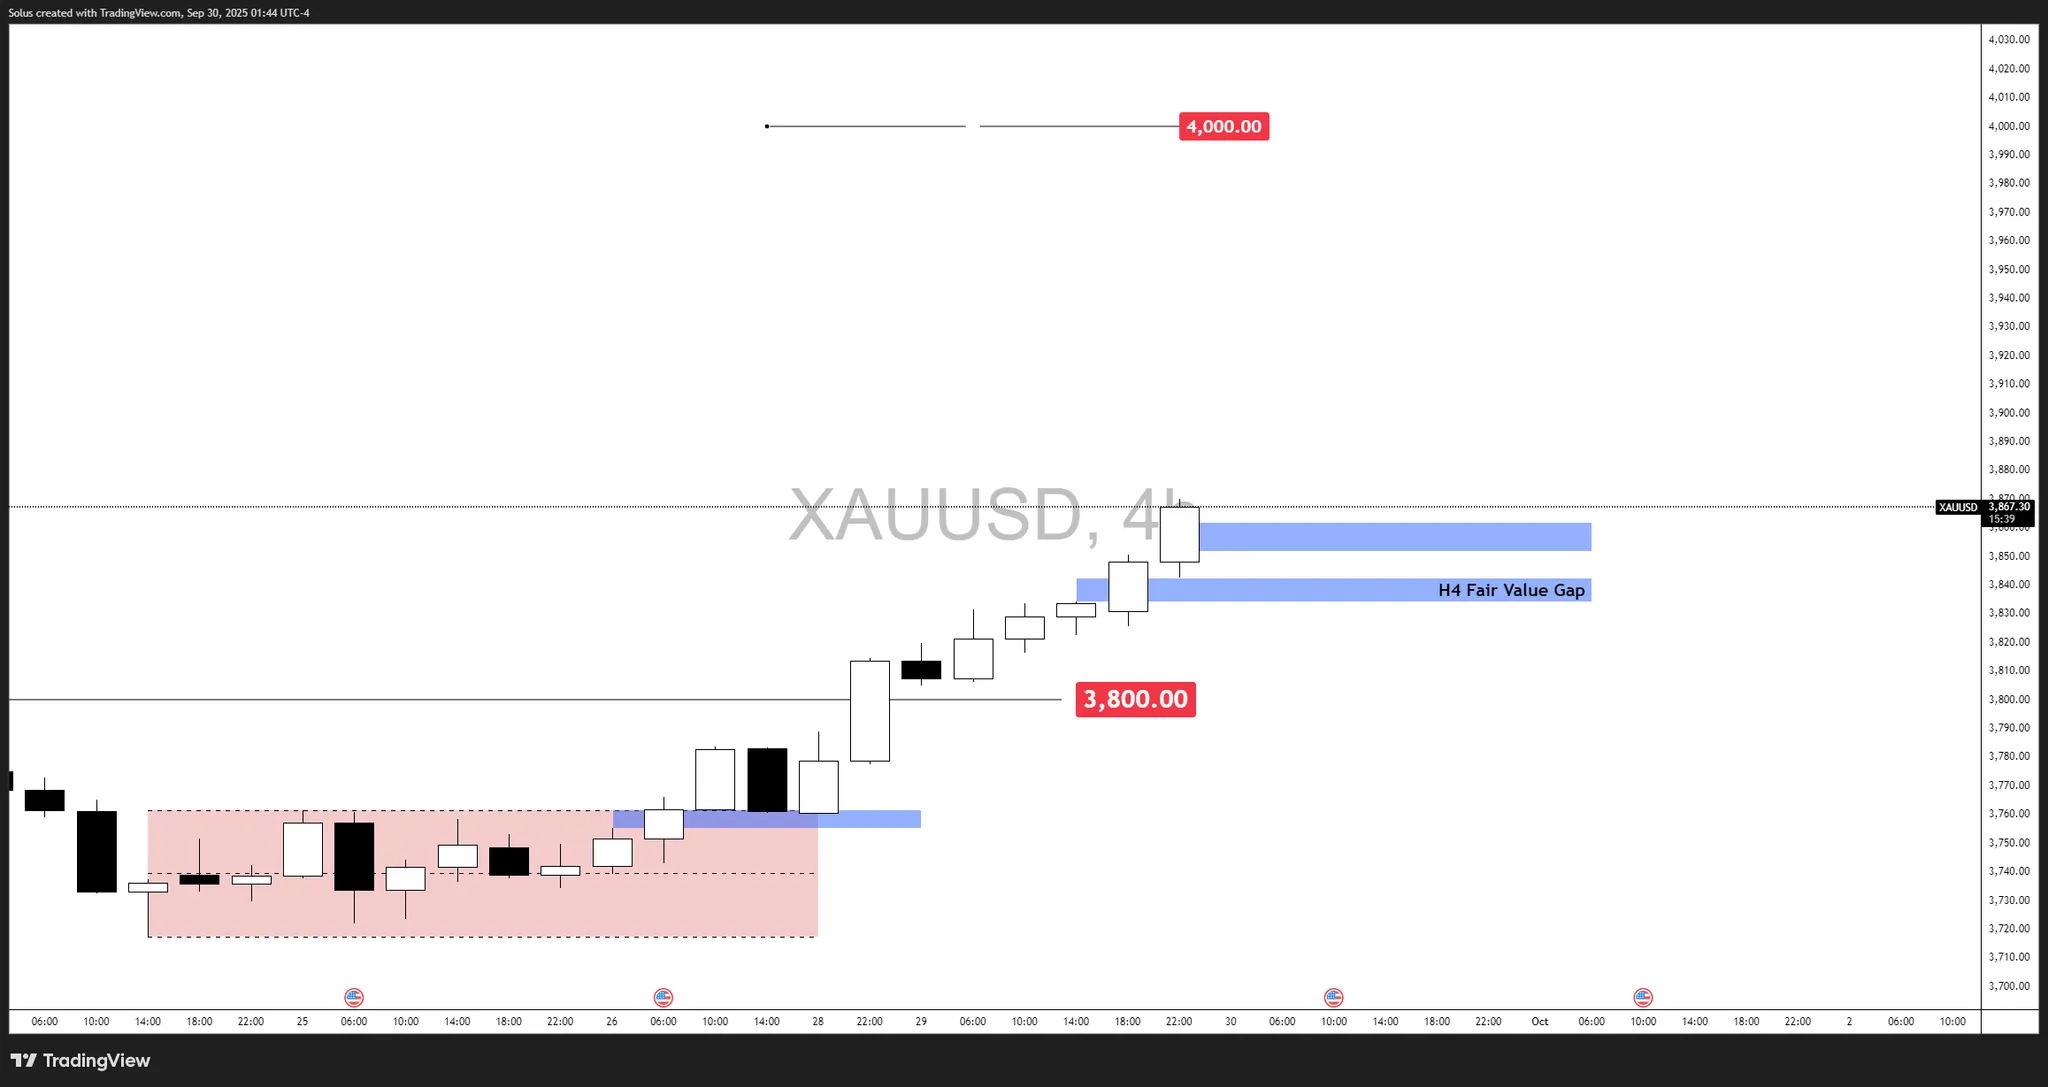
Technical outlook: Gold (XAU/USD)

Gold has confirmed its breakout above $3,800, with momentum carrying price to fresh highs near $3,860. On the H4 chart, price action shows a clean displacement to the upside, leaving behind a Fair Value Gap (FVG) around $3,825–$3,835 that now acts as immediate demand. This gap, alongside the $3,800 breakout level, forms the first line of defense for bulls.

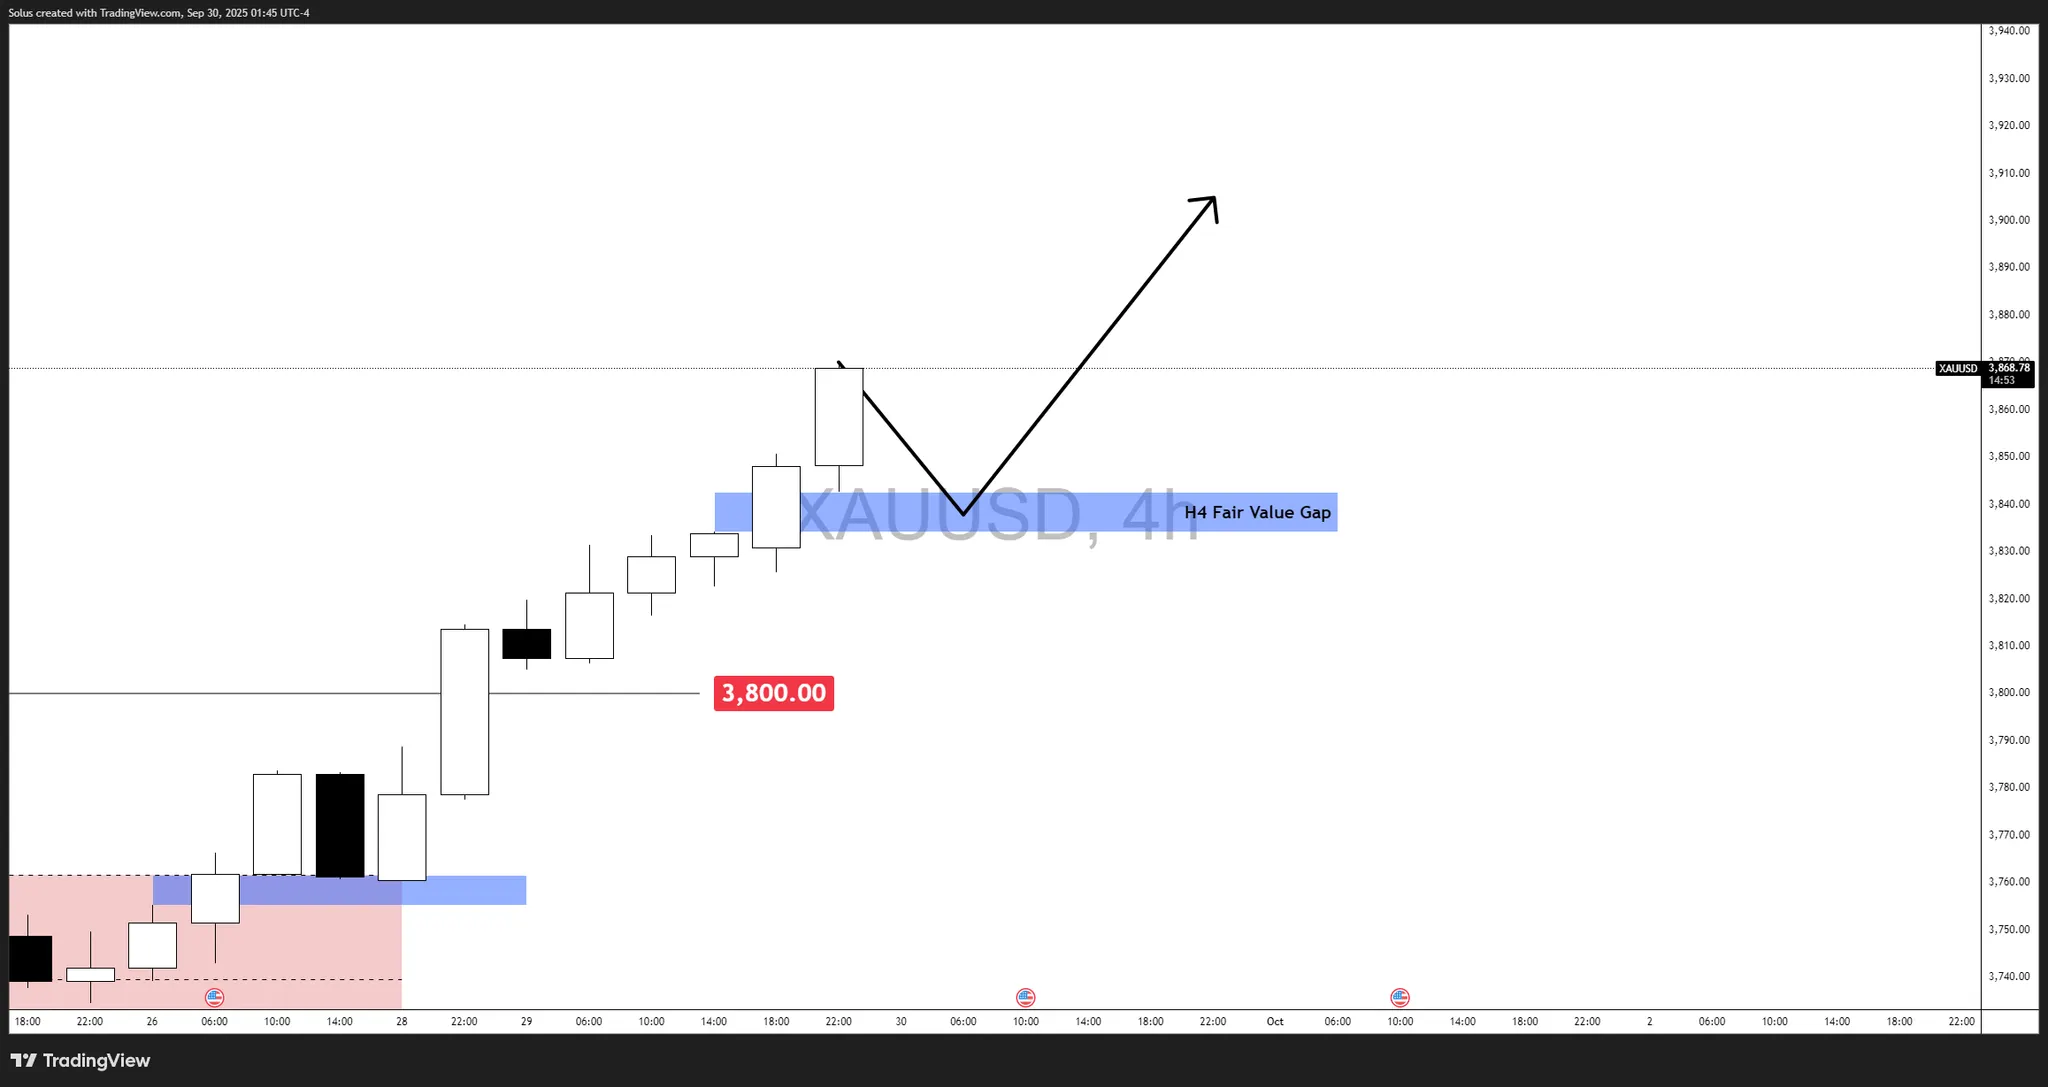
Bullish scenario: Retest and continuation

Gold’s breakout above $3,800 has left behind an H4 Fair Value Gap at $3,825–$3,835, which now acts as a potential springboard for further upside. If price pulls back into this zone and finds support, buyers are likely to step back in with conviction.

  • Holding above this FVG confirms bullish order flow, keeping buyers in control.
  • Upside targets: $3,880 first, followed by the $3,900 psychological milestone if momentum extends.
  • The bullish narrative remains intact as long as $3,800 holds as support.

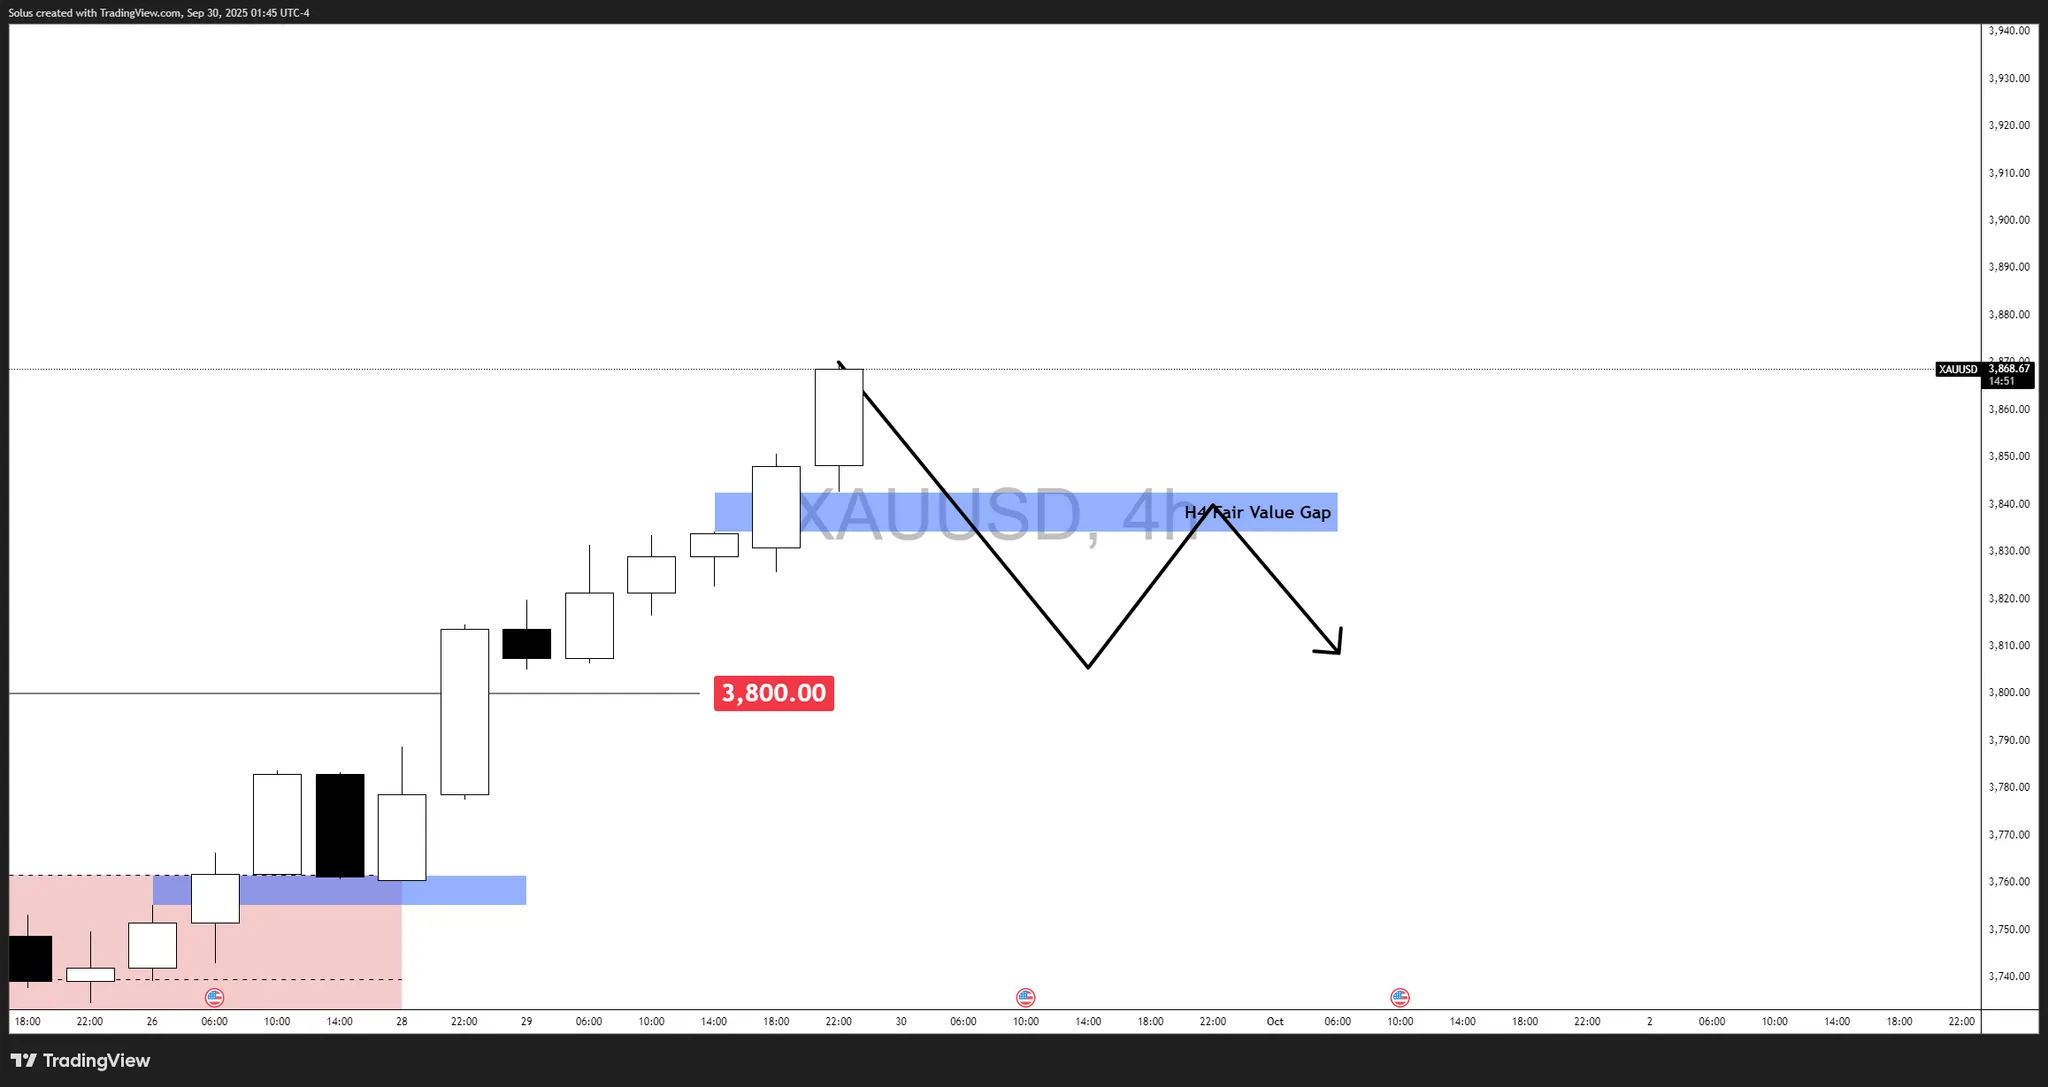
Bearish scenario: FVG rejection and breakdown

If the H4 Fair Value Gap at $3,825–$3,835 fails to attract strong buyers, gold risks turning lower in a corrective phase. A clean rejection from this zone would indicate sellers are defending premium pricing after the breakout.

  • Failure to hold the FVG drags price back to retest $3,800.
  • A decisive breakdown below $3,800 flips the breakout level into resistance.
  • Downside targets open at $3,770 → $3,740, where deeper liquidity sits.

Conclusion

Gold has delivered exactly as forecasted—breaking through $3,800 and setting new records. With Fed policy acting as a steady tailwind, structural central bank demand, and persistent safe-haven flows, the metal’s bullish case far outweighs any shorting attempts. Unless a hawkish Fed shock emerges or inflation data flips the script, the path of least resistance remains upward.


Source link

30 09, 2025

The GBPAUD is maneuvering the support– Forecast today – 30-9-2025

By |2025-09-30T12:13:51+03:00September 30, 2025|Forex News, News|0 Comments


The EURJPY pair activated with stochastic intraday negativity, to keep its stability below the barrier at 175.20, providing correctional trading by reaching 174.00.


Note that the current decline will not affect the bullish scenario due to the stability of the extra support at 173.40, therefore, we will keep waiting for gaining the positive momentum to ease the mission of surpassing the barrier and targeting new positive stations that might extend to 175.60 and 176.00, while breaking the extra support will confirm its surrender to the bearish correctional track, forcing it to suffer extra losses by reaching 172.60.


The expected trading range for today is between 173.65 and 174.85


Trend forecast: Fluctuated within the bullish track


Source link

30 09, 2025

Platinum price needs to confirm the breach– Forecast today – 30-9-2025

By |2025-09-30T10:12:36+03:00September 30, 2025|Forex News, News|0 Comments


Platinum price reached $1625.00 level in its last rally, then bounces quickly to settle below 261.8%Fibonacci extension level at $1605.00, forming a strong barrier against the attempt of holding within the bullish channel’s levels that appear in the above image.


The price might be force to provide mixed trading, its stability above the extra support near $1525.00 besides the continuation of providing positive momentum by the main indicators will increase the chances for confirm breaching the current barrier, to ease the mission of achieving extra gains that might extend to $1642.00 initially, reaching $1690.000.


The expected trading range for today is between $1565.00 and $1642.00


Trend forecast: Bullish


Source link

30 09, 2025

WTI $65.64, Brent $69.18 Ahead of OPEC+

By |2025-09-30T02:07:05+03:00September 30, 2025|Forex News, News|0 Comments


WTI Crude (CL=F) and Brent (BZ=F) Rebound as Asia’s Imports Surge

WTI crude (CL=F) climbed 2.55% to $65.64, while Brent crude (BZ=F) rose 1.51% to $69.18, with gains reinforced by a rebound in Asia’s buying activity. Data showed that Asia’s August crude imports averaged 27.18 million barrels per day, up from July’s year-low of 24.91 million bpd and higher than a year earlier. China and India, which together drive more than a third of global oil demand, boosted imports after prices in May and June dropped into the low $60s per barrel. Opportunistic buying during that dip is now showing up in stronger August arrivals. However, forward flows could tighten again, as cargoes contracted after June’s spike above $80 per barrel during the Israel–Iran war will likely soften September imports.

Urals Oil and Russian Discounts Narrow Amid Tariffs and Caps

Urals crude is trading at $62 per barrel, narrowing its discount against Brent, which sits at $69.12. Since the G7’s $60 price cap was introduced in 2022, Urals has defied enforcement, trading above that level on 75% of days thanks to shipments through “dark fleets.” China remains the largest buyer, while Russia has kept its top-supplier position for India despite U.S. sanctions pressure. That dynamic shifted in late August when the U.S. imposed a 50% tariff on Indian imports of Russian oil, effective August 27, after New Delhi refused to scale back purchases. The EU and G7 allies will lower the threshold of the price cap to $46.50 per barrel, but enforcement remains patchy. This geopolitical tug-of-war is adding volatility across the curve, forcing traders to watch not just demand but also policy intervention.

Saudi Arabia’s Fiscal Stress as Brent Lingers Below $70

Saudi Arabia faces fiscal strain as Brent crude trades near $69, well below the estimated $90 per barrel price needed to balance its 2025 budget. Oil export revenues in April fell to $16.5 billion, down 21% year-over-year and the weakest in four years, as prices crashed 15% during the U.S. tariff blitz and OPEC+ production hikes. To finance its widening deficit, Riyadh is again tapping debt markets, issuing new tranches of Sukuk bonds. Investors placed $15 billion in orders by midday, showing global demand for Saudi debt remains strong despite oil’s downturn. Brent has lost 8% year-to-date, raising questions about how long Saudi can sustain spending on diversification projects while simultaneously defending market share.

OPEC+ Strategy and the Market Balancing Act

Speculation ahead of the OPEC+ meeting points to a likely rollover of current quotas, with no major cuts expected. The bloc faces a difficult balancing act: U.S. production set a record in 2024 and continues to beat weekly estimates in mid-2025, while Russia is keeping exports strong to Asia. Brent futures at $68.43 for November delivery and WTI October contracts at $64.91 show that markets are anchored in the mid-$60s to high-$60s range, struggling to break higher. The 200-day EMA sits at $62 for WTI and $70.52 for Brent, marking key technical pivot levels. For WTI, a sustained break above $66.50–$67.00 could target $70, while support lies at $62.00. Brent must clear $70.50–$73.00 to escape the consolidation band.

India and China: Winners of Cheaper Crude

India saved $12.6 billion on its oil import bill this year by leveraging discounted Russian crude, while China has expanded purchases from both Russia and Saudi Arabia. Together, their opportunistic buying strategies amplified August’s rebound in Asian imports. Yet this reliance comes at a geopolitical cost. Trump’s tariffs directly target India’s Russian inflows, and future U.S. policy may pressure Chinese refiners as well. India’s imports from sanctioned suppliers such as Nayara Energy are under scrutiny, with Saudi Arabia and Iraq suspending shipments in response to Western sanctions compliance issues. These disruptions highlight the fragility of Asia’s supply chain, where opportunistic savings clash with policy risks.

Geopolitical Shocks Add to Supply Volatility

Drone strikes forced Sudan to shut down production in the Heglig basin, cutting about 30,000 bpd. Separately, Houthis claimed a missile attack on an Israel-linked oil tanker in the Red Sea, and Russia’s Baltic fuel ports remain impaired after drone damage, extending repairs for months. Syria exported crude for the first time in 14 years, signaling the return of sanctioned barrels. These disruptions underscore how geopolitics are keeping risk premiums alive even as overall supply is abundant. Meanwhile, Russia and China advanced the Power of Siberia-2 pipeline, aiming to add 50 bcm of gas annually to Chinese buyers, reshaping long-term flows in Eurasia.

Technical Market Setup for Oil

The structure of oil futures reflects an uneasy balance. WTI (CL=F) rebounded strongly off $62, with intraday highs near $65.80, but resistance remains layered until $70. Brent (BZ=F) at $69.12 faces stiff barriers at $70–$73, where the 200-day EMA is positioned. Gasoline prices rose sharply, up 3.61% to $2.04 per gallon, highlighting refining tightness despite soft crude benchmarks. Mars US crude trades at $71.28, while Bonny Light collapsed 2.84% to $78.62, showing regional disparities. OPEC’s basket held at $69.65, flat on the day. Technical charts still flash consolidation rather than breakout, with RSI readings neutral and traders waiting for clarity from OPEC+ and macro signals like U.S. nonfarm payrolls.

Final Positioning on Oil

With WTI at $65.64 and Brent at $69.18, the market is caught between opportunistic Asian demand and mounting geopolitical and fiscal risks. Tariffs, sanctions, and OPEC+ caution keep prices capped, while support at $62 for WTI and $68 for Brent prevents deeper selloffs. Oil’s near-term path depends on whether buyers can sustain momentum above technical ceilings or whether renewed oversupply pushes benchmarks back toward spring lows. The geopolitical premium is alive, but structural oversupply remains a ceiling on rallies.

That’s TradingNEWS


Source link

29 09, 2025

Gold (XAU/USD) soars to fresh all-time highs in today’s session

By |2025-09-29T22:04:53+03:00September 29, 2025|Forex News, News|0 Comments


For gold bulls, current price action on the daily chart is nothing short of picture-perfect.

Blasting through multiple key levels throughout 2025, most significantly the $3,000 mark first achieved in early March, gold pricing currently trades in excess of $3,800 per troy ounce for the first time in history, growing ever closer to $4,000.

Having found a base of around $3,250, forming a slight upwards trending channel, price action in early September would break this period of consolidation and mark the start of the current rally, which, at least so far, shows little sign of exhaustion.

With that said, we are currently in ‘overbought’ territory according to the RSI and trade some distance from the trendline, suggesting that short-term retracements are possible if the uptrend wishes to continue.

As ever, data suggesting the Federal Reserve outlook is to become more dovish will likely support metal pricing further, with the opposite being true if the Fed is seen to become more hawkish ahead of their October decision.

In line with Fibonacci theory, here are some key levels to watch:


Source link

29 09, 2025

BofA raises copper price forecast for 2026 and 2027 — TradingView News

By |2025-09-29T20:03:50+03:00September 29, 2025|Forex News, News|0 Comments


Bank of America (BofA) raised its forecasts for 2026 and 2027 copper prices amid supply concerns and noted that demand is rebounding in Europe and set to stabilise in China .

The bank raised its copper price outlook for next year to $11,313 per ton from $10,188 and for 2027 to $13,500 per ton from $12,000.

Last week, Freeport-McMoRan declared force majeure at its Grasberg mine in Indonesia and said it is expecting consolidated sales to be lower for copper in the third quarter. Grasberg is the world’s second-largest copper mine after Escondida in Chile.

“The issues at Freeport’s Grasberg mine alone could increase next year’s deficit by 270,000 tons,” said BofA in a note dated Sunday. It added that this year’s mine supply is likely to fall short of nearly every forecast made over the past 15 years.

BofA said its real-time demand tracker shows European demand bottoming out, signalling gradual economic improvement, while demand in top consumer China is expected to stabilise.

Data showed that China’s industrial profits returned to growth in August even as businesses braced for a broader economic slowdown.

The note also flagged that London Metal Exchange warehouses have been running dry for some time, with the shortage worsening as spare tonnages were diverted to the U.S. ahead of expected trade restrictions that ultimately didn’t materialise.

“The tonnages in the U.S. are held under warehouse financing deals, so will in all likelihood only become available, when the market pays up. All this also raises the risk of periodic short squeezes on LME, which could push nearby prices violently higher,” it added.

In July, the U.S. announced a 50% tariff on copper pipes and wiring but details of the levy fell short of the sweeping restrictions expected and left out copper input materials such as ores, concentrates and cathodes.

Benchmark three-month copper HG1! on the LME added 2.3% to $10,411 a metric ton as of 14:21 GMT.


Source link

29 09, 2025

XAU/USD resumes the upside, fresh record highs and counting

By |2025-09-29T14:00:45+03:00September 29, 2025|Forex News, News|0 Comments


  • Gold kicks off the US Nonfarm Payrolls week with a bang, printing fresh record highs.   
  • US Dollar loses further ground on US government shutdown fears, Fed easing prospects.   
  • Technically, Gold appears a ‘buy-the-dips’ trade amid extreme overbought conditions.

Gold has resumed its record-setting rally, setting off a new week with a bang, as buyers challenge the $3,800 hurdle for the first time ever.

Gold capitalizes on US government shutdown fears

Investors scurry for safety in the traditional store of value, Gold, as fears over a US government shutdown, heading into the first day of the government’s 2026 fiscal year on October 1, intensify, weighing on the demand for the US Dollar (USD).

Traders also remain wary about whether the September US labor market report will be published if the US government shuts down.

Meanwhile, markets pay little attention to an Axios report, citing that US President Donald Trump and his Israeli counterpart Benjamin Netanyahu near a Gaza peace agreement, although Hamas approval seems pending. The report is not yet confirmed by official sources.

Last week, a slew of encouraging US data releases showed the economic resilience, pushing back against expectations of two US Federal Reserve (Fed) interest rate cuts this year.

Markets are now pricing in about 40 basis points (bps) worth of easing by December, according to Refinitiv’s USD interest rate probabilities.

Attention now turns to figures on Job Openings, private payrolls, the ISM Manufacturing and Services PMIs ahead of Friday’s Nonfarm Payrolls (NFP) for further clues on the health of the US economy, which will help reprice markets’ expectations of future Fed rate cuts, in turn, influencing the USD-denominated and non-interest-bearing Gold.

In the meantime, trade and geopolitical headlines will likely drive the Gold price action alongside speeches from Fed officials.

Gold price technical analysis: Daily chart

Technically, buyers appear defiant even as the 14-day Relative Strength Index (RSI) moves deeper within the extreme overbought region.

The leading indicator currently trades at 77, pointing north at the start of the week.

Buyers need acceptance above the $3,800 psychological level on a daily closing basis to provide extra legs to the revival of the record rally.

The next topside hurdle is located at the $3,850 barrier.

A sustained and decisive break above the latter could fuel a fresh advance toward the $3,880 region.

On the flip side, initial support is seen at the intraday low of $3,756, below which the September 24 low at $3,718 could offer some comfort to buyers.

Further down, the $3,650 psychological barrier would act as a tough nut to crack for sellers.

Nonfarm Payrolls FAQs

Nonfarm Payrolls (NFP) are part of the US Bureau of Labor Statistics monthly jobs report. The Nonfarm Payrolls component specifically measures the change in the number of people employed in the US during the previous month, excluding the farming industry.

The Nonfarm Payrolls figure can influence the decisions of the Federal Reserve by providing a measure of how successfully the Fed is meeting its mandate of fostering full employment and 2% inflation.
A relatively high NFP figure means more people are in employment, earning more money and therefore probably spending more. A relatively low Nonfarm Payrolls’ result, on the either hand, could mean people are struggling to find work.
The Fed will typically raise interest rates to combat high inflation triggered by low unemployment, and lower them to stimulate a stagnant labor market.

Nonfarm Payrolls generally have a positive correlation with the US Dollar. This means when payrolls’ figures come out higher-than-expected the USD tends to rally and vice versa when they are lower.
NFPs influence the US Dollar by virtue of their impact on inflation, monetary policy expectations and interest rates. A higher NFP usually means the Federal Reserve will be more tight in its monetary policy, supporting the USD.

Nonfarm Payrolls are generally negatively-correlated with the price of Gold. This means a higher-than-expected payrolls’ figure will have a depressing effect on the Gold price and vice versa.
Higher NFP generally has a positive effect on the value of the USD, and like most major commodities Gold is priced in US Dollars. If the USD gains in value, therefore, it requires less Dollars to buy an ounce of Gold.
Also, higher interest rates (typically helped higher NFPs) also lessen the attractiveness of Gold as an investment compared to staying in cash, where the money will at least earn interest.

Nonfarm Payrolls is only one component within a bigger jobs report and it can be overshadowed by the other components.
At times, when NFP come out higher-than-forecast, but the Average Weekly Earnings is lower than expected, the market has ignored the potentially inflationary effect of the headline result and interpreted the fall in earnings as deflationary.
The Participation Rate and the Average Weekly Hours components can also influence the market reaction, but only in seldom events like the “Great Resignation” or the Global Financial Crisis.


Source link

29 09, 2025

The CADCHF declines slowly– Forecast today – 29-9-2025

By |2025-09-29T11:59:50+03:00September 29, 2025|Forex News, News|0 Comments


The EURJPY pair didn’t succeed in reaching the extra positive stations, affected by its neediness to the positive momentum, which forces it to settle below the barrier at 175.20, forming correctional waves by its stability near 174.65.


We expect providing mixed trading due to stochastic attempt to exit the overbought level, but it didn’t affect the main bullish trend, due to the stability of the trading within the bullish channel levels, by forming 173.45 level as an important extra support, therefore, we recommend waiting for breaching the barrier, to open the way for reaching extra positive stations, that are located near 176.00 reaching 176.95.


The expected trading range for today is between 174.20 and 175.20


Trend forecast: Sideways 


Source link

Go to Top