Copper price surrendered to the positivity of the moving average55, which represents extra support near $4.5400, to begin recovering some of the losses by its current rally towards $4.6300, this rebound will not threat the negative track, due to the main stability below the resistance at $4.9100, besides 50% Fibonacci correction level attempt to form an extra barrier at $4.6600.
And that makes us wait for gathering negative momentum to ease the mission of holding below the moving average 55, then targeting more negative stations by reaching $4.4500 reaching the next main target at $4.3100.
The expected trading range for today is between $4.6600 and $4.4500
Trend forecast: Bearish
Do you need help in trading decisions? Do you want to learn how to start trading?
Join Economies.com VIP Club and benefit from over 15 years of market analysis expertise and get:
Full coverage of commodities such as gold, oil, silver, and more
Full coverage of all major forex currency pairs
Full coverage of key global indices and stocks
Full coverage of major cryptocurrencies and meme coins
Accurate analysis and daily updated price forecasts
Exclusive and breaking news
Reliable trading ranges for effective risk management
Comprehensive educational materials, competitions and prizes!
Innovative tools to enhance your trading performance
Special Offer: Subscribe to the Economies.com VIP channel and get also a free subscription to a trusted trading signals channel provided by Best Trading Signal.
Silver Follows Gold Higher as Rate Cut Hopes Build
Silver (XAG/USD) tracked gold’s momentum, trading at $32.62 and reaching an intra-day high of $32.71. The metal is benefiting from renewed interest in precious metals amid softening U.S. macroeconomic data.
This week’s ADP employment report signaled weakening private-sector job growth, while initial jobless claims jumped to 241,000, marking the highest reading since February.
The ISM Manufacturing PMI also remained in contraction at 48.7, underscoring broad economic deceleration.
Stronger Dollar, Trade Talks Cap Upside Momentum
Despite the rally, gains in gold remain capped as the U.S. Dollar Index (DXY) holds near a three-week high. Optimism over renewed trade negotiations between the U.S. and China—following remarks from China’s Commerce Ministry—has lent support to the greenback, dampening safe-haven demand.
“The stronger dollar is temporarily capping gains in bullion,” said a Hong Kong-based metals strategist. “But if the NFP misses, we could see a breakout above $3,270.”
Markets Price in Four Fed Rate Cuts by Year-End
According to CME FedWatch Tool data, markets are now pricing in four 25-basis-point rate cuts by December. With inflation cooling and labor data softening, the Fed may be forced to act sooner than initially projected.
Gold price is set to book its third weekly gain on Friday, consolidating near two-week lows.
The US Dollar pauses its recovery mode ahead of the key US Nonfarm Payrolls test.
Technically, the 21-day SMA guards the downside amid bullish daily RSI after the rising channel breakdown.
Gold price is nursing weekly losses early Friday, and it is on track to book its worst week in over two months. Gold buyers refuse to give up, anticipating the high-impact US Nonfarm Payrolls (NFP) data due later this Friday for a fresh directional impetus.
Gold price eyes the US NFP report for some reprieve
Gold price is off the two-week lows of $3,202 set on Thursday, licking its wounds as traders refrain from placing any fresh directional bets heading into the key event risk for Friday – the US labor market report.
The US Dollar (USD) has been on a roll higher this week, thanks to easing trade tensions globally, with the US optimistic about reaching trade deals with its major Asian trading partners, including China.
Risk sentiment received a fresh lift earlier on after the local media reported the Chinese Commerce Ministry as saying that “the US has recently sent messages to China through relevant parties, hoping to start talks with China,”
“China is currently evaluating this,” the Ministry added.
Further, easing US economic growth concerns also underpinned the sentiment around the Greenback, rendering it negative for the USD-denominated Gold price. Data showed on Thursday that the ISM manufacturing PMI fell to 48.7 in April from 49.0 in March, against expectations for a bigger fall to 48.
Early Friday,markets seem to have resorted to their position adjustments in the US Dollar, leading to a pause in its recent uptrend, while the bright metal also draws some support from the Russia-Ukraine geopolitical stand-off.
Attention now turns toward the US NFP data release for the next big action in the Gold price and the King Dollar.
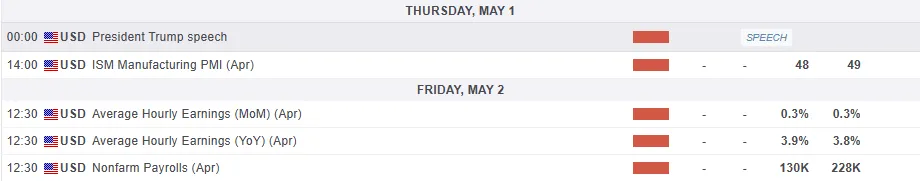
Markets expect the US NFP to show a 130,000 job gain in April, down from a stellar 228,000 job creations reported in March. The Unemployment Rate is set to remain steady at 4.2% in the same period.
If the headline NFP prints a reading below the 100,000 level, it could refuel concerns over the impact of tariffs on ŪS labor market. This narrative could double down on the US Federal Reserve’s (Fed) easing prospects, triggering a fresh US Dollar downside while rescuing the Gold price.
On the other hand, a positive surprise above the 200,000 figure could add extra legs to the Gold price correction, pushing back against expectations of a June interest rate cut and boosting the USD further.
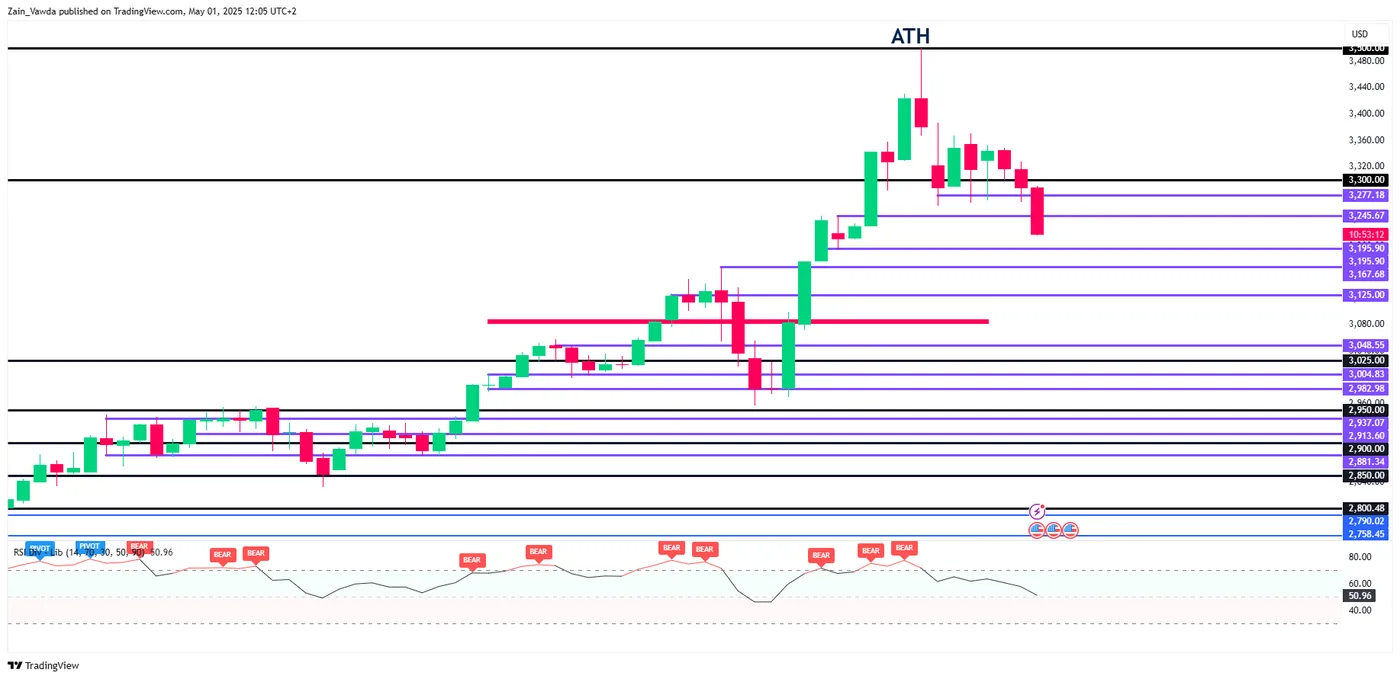
Gold price technical analysis: Daily chart
Gold price clings to the critical 21-day Simple Moving Average (SMA) support, now at $3,234, pausing the correction accentuated by the downside break of a three-week-long rising channel on Wednesday.
The 14-day Relative Strength Index (RSI) sits just above the midline near 52.50, having ended its descent.
Therefore, a rebound toward the immediate static support-turned-resistance at $3,260 could be seen if the 21-day SMA holds on a weak US NFP report.
Acceptance above that level will prompt Gold buyers to flex their muscles toward the channel support (now resistance) at $3,405.
Ahead of that, the $3,350 could be a tough nut to crack.
If the US jobs data exceeds expectations by a wide margin, Gold sellers crack the 21-day SMA at $3,234 on a sustained basis, opening doors toward the $3,150 psychological level.
The 50-day SMA at $3,087 will be next on their radars.
Economic Indicator
Nonfarm Payrolls
The Nonfarm Payrolls release presents the number of new jobs created in the US during the previous month in all non-agricultural businesses; it is released by the US Bureau of Labor Statistics (BLS). The monthly changes in payrolls can be extremely volatile. The number is also subject to strong reviews, which can also trigger volatility in the Forex board. Generally speaking, a high reading is seen as bullish for the US Dollar (USD), while a low reading is seen as bearish, although previous months’ reviews and the Unemployment Rate are as relevant as the headline figure. The market’s reaction, therefore, depends on how the market assesses all the data contained in the BLS report as a whole.
Gold price remains on the defensive near $3,235 in Friday’s early Asian session.
De-escalation in the global trade conflict continues to undermine the Gold price.
Traders brace for the US April employment report, which is due later on Friday.
The Gold price (XAU/USD) edges lower to a two-week low near $3,235 during the early Asian session on Friday. The easing of trade tensions between the US and its trading partners has dented the safe-haven demand, weighing on the precious metal.
US President Donald Trump announced potential trade deals with India, South Korea, and Japan, seeking to convert his tariff policy into trade agreements. Furthermore, Chinese state media said late Thursday that the US has reached out toChina to begin trade talks regarding Trump’s 145% tariffs.
The US Dollar (USD) strengthens due to this positive development, which makes gold less attractive to other currency buyers. “Market sees trade tensions de-escalating and is less concerned about the Fed independence, reducing the demand for safe-haven assets for now,” said UBS analyst Giovanni Staunovo.
Following the weaker-than-expected US Q1 Gross Domestic Product (GDP) released on Wednesday, the markets are now pricing higher chances of more Federal Reserve (Fed) rate cuts, although everything hinges on trade deals. This, in turn, might boost the non-yielding Gold price.
The US April employment report will be the highlight later on Friday as it might propel the US Fed to start cutting rates sooner rather than later. If the report shows a weaker outcome, this could weigh on the USD and cap the downside for the USD-denominated commodity price.
Gold FAQs
Gold has played a key role in human’s history as it has been widely used as a store of value and medium of exchange. Currently, apart from its shine and usage for jewelry, the precious metal is widely seen as a safe-haven asset, meaning that it is considered a good investment during turbulent times. Gold is also widely seen as a hedge against inflation and against depreciating currencies as it doesn’t rely on any specific issuer or government.
Central banks are the biggest Gold holders. In their aim to support their currencies in turbulent times, central banks tend to diversify their reserves and buy Gold to improve the perceived strength of the economy and the currency. High Gold reserves can be a source of trust for a country’s solvency. Central banks added 1,136 tonnes of Gold worth around $70 billion to their reserves in 2022, according to data from the World Gold Council. This is the highest yearly purchase since records began. Central banks from emerging economies such as China, India and Turkey are quickly increasing their Gold reserves.
Gold has an inverse correlation with the US Dollar and US Treasuries, which are both major reserve and safe-haven assets. When the Dollar depreciates, Gold tends to rise, enabling investors and central banks to diversify their assets in turbulent times. Gold is also inversely correlated with risk assets. A rally in the stock market tends to weaken Gold price, while sell-offs in riskier markets tend to favor the precious metal.
The price can move due to a wide range of factors. Geopolitical instability or fears of a deep recession can quickly make Gold price escalate due to its safe-haven status. As a yield-less asset, Gold tends to rise with lower interest rates, while higher cost of money usually weighs down on the yellow metal. Still, most moves depend on how the US Dollar (USD) behaves as the asset is priced in dollars (XAU/USD). A strong Dollar tends to keep the price of Gold controlled, whereas a weaker Dollar is likely to push Gold prices up.
Ethereum price (ETHUSD) rose in its last intraday trading, settled above the resistance at $1.800, to move in its way to confirm breaching this stubborn resistance, and we are still waiting for a good close above it, while the continuation of the positive support due to its trading above EMA50, with the emergence of the positive signals on the (RSI).
Therefore, our expectations suggest (ETHUSD) price rise in their upcoming trading on the intraday levels, conditioned by its stability above $1,800, to target the next main resistance at $1,900.
The expected trading range for today is between $1,750 support and $1,865 resistance.
Today’s forecast: Bullish
Do you need help in trading decisions? Do you want to learn how to start trading?
Join Economies.com VIP Club and benefit from over 15 years of market analysis expertise and get:
Full coverage of commodities such as gold, oil, silver, and more
Full coverage of all major forex currency pairs
Full coverage of key global indices and stocks
Full coverage of major cryptocurrencies and meme coins
Accurate analysis and daily updated price forecasts
Exclusive and breaking news
Reliable trading ranges for effective risk management
Comprehensive educational materials, competitions and prizes!
Innovative tools to enhance your trading performance
Special Offer: Subscribe to the Economies.com VIP channel and get also a free subscription to a trusted trading signals channel provided by Best Trading Signal.
De-escalating global trade tensions backed demand for the US Dollar.
Wall Street extends its Wednesday recovery in thin market conditions.
XAU/USD trades at fresh two-week lows just above the $3,200 mark.
Gold price edged lower on Thursday, trading at fresh two-week highs just above the $3,200 mark. De-escalating global trade tensions backed demand for the US Dollar (USD) despite mixed first-tier figures released in the last two sessions. Stocks also benefited from the better mood, with Wall Street extending Wednesday’s rally.
Most Asian and European markets were closed amid the celebration of Labor Day, but the United States (US) ones worked normally. The country released some mixed data, as Initial Jobless Claims for the week ended April 26 rose by 241K, worse than the 224K anticipated and the previous weekly figure of 223K. The April ISM Manufacturing Purchasing Managers’ Index (PMI), on the contrary, posted 48.7, down from the 49 posted in March, but better than the 48 expected.
Earlier in the day, US President Donald Trump noted progress on talks with some Asian countries, including India and Japan. Regarding China, Trump stated that there’s a “very good” chance of making a deal with China, yet added that any deal with Beijing has to be in US terms. Meanwhile, a Beijing-backed outlet reported on Thursday that United States officials have contacted their Chinese counterparts for talks.
Finally, White House trade advisor Peter Navarro down-talked data, saying, “I got to say just one thing about today’s news, that’s the best negative print I have ever seen in my life,” while saying he likes “where we’re at now.”
The week will end with the release of the US Nonfarm Payrolls (NFP) report. The country is expected to have added 130K new job positions in April, while the Unemployment Rate is foreseen at 4.2%, unchanged from March. Employment-related data ahead of the NFP report, however, hints at a soft reading, which may end up weighing on the USD.
XAU/USD short-term technical outlook
From a technical point of view, the daily chart for XAU/USD shows that the risk skews to the downside. The pair is down for a third consecutive day, piercing a mildly bullish 20 Simple Moving Average (SMA) currently at around $3,232.10. The 100 and 200 SMAs maintain their upward slopes far below the current level, yet technical indicators head firmly south, approaching their midlines from above. Selling interest seems strong, and a break below $3,200 should open the door for a continued slide.
In the near term, and according to the 4-hour chart, the XAU/USD pair is poised to extend its slide. After meeting sellers around a mildly bullish 20 SMA, Gold slid below its 100 SMA, which, anyway, maintains its upward slope. Finally, technical indicators resumed their slides within negative levels, anticipating lower lows ahead.
Support levels: 3,200.00 3,188.30 3,176.40
Resistance levels: 3,232.10 3,245.20 3,261.70
Tariffs FAQs
Tariffs are customs duties levied on certain merchandise imports or a category of products. Tariffs are designed to help local producers and manufacturers be more competitive in the market by providing a price advantage over similar goods that can be imported. Tariffs are widely used as tools of protectionism, along with trade barriers and import quotas.
Although tariffs and taxes both generate government revenue to fund public goods and services, they have several distinctions. Tariffs are prepaid at the port of entry, while taxes are paid at the time of purchase. Taxes are imposed on individual taxpayers and businesses, while tariffs are paid by importers.
There are two schools of thought among economists regarding the usage of tariffs. While some argue that tariffs are necessary to protect domestic industries and address trade imbalances, others see them as a harmful tool that could potentially drive prices higher over the long term and lead to a damaging trade war by encouraging tit-for-tat tariffs.
During the run-up to the presidential election in November 2024, Donald Trump made it clear that he intends to use tariffs to support the US economy and American producers. In 2024, Mexico, China and Canada accounted for 42% of total US imports. In this period, Mexico stood out as the top exporter with $466.6 billion, according to the US Census Bureau. Hence, Trump wants to focus on these three nations when imposing tariffs. He also plans to use the revenue generated through tariffs to lower personal income taxes.
Nonetheless, natural gas is in a counter-trend rally within a bearish trend structure. It is rising into multiple potential resistance areas. How it behaves around those price levels should leave clues about what may come next. In general, once the 20-Day line is reclaimed, the 50-Day MA becomes a potential upside target. The 50-Day MA is now at $3.81 and falling. It is a little above potential resistance around an AVWAP level at $3.75, anchored at the top of the trend.
Bullish Reversal Week Signals Strength
A bullish weekly reversal triggered this week indicating that a higher swing low has been established for the long-term uptrend and showing the buyers in charge. The uptrend can be defined as a rising parallel trend channel. It is interesting to observe that the middle line of the rising channel (dashed) is rapidly being approached for a test as resistance.
There is a weekly high at $3.61 that can be used as a proxy for the line. If that high can be exceeded, the $3.75 AVWAP level and 50-Day MA become the next upside targets, and it would be another sign of strength on the weekly time frame. A daily close above that weekly high would further confirm strength and increase the chance that natural gas could keep rising.
AVAP Line Showed Support
Note that yesterday support was found at the AVWAP line (light blue) from the recent bottom. Therefore, it may identify support in the future. Short-term support is now around the 20-Day MA and today’s low, which was $3.34.
For a look at all of today’s economic events, check out our economic calendar.
Silver price bounces back to near $32.50 despite the sheer strength in the US Dollar.
The USD gains after the release of the US ISM Manufacturing PMI data for April.
The White House has expressed confidence that it will close trade deals with some trading partners in the coming weeks.
Silver price (XAG/USD) recovers a majority of its early losses and returns to near $32.50 during North American trading hours on Thursday. The white metal gained ground after posting a fresh over two-week low around $31.66, earlier in the day, even though the US Dollar (USD) has extended its two-day recovery.
US Dollar PRICE Today
The table below shows the percentage change of US Dollar (USD) against listed major currencies today. US Dollar was the strongest against the Japanese Yen.
USD
EUR
GBP
JPY
CAD
AUD
NZD
CHF
USD
0.37%
0.25%
1.54%
0.23%
0.21%
0.35%
0.72%
EUR
-0.37%
-0.12%
1.13%
-0.17%
-0.14%
-0.02%
0.33%
GBP
-0.25%
0.12%
1.26%
-0.02%
-0.03%
0.10%
0.46%
JPY
-1.54%
-1.13%
-1.26%
-1.30%
-1.29%
-1.22%
-0.87%
CAD
-0.23%
0.17%
0.02%
1.30%
0.00%
0.12%
0.48%
AUD
-0.21%
0.14%
0.03%
1.29%
-0.00%
0.12%
0.50%
NZD
-0.35%
0.02%
-0.10%
1.22%
-0.12%
-0.12%
0.36%
CHF
-0.72%
-0.33%
-0.46%
0.87%
-0.48%
-0.50%
-0.36%
The heat map shows percentage changes of major currencies against each other. The base currency is picked from the left column, while the quote currency is picked from the top row. For example, if you pick the US Dollar from the left column and move along the horizontal line to the Japanese Yen, the percentage change displayed in the box will represent USD (base)/JPY (quote).
Technically, a higher US Dollar makes the Silver price an expensive bet for investors.
The US Dollar Index (DXY), which tracks the Greenback’s value against six major currencies, jumps above 100.00. The USD strengthens even though the United States (US) ISM Manufacturing PMI data for April has shown that activities declined at a faster pace. The Manufacturing PMI is down at 48.7 from 49.0 in March but higher than estimates of 48.0.
Meanwhile, ISM Manufacturing Prices Paid, which gauges change in input cost, expanded at a faster pace to 69.8 from 69.4, but missed estimates of 70.3. Accelerating input costs are expected to feed consumer inflation. Such a scenario will limit the Federal Reserve (Fed) from reducing interest rates, which bodes poorly for non-yielding assets, such as Silver.
Earlier in the day, the Silver price fell sharply as investors expected that fears of additional tariffs announced by US President Donald Trump have peaked as Washington is close to announcing a bilateral trades with number of its trading partners soon.
“Initial trade deals are to be announced in weeks, not months,” US Trade Representative Jamieson Greer said at Fox News, Reuters reported.
However, trade uncertainty between the US and China will keep the downside in the Silver price limited.
Silver technical analysis
Silver price struggles to revisit an over three-week high around $33.70. The near-term outlook of the white metal has become uncertain as it falls below the 20-day Exponential Moving Average (EMA), which trades around $32.65.
The 14-day Relative Strength Index (RSI) falls below 50.00 after failing to break above 60.00, indicating that investors are not bullish anymore.
Looking up, the March 28 high of $34.60 will act as key resistance for the metal. On the downside, the April 11 low of $30.90 will be the key support zone.
Silver daily chart
Silver FAQs
Silver is a precious metal highly traded among investors. It has been historically used as a store of value and a medium of exchange. Although less popular than Gold, traders may turn to Silver to diversify their investment portfolio, for its intrinsic value or as a potential hedge during high-inflation periods. Investors can buy physical Silver, in coins or in bars, or trade it through vehicles such as Exchange Traded Funds, which track its price on international markets.
Silver prices can move due to a wide range of factors. Geopolitical instability or fears of a deep recession can make Silver price escalate due to its safe-haven status, although to a lesser extent than Gold’s. As a yieldless asset, Silver tends to rise with lower interest rates. Its moves also depend on how the US Dollar (USD) behaves as the asset is priced in dollars (XAG/USD). A strong Dollar tends to keep the price of Silver at bay, whereas a weaker Dollar is likely to propel prices up. Other factors such as investment demand, mining supply – Silver is much more abundant than Gold – and recycling rates can also affect prices.
Silver is widely used in industry, particularly in sectors such as electronics or solar energy, as it has one of the highest electric conductivity of all metals – more than Copper and Gold. A surge in demand can increase prices, while a decline tends to lower them. Dynamics in the US, Chinese and Indian economies can also contribute to price swings: for the US and particularly China, their big industrial sectors use Silver in various processes; in India, consumers’ demand for the precious metal for jewellery also plays a key role in setting prices.
Silver prices tend to follow Gold’s moves. When Gold prices rise, Silver typically follows suit, as their status as safe-haven assets is similar. The Gold/Silver ratio, which shows the number of ounces of Silver needed to equal the value of one ounce of Gold, may help to determine the relative valuation between both metals. Some investors may consider a high ratio as an indicator that Silver is undervalued, or Gold is overvalued. On the contrary, a low ratio might suggest that Gold is undervalued relative to Silver.
Natural gas price failed to resume the bullish attack, affected by a stochastic attempt to exit the overbought level, which forces it to provide sideways trading by its stability near $3.400, note that the price might form a temporary negative rebound, to target $2.280 level before any attempt to renew the bullish attempts in the current period.
While its rally above the $3.480 level and providing a positive close will reinforce the chances for resuming the bullish attack, to keep waiting for recording the main targets near $3.540 and $3.610.
The expected trading range for today is between $3.280 and $3.450
Trend forecast: Fluctuated
Do you need help in trading decisions? Do you want to learn how to start trading?
Join Economies.com VIP Club and benefit from over 15 years of market analysis expertise and get:
Full coverage of commodities such as gold, oil, silver, and more
Full coverage of all major forex currency pairs
Full coverage of key global indices and stocks
Full coverage of major cryptocurrencies and meme coins
Accurate analysis and daily updated price forecasts
Exclusive and breaking news
Reliable trading ranges for effective risk management
Comprehensive educational materials, competitions and prizes!
Innovative tools to enhance your trading performance
Special Offer: Subscribe to the Economies.com VIP channel and get also a free subscription to a trusted trading signals channel provided by Best Trading Signal.
US GDP contracts in Q1 2025, but tariff developments overshadow data releases.
Key support levels for Gold (XAU/USD) are identified as bearish pressure builds, with 3200 and 3167 being crucial
Gold prices have slipped below two crucial areas of support as hopes of a trade deal between the US-China continues to grow. The precious metal is now trading near a two-week low.
Risk appetite and sentiment continues to improve on rising hopes that a trade deal between the US-China will be reached. According to reports from both Bloomberg and the Financial Times, the Trump administration has reportedly tried reaching out to Beijing to start tariff talks, according to a Chinese state-run media outlet.
The outlet stated that China isn’t in a rush to negotiate and won’t engage unless the US takes meaningful actions. However, it added that there’s no harm for China in talking if the US wants to. Analysts noted this language shows a softer stance from Beijing compared to last week, when China’s commerce ministry said negotiations couldn’t begin until the US removed its heavy tariffs.
The result of this growing optimism has definitely weighed on safe haven demand and thus pushed Gold prices lower.
US GDP contracts in Q1
The U.S. economy shrank by 0.3% in the first quarter of 2025, its first decline since early 2022. This was a sharp drop from 2.4% growth in the previous quarter and missed market predictions of 0.3% growth.
A 41.3% jump in imports played a big role in slowing the economy, as businesses and consumers stocked up on goods ahead of higher costs from new tariffs announced by the Trump administration. Consumer spending grew just 1.8%, its slowest pace since mid-2023, and federal government spending fell by 5.1%, the biggest drop since early 2022. However, fixed investment rose by 7.8%, the largest increase since mid-2023.
The impact saw the US Dollar weaken as recession fears gained momentum. Gold prices also enjoyed a rally but as we have noted of late, tariff developments will overshadow data releases in the short-term.
Gold failed to hold onto gains and experienced a swift selloff in the Asian session as it failed to consolidate gains above the $3300/oz handle.
Looking ahead
There remains a significant amount of high impact data releases for the US this week, with the NFP release tomorrow taking center stage.
Even if the data disappoints, the chances of a stellar Gold recovery may not be forthcoming. As long as sentiment and risk appetite continues to improve Gold bulls will face significant headwinds.
For all market-moving economic releases and events, see the MarketPulse Economic Calendar. (click to enlarge)
Technical Analysis – Gold (XAU/USD)
From a technical analysis standpoint, Gold prices have failed to hold above crucial support at the $3300/oz handle.
A daily candle close below the 3300 handle yesterday has led to an accelerated selloff in the Asian session. This has continued after the European open with the precious metal trading at 3220 at the time of writing.
Looking at the period-14 RSI and it is approaching the neutral 50 level which could prove key. A bounce here could be a sign that bullish momentum remains intact and thus facilitate a short-term recovery.
The precious metal is down around $60 on the day and yet a push toward support at the 3200 handle looks likely.
A crucial level of support i will be keeping an eye on rests at 3167, which was the April 3 swing high, just after the universal tariff announcements. This level could hold the key, and have a big impact on whether the precious metal is able to hold above the crucial 3000 handle.

 & Silver Price Forecast: Breakout or Rejection? NFP Could Decide Trend")


 Forecast: Gold Faces Headwinds as Risk Appetite Improves")