The main tag of Gold News Today Articles.
You can use the search box below to find what you need.
[wd_asp id=1]

18 08, 2026

Coffee prices today, August 13: Continuing the downward trend

By |2026-08-18T00:07:42+03:00August 18, 2026|Forex News, News|0 Comments


Domestic coffee prices today

Coffee prices today in the domestic market continue to decline. According to giacaphe. com, the average coffee price on August 13 was 96,900 VND/kg, down 500 VND/kg compared to the previous session.

In Dak Lak, coffee prices were recorded at 96,800 VND/kg, down 500 VND/kg.

In Lam Dong, coffee prices reached 96,300 VND/kg, down 500 VND/kg. This is the lowest level among the surveyed areas.

In Gia Lai, coffee price is at 96,800 VND/kg, down 500 VND/kg.

The old Dak Nong area recorded a level of 97,000 VND/kg, down 500 VND/kg. This is the highest level in today’s price list.

The USD/VND exchange rate according to Vietcombank was recorded at 25,920 VND/USD, unchanged compared to the previous closing session.

World coffee prices

In the world market, coffee prices increase and decrease interspersed.

According to Barchart, the September 2026 Arabica futures contract closed up 4.35 US cents/lb, equivalent to 1.30%. In the opposite direction, the September 2026 Robusta futures contract decreased by 13 USD/ton, equivalent to 0.34%.

This development shows that the upward momentum in the world market is concentrated in all terms of Arabica coffee. Meanwhile, Robusta – a group that has a more direct impact on Vietnamese coffee prices – simultaneously decreased, creating pressure on domestic purchasing prices. The decrease is from 13-28 USD/ton, equivalent to about 0.345-0.74%, fluctuating in the range of 3,769 – 3,733 USD/ton.

Coffee price assessment

According to Barchart, Arabica coffee prices increased amid concerns that a strong earthquake in Colombia on Monday could disrupt coffee exports from the country, the world’s second largest Arabica coffee producer. Some areas affected by the magnitude 7.4 Richter earthquake are Caldas and Risaralda – coffee-growing provinces accounting for about 1/4 of Colombia’s coffee production.

In addition, Maersk transportation company said on Tuesday that operations at Buenaventura port – which processes most of Colombia’s coffee exports – have been temporarily suspended. The closure of domestic routes and traffic restrictions due to the earthquake could also affect cargo transportation.

Arabica coffee is also supported by the slow coffee harvest progress in Brazil.

Meanwhile, reduced inventory is supporting Arabica coffee prices, as Arabica coffee inventories on the ICE exchange on Wednesday fell to a 2.75-year low, to 240,285 bags. Conversely, increased inventories are putting pressure on Robusta prices, reaching 4,364 lots on Wednesday, the highest in 5 months.

The latest forecast from the USDA also puts downward pressure on coffee prices. On July 22, the USDA forecast that global coffee production in the 2026/27 crop year will increase by 6%, equivalent to an additional 10.8 million bags, to a record level of 189.7 million bags, mainly thanks to improved farming conditions in Brazil.

The USDA forecasts global Arabica production to increase by 12% over the same period, while Robusta production will decrease by 0.7%. Global inventory at the end of the period is forecast to increase by an additional 1.9 million bags, to 26.3 million bags.



Source link

17 08, 2026

Gold Price Forecast: XAU/USD holds bullish bias above key support

By |2026-08-17T20:06:27+03:00August 17, 2026|Forex News, News|0 Comments


Gold (XAU/USD) maintains a bullish bias around $4,400, supported by a weaker US Dollar (USD) and fading expectations of further interest rate hikes by the Federal Reserve (Fed). However, geopolitical risks and tensions in energy prices continue to fuel inflation concerns, limiting the precious metal’s upside for now.

In the four-hour chart below, XAU/USD holds a constructive near-term bias as it trades comfortably above the 100-period simple moving average (SMA) at $4,205.68 and the 200-period SMA at $4,142.35, keeping the broader uptrend intact. The nearby horizontal support at $4,365.00 underpins the latest consolidation, while the Relative Strength Index (RSI) at 56.32 has eased out of overbought territory and now points to moderately positive, but not stretched, momentum.

On the downside, initial support is seen at the recent floor around $4,365.00, with deeper demand emerging at the 100-period SMA near $4,205.68 and then the 200-period SMA around $4,142.35, where the broader bullish structure would be expected to reassert if tested. On the topside, a break above the horizontal resistance at $4,450.00 would open the way for renewed gains, as the absence of closer overhead technical barriers suggests that a clear move through this cap could accelerate bullish pressure.

In the one-hour chart below, XAU/USD is also holding a constructive near-term bias as price remains above the 100-period simple moving average (SMA) at $4,382.90 and the 200-period SMA at $4,324.87. This positioning suggests dips are still being bought, while the Relative Strength Index (RSI) near 56 keeps a mildly bullish tone without yet signaling overbought conditions.

Chart Analysis XAU/USD

(The technical analysis of this story was written with the help of an AI tool. Know more.)


Source link

17 08, 2026

Natural gas price pressures support – Forecast today – 17-8-2026

By |2026-08-17T16:05:28+03:00August 17, 2026|Forex News, News|0 Comments


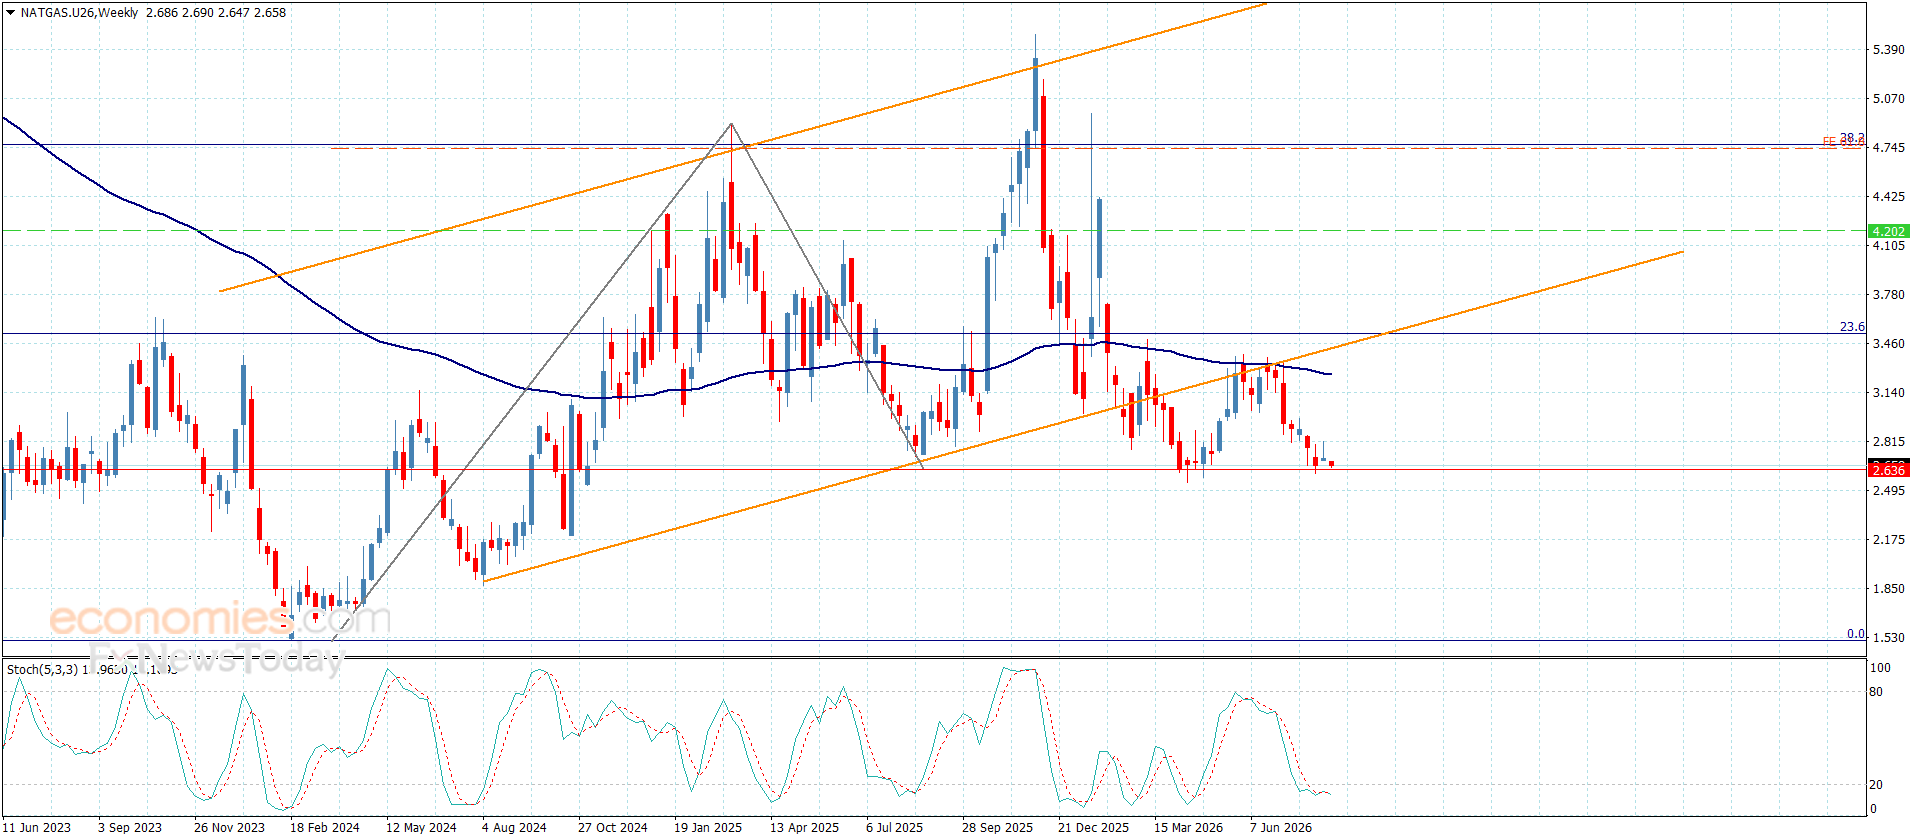
Natural gas price renewed its attempts to pressure the support level at $2.620, taking advantage of the main indicators providing negative momentum. This signals another attempt to find a way to resume the previously suggested main bearish attack.


If the required breakout occurs and the price provides a negative close below the current support, this will ease its move toward the first additional target at $2.430, followed by an attempt to reach the next target near $2.280.


The expected trading range for today is between $2.430 and $2.720


Trend forecast: Bearish


Source link

17 08, 2026

The GBPJPY price maintains its positive momentum – Forecast today – 17-8-2026

By |2026-08-17T12:04:19+03:00August 17, 2026|Forex News, News|0 Comments


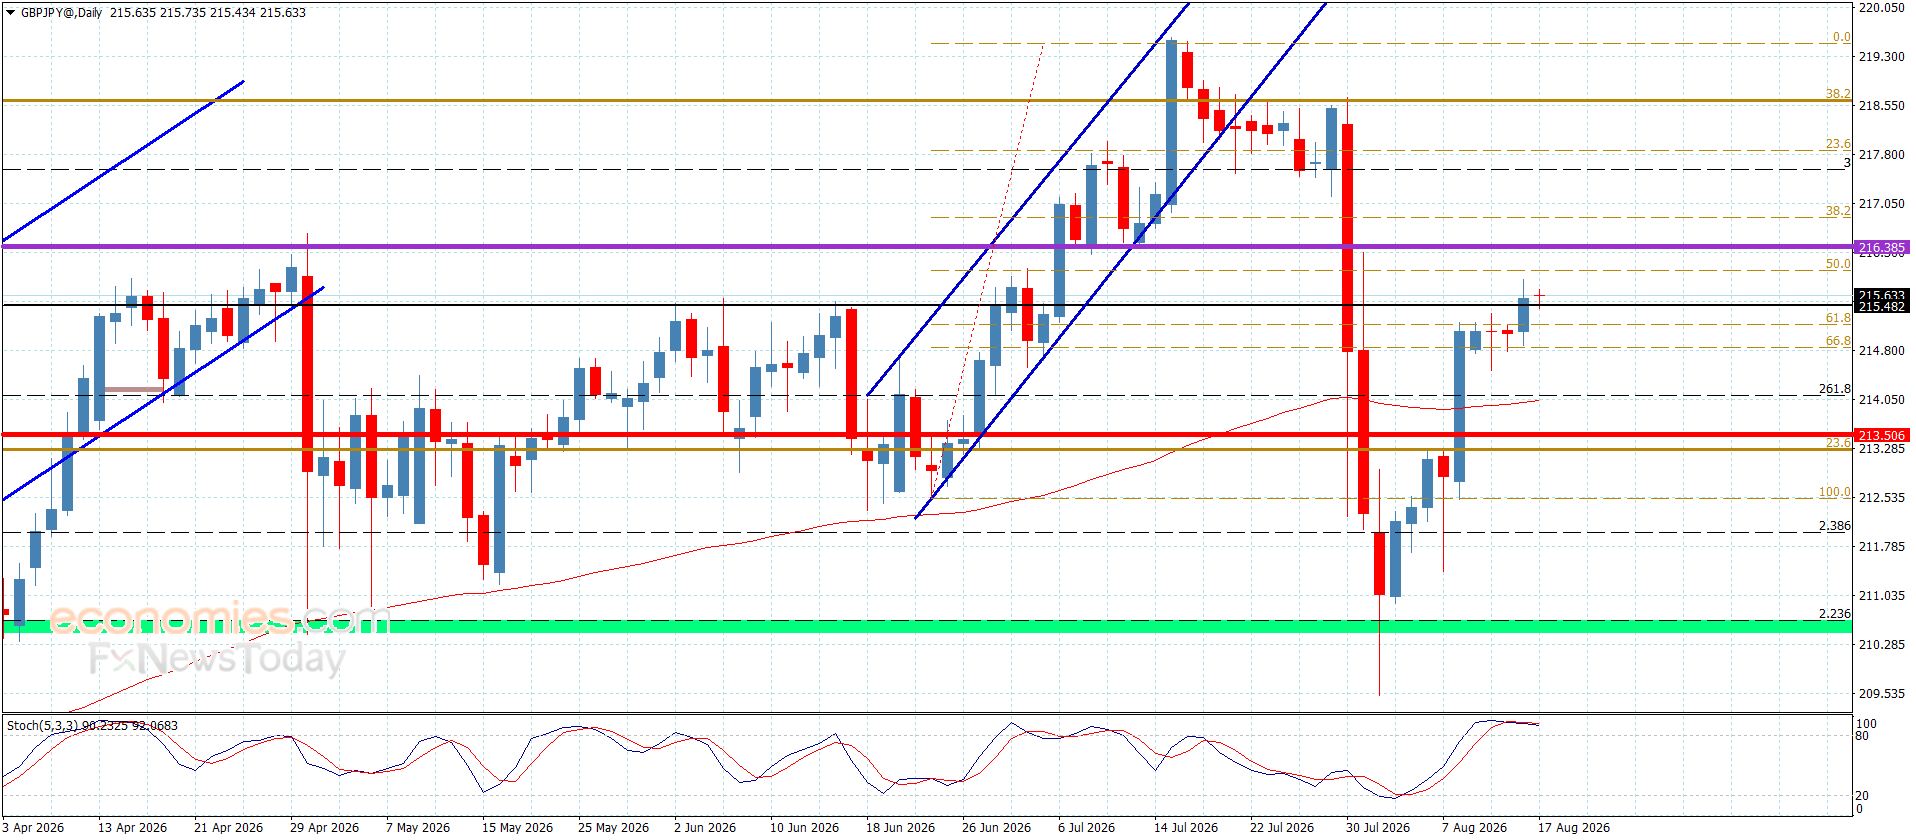
The pair’s price has provided a new positive signal by recently pushing above the established barrier at 215.50, confirming its adherence to the previously suggested bullish scenario. The price has consequently recorded some additional gains, reaching the 215.90 level.


We will currently rely on the 214.80 level as additional support and emphasize the importance of the main indicators providing positive momentum, which would facilitate the move toward the next targets, located around 216.35 and 216.85, respectively.


The expected trading range for today is between 215.10 and 216.35


Trend forecast: Bullish


Source link

17 08, 2026

Silver Forecast: XAG/USD bulls eye $66.00 and 100-day EMA breakout

By |2026-08-17T08:03:19+03:00August 17, 2026|Forex News, News|0 Comments


Silver (XAG/USD) is seen building on Friday’s bounce from mid-$63.00s and gaining some follow-through positive traction at the start of a new week. The white metal, however, continues with its struggle to break above the 100-day Exponential Moving Average (EMA) and currently trades above mid-$65.00s, up around 1.50% for the day.

The US Dollar (USD) selling bias remains unabated as traders continue to scale back Federal Reserve (Fed) rate hike bets amid signs of cooling US inflation and weak consumer spending. This, in turn, is seen as a key factor underpinning demand for USD-denominated commodities, including the XAG/USD, and backs the case for further gains.

From a broader technical perspective, the XAG/USD has been oscillating in a familiar range over the past week or so. This could be categorized as a bullish consolidation phase against the backdrop of a goodish recovery from the year-to-date low, touched in July, and the recent breakout through the 23.6% Fibonacci retracement level of the May-July downfall.

Moreover, momentum indicators stay constructive as the Relative Strength Index (RSI) hovers near 61, and the Moving Average Convergence Divergence (MACD) histogram holds in positive territory. This suggests that upside attempts could persist even as the XAG/USD struggles to make it through the 100-day EMA pivotal resistance near the $66.33 area.

The said barrier is followed by the 38.2% Fibo. level at $67.93. A sustained move above the said levels would be needed to pave the way for further gains toward the mid-range Fibonacci hurdle at $72.02. On the downside, initial support is aligned with the 23.6% Fibo. near $62.87, where a break would expose the lower anchor of the current swing near $54.70.

(The technical analysis of this story was written with the help of an AI tool. Know more.)

XAG/USD daily chart

Silver FAQs

Silver is a precious metal highly traded among investors. It has been historically used as a store of value and a medium of exchange. Although less popular than Gold, traders may turn to Silver to diversify their investment portfolio, for its intrinsic value or as a potential hedge during high-inflation periods. Investors can buy physical Silver, in coins or in bars, or trade it through vehicles such as Exchange Traded Funds, which track its price on international markets.

Silver prices can move due to a wide range of factors. Geopolitical instability or fears of a deep recession can make Silver price escalate due to its safe-haven status, although to a lesser extent than Gold’s. As a yieldless asset, Silver tends to rise with lower interest rates. Its moves also depend on how the US Dollar (USD) behaves as the asset is priced in dollars (XAG/USD). A strong Dollar tends to keep the price of Silver at bay, whereas a weaker Dollar is likely to propel prices up. Other factors such as investment demand, mining supply – Silver is much more abundant than Gold – and recycling rates can also affect prices.

Silver is widely used in industry, particularly in sectors such as electronics or solar energy, as it has one of the highest electric conductivity of all metals – more than Copper and Gold. A surge in demand can increase prices, while a decline tends to lower them. Dynamics in the US, Chinese and Indian economies can also contribute to price swings: for the US and particularly China, their big industrial sectors use Silver in various processes; in India, consumers’ demand for the precious metal for jewellery also plays a key role in setting prices.

Silver prices tend to follow Gold’s moves. When Gold prices rise, Silver typically follows suit, as their status as safe-haven assets is similar. The Gold/Silver ratio, which shows the number of ounces of Silver needed to equal the value of one ounce of Gold, may help to determine the relative valuation between both metals. Some investors may consider a high ratio as an indicator that Silver is undervalued, or Gold is overvalued. On the contrary, a low ratio might suggest that Gold is undervalued relative to Silver.


Source link

16 08, 2026

Forecast update for Gold -13-08-2026

By |2026-08-16T16:00:43+03:00August 16, 2026|Forex News, News|0 Comments


The price of gold rose slightly during its recent intraday trading, affected by the stability of the support level at $4,380, gaining bullish momentum that helped it to stop its early losses, amid the dominance of the bullish trend on the short-term basis, with the continuation of the positive pressure that comes from its trading above EMA50, reinforcing the chances of a near term recovery. The relative strength indicators reached oversold levels, exaggeratedly compared to the price move, to suggest forming bullish momentum with bullish overlapping signals.


Source link

16 08, 2026

Silver Price Forecast: XAG/USD Stalls as Rising Yields Cap Recovery | Forex News Analysis

By |2026-08-16T07:58:29+03:00August 16, 2026|Forex News, News|0 Comments


BitcoinWorld

Silver Price Forecast: XAG/USD Stalls as Rising Yields Cap Recovery

Silver (XAG/USD) is struggling to extend its recovery, with prices stalling as rising US Treasury yields continue to cap upside momentum. As of [current date], spot silver trades near [current price] after failing to hold recent gains, reflecting a market caught between safe-haven demand and yield-driven headwinds.

Why are Treasury yields pressuring silver?

Silver, like gold, is a non-yielding asset, so rising Treasury yields increase the opportunity cost of holding it. The recent uptick in yields, particularly on the US 10-year note, has strengthened the US dollar and weighed on precious metals. This dynamic has kept silver’s recovery attempts shallow, with each rally met by fresh selling interest.

Technical outlook: Key levels to watch

From a technical standpoint, silver is hovering near a critical support zone. The immediate support is seen around the $[support level] area, with a break below that opening the door to the next downside target at $[next support]. On the upside, resistance is located at $[resistance level], and a daily close above that level would signal a more meaningful recovery. However, as long as yields remain elevated, the path of least resistance appears to be lower.

Market context and implications

The current stall in silver’s recovery reflects a broader consolidation phase in the precious metals complex. Investors are balancing expectations of Federal Reserve policy with global growth concerns. If yields continue to climb, silver could face renewed selling pressure, but any dovish signal from the Fed or a risk-off shift in markets could quickly revive demand for the metal.

Conclusion

Silver’s price action remains subdued as Treasury yields cap recovery attempts. Traders should monitor yield movements and key technical levels for the next directional cue. Until the macro backdrop shifts, silver is likely to remain range-bound with a bearish tilt.

FAQs

Q1: What is the current silver price forecast?
Silver is currently stalling as rising Treasury yields limit upside. The short-term outlook is mixed, with key support and resistance levels to watch.

Q2: How do Treasury yields affect silver prices?
Higher yields increase the opportunity cost of holding non-yielding assets like silver, making it less attractive to investors and typically putting downward pressure on prices.

Q3: What are the key support and resistance levels for XAG/USD?
Immediate support is near $[support level], with resistance at $[resistance level]. A break of these levels will likely determine the next trend.

This post Silver Price Forecast: XAG/USD Stalls as Rising Yields Cap Recovery first appeared on BitcoinWorld.


Source link

15 08, 2026

Natural Gas Price Forecast – Muted Demand and High Supply Cap Natural Gas at $2.75

By |2026-08-15T23:56:22+03:00August 15, 2026|Forex News, News|0 Comments


Seasonal Shifts and Contract Rollovers

The question now will be what happens when we roll over into the October contract in a couple of weeks. We start to think about cooler weather in the Northeast here in the United States. That’s generally when we have a couple of days here and there that we have to start turning on the heat.

So that is typically the beginning of a little bit more bullish momentum. The situation in the Middle East could get out of hand pretty quickly, and if Qatar’s natural gas production gets hit again by Iranian missiles, that could throw things into disarray, especially in the winter.

Ultimately, I am a seasonal trader here. We’re still in a pretty weak time of year, so I don’t like natural gas overall, but there are a few months coming up that tend to be very bullish. As things stand right now, any rally would probably have to contend with the 50-day EMA at $2.90, and then the $3 level as potential resistance.


Source link

15 08, 2026

The GBPJPY is fluctuating below the barrier– Forecast today – 14-8-2026

By |2026-08-15T11:53:26+03:00August 15, 2026|Forex News, News|0 Comments


The GBPJPY pair didn’t change anything since yesterday, to notice forming weak sideways moves by its stability near 215.10, affected by the stability of 215.50 barrier, which obstructs the chances of resuming the previously suggested bullish trend.


We recommend waiting for achieving the breach to confirm the chances of reaching the extra positive stations, which might begin at 216.35 and 216.85, while the failure of breaching it might force the price to activate the corrective attempts again, which forces it to suffer some losses by reaching 214.00 followed by 213.50 support.


The expected trading range for today is between 214.55 and 216.35


Trend forecast: Bullish


Source link

Go to Top