Access proprietary mining insights, investment research, and third-party news sources from Dow Jones Newswires, and Nikkei News. Our comprehensive, real-time global mining news integrates financial and industry-specific data in our articles so you can easily turn information into actionable insights. Our mining news is accessible on web and mobile platforms, news feeds, and email alerts. Our topics range from operations and strategy, mergers and acquisitions, capital markets, ESG, and project developments in the mining industry.
Platinum price seasonality has outspoken cycles and dynamics. These 5 platinum seasonality charts learn that March/April as well as December are consistently strong months. Will 2024 show a year-end really consistent with previous years? There is one concern in 2024…
By analyzing historical data and recent performance, one can identify key months for potential gains and periods where caution is warranted.
In this article, we analyze the seasonality of platinum prices using several charts that cover different time frames, from the long-term 50-year trends to the recent years.
Additionally, we compare platinum’s seasonality with silver to provide a broader context for precious metals investors.
Platinum price seasonality: a 50-year chart
The 50-year platinum price seasonality chart provides an extensive historical perspective, highlighting average price trends throughout the year.
Strong early year performance: The data shows a strong rise in platinum prices from January to around late February or early March, suggesting that this period often sees increased demand or favorable market conditions.
Mid-year weakness: A decline is evident from March onward, reaching its lowest point around mid-year (June to July). This suggests a typical correction or reduced demand during this period.
Late year rally: From July onwards, prices generally recover, peaking around September and fluctuating but remaining relatively strong through the end of the year.
Revealed insights: The long-term seasonality suggests two main periods for potential gains—early in the year (January to March) and later in the year (July to September). The mid-year period often indicates caution or consolidation.
Platinum price seasonality over 50 years – a cyclical pattern – source Goldchartsrus.com
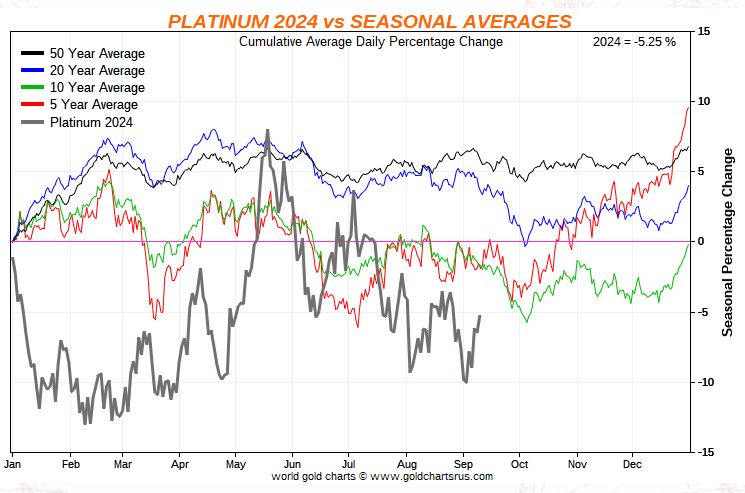
This chart compares the 50-year average seasonality with the specific performance of platinum in 2024.
Early year divergence: In 2024, platinum experienced a significant dip in January and February, a notable divergence from the 50-year average that typically shows strength in these months. This deviation may signal caution for a bullish trend in early 2025.
Consistency later in the year: The rest of 2024 aligns more closely with the 50-year trend, with a recovery starting in mid-year and continuing through the end of the year.
Potential bearish signal: The early-year dip in 2024 suggests that platinum might not be ready to enter a bullish phase in the short term, potentially extending this outlook into early 2025.
Revealed Insights: The sharp divergence early in 2024 highlights potential market-specific factors affecting platinum prices, diverging from historical trends. This requires investors to be cautious about relying solely on seasonality for early 2025 predictions.
Platinum price seasonality 50 years vs. 2024 – a major divergence in January 2024 – source Goldchartsrus.com
Platinum price seasonality since 2020
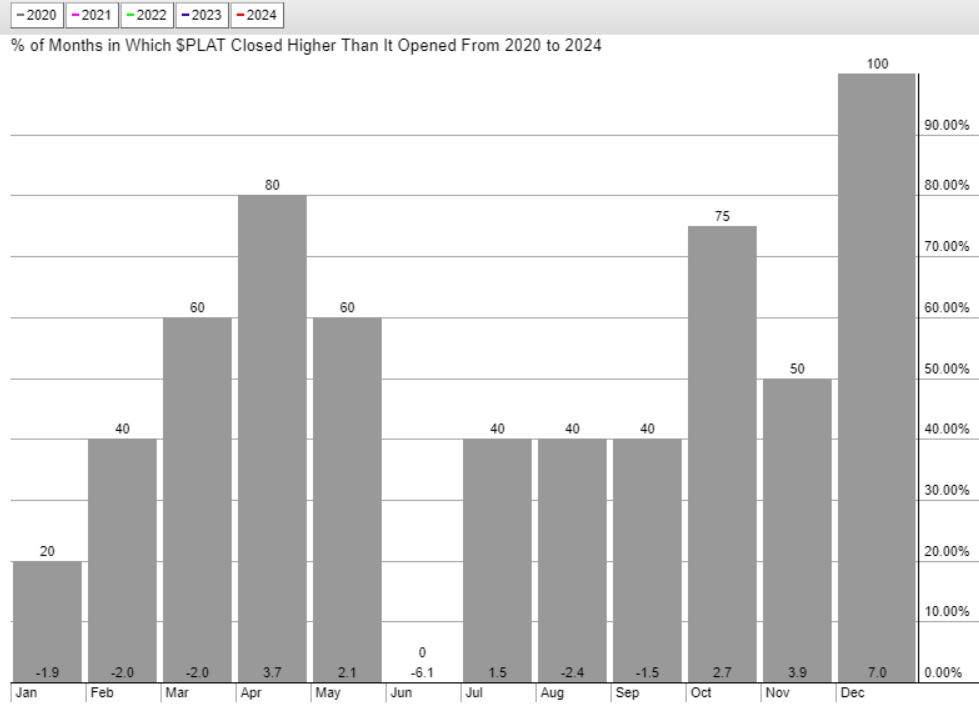
This chart illustrates platinum’s monthly performance from 2020 to 2024, showing the percentage of months when platinum closed higher than it opened.
Consistent peaks in March/April and December: The chart indicates consistent peaks in March/April and December, suggesting strong seasonality for these months.
Weaker performance in mid-year: The middle months do not show significant strength, indicating potential periods of consolidation or reduced activity.
Revealed insights: The recent 4-year period confirms strong performance in March/April and December. These months could present reliable opportunities for gains, aligning partially with the long-term trends and highlighting their importance for traders.
Platinum price seasonality 2020 to 2024 – seasonality confirmed
Platinum price seasonality since 2005
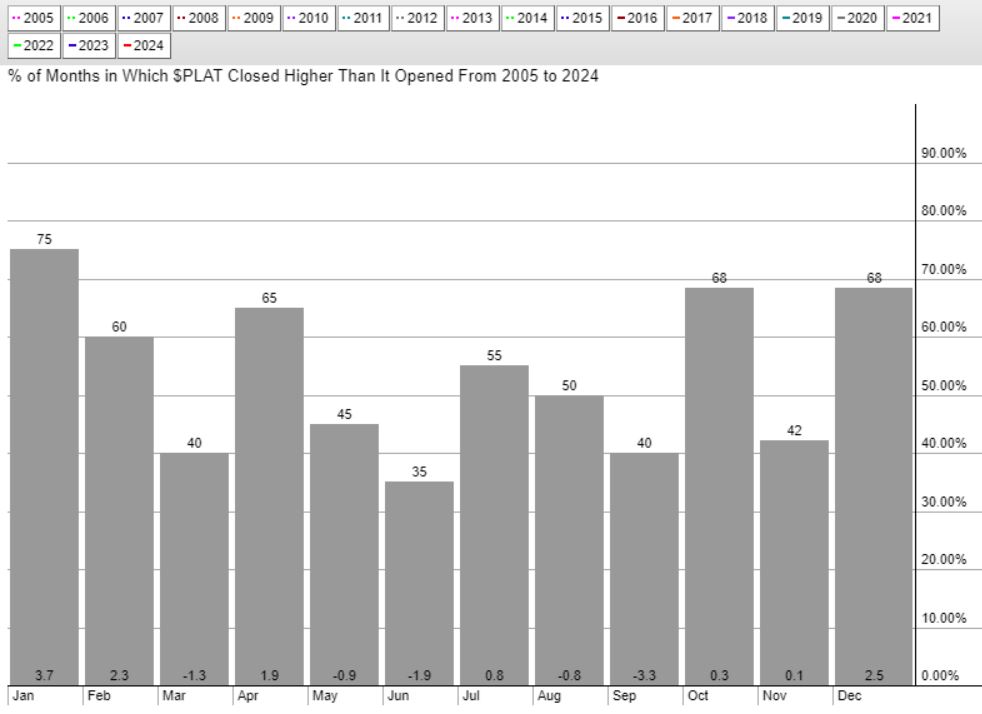
Covering the 19-year period from 2005 to 2024, this chart provides a longer-term perspective on platinum’s seasonality.
Good months – January, April, October, and December: These months show consistent positive returns, suggesting they are strong periods for platinum investment.
Variable performance in other months: Other months, like June and July, have more mixed results, reflecting variability and a need for careful market analysis.
Revealed Insights: The extended period from 2005 to 2024 aligns with some of the 50-year trends but shows more variability. This underlines the importance of focusing on strong months (January, April, October, December) for potential gains while being cautious during mid-year months.
Platinum price seasonality 2005 2024 – four months stand out as positive
Platinum price seasonality – comparative insights
Performance Shifts in Key Months
January and February divergence in 2024: The significant divergence in January and February 2024, with a steep dip, suggests a departure from the long-term trend of early-year strength. This anomaly may signal caution for investors looking for bullish trends in early 2025.
Consistent strong months – March/April and December: The strong months across the 2020-2024 and 2005-2024 periods, particularly March/April and December, align with the long-term trends, highlighting their reliability for positive returns.
Mid-Year Weakness Consistency
Weak performance in June and July across periods: All periods, from the 50-year to the 2005-2024 and 2020-2024 data, show a consistent weakness in June and July. This suggests seasonal factors like reduced demand or market corrections affect platinum during these months.
Strong Late-Year Performance in 2024
Late 2024 consistency with long-term trends: While early 2024 diverged from historical patterns, platinum’s performance from mid-year onward was consistent with the 50-year average. This suggests that the market may stabilize and follow traditional trends later in the year, even when there are anomalies earlier.
Platinum and silver price seasonality compared
In this section, we compare the insights we derived from our silver price seasonality with the ones in this article related to platinum price seasonality.
Early and late-year strength: Both platinum and silver show strong seasonality early (January to March for platinum, January to February for silver) and late in the year (September to December). These similarities suggest both metals may be influenced by common seasonal demand factors.
Mid-year weakness: Both metals exhibit weakness mid-year (June to July for platinum, June for silver), indicating a consistent seasonal pattern.
Divergence in recent years: Platinum’s early-year weakness in 2024 contrasts with silver, which did not show a sharp divergence. This could imply that platinum is currently more sensitive to specific market conditions or economic factors compared to silver.
Conclusion
There are 3 conclusions that we take away from the platinum seasonality charts:
Emerging trends: The early 2024 divergence highlights the need for caution, as platinum might not follow traditional seasonality trends. Current market conditions, such as economic factors, supply chain disruptions, and investor sentiment, heavily influence its performance.
Consistency in strong months: March/April and December show consistent strength across different periods, providing reliable opportunities for gains. However, caution is advised during mid-year months like June and July.
Comparative insights with silver: While both metals share common seasonality traits, platinum’s sensitivity to recent market dynamics suggests that platinum investors might need to wait for silver’s outperformance before getting too excited about platinum’s prospects.
By understanding these seasonality conclusions, platinum investors can better handle the platinum market.
Gold price keeps the red near $2,650 at the start of a new week on Monday.
The US Dollar retreats from seven-week highs amid softer Treasury yields, positive risk tone.
Gold price outlook remains constructive so long as the key $2,630 support holds.
Gold price is in the red at the start of a new week on Monday but stays within a familiar range at around $2,650. Amidst the persistent Middle East geopolitical escalation, Gold price now shifts its attention to speeches from US Federal Reserve (Fed) policymakers on Monday, anticipating the critical US Consumer Price Index (CPI) data later in the week.
Gold price suffers in the US NFP aftermath
Gold price fails to benefit from a US Dollar (USD) pullback from seven-week highs against its major rivals. Risk flows remain in vogue on expectations of more stimulus coming through from China, as traders return after a week-long holiday break. The extended risk appetite into Asia weighs on the safe-haven assets such as the Gold price, the US Dollar, US government bonds etc.
Softer US Treasury bond yields also add to the weight on the Greenback, unable to motivate Gold buyers, as the People’s Bank of China (PBOC), the Chinese central bank, reported no Gold reserves purchases for the fifth straight month in September on Monday. China is the world’s top Gold consumer.
The main catalyst behind the softer undertone in Gold price so far this month is the fading expectations of a 50 basis points (bps) interest rate cut by the Fed next month. This less dovish turn in sentiment surrounding the Fed was accentuated after Friday’s blockbuster Nonfarm Payrolls data, which totally ruled out an outsized Fed rate cut probability for November.
Data published by the US Bureau of Labor Statistics (BLS) on Friday showed that Nonfarm Payrolls rose by 254,000 in September after gaining 159,000 (revised from 142,000) in August. The reading outpaced the market expectation of 140,000 by a wide margin. The annual wage inflation, as measured by the change in Average Hourly Earnings, edged a tad higher to 4% from 3.9% in August.
Markets are currently pricing in about a 94% chance that the Fed will opt for a 25 bps rate cut at its next meeting, the CME Group’s FedWatch Tool shows, with a 6% probability of a no rate change decision.
However, Gold price has managed to keep its corrective downside restricted, thanks to the persistent geopolitical risks emanating from the escalating conflict between Israel and Iran. On Sunday evening, the Israel Defense Forces (IDF) said it struck multiple Hezbollah targets in Beirut, including Hezbollah’s intelligence headquarters. In retaliation, Hezbollah said it also launched a barrage of rockets at northern Israel Sunday night.
Mounting fears of the Israel-Iran conflict turning into a wider regional war in the Middle East remain a cause for concern for global markets. Gold traders, therefore, look forward to upcoming Fedspeak for further trading impetus in the lead-up to the main event risk for this week – the US consumer inflation data for September.
Gold price technical analysis: Daily chart
Despite the sluggish Gold price action recently, buyers refuse to give up as long as the static support of $2,630 holds the fort.
The 14-day Relative Strength Index (RSI) also stays well above the midline, currently near 64, backing the bullish potential.
Gold price, however, needs a daily candlestick closing above the strong resistance near $2,670 to revive the uptrend.
The next resistance is aligned at the record high of $2,686. Further up, buyers will target the $2,700 round level.
On the flip side, acceptance below the intermittent low near $2,630 is critical to unleashing further downside toward the $2,600 threshold.
Ahead of that level, the 21-day Simple Moving Average (SMA) at $2,609 will test bullish commitments.
Gold FAQs
Gold has played a key role in human’s history as it has been widely used as a store of value and medium of exchange. Currently, apart from its shine and usage for jewelry, the precious metal is widely seen as a safe-haven asset, meaning that it is considered a good investment during turbulent times. Gold is also widely seen as a hedge against inflation and against depreciating currencies as it doesn’t rely on any specific issuer or government.
Central banks are the biggest Gold holders. In their aim to support their currencies in turbulent times, central banks tend to diversify their reserves and buy Gold to improve the perceived strength of the economy and the currency. High Gold reserves can be a source of trust for a country’s solvency. Central banks added 1,136 tonnes of Gold worth around $70 billion to their reserves in 2022, according to data from the World Gold Council. This is the highest yearly purchase since records began. Central banks from emerging economies such as China, India and Turkey are quickly increasing their Gold reserves.
Gold has an inverse correlation with the US Dollar and US Treasuries, which are both major reserve and safe-haven assets. When the Dollar depreciates, Gold tends to rise, enabling investors and central banks to diversify their assets in turbulent times. Gold is also inversely correlated with risk assets. A rally in the stock market tends to weaken Gold price, while sell-offs in riskier markets tend to favor the precious metal.
The price can move due to a wide range of factors. Geopolitical instability or fears of a deep recession can quickly make Gold price escalate due to its safe-haven status. As a yield-less asset, Gold tends to rise with lower interest rates, while higher cost of money usually weighs down on the yellow metal. Still, most moves depend on how the US Dollar (USD) behaves as the asset is priced in dollars (XAU/USD). A strong Dollar tends to keep the price of Gold controlled, whereas a weaker Dollar is likely to push Gold prices up.
Gold lost its bullish momentum after setting a new record high in the previous week.
The technical outlook suggests that sellers remain on the sidelines.
Investors will keep a close eye on geopolitics and US inflation data next week.
Gold (XAU/USD) struggled to make a decisive move in either direction this week as the broad-based US Dollar (USD) strength offset the increasing safe-haven demand for the precious metal. Developments surrounding the conflict in the Middle East and US inflation data could drive XAU/USD’s action next week.
Gold ignores renewed USD strength
Gold started the new week under bearish pressure and lost nearly 1% on Monday. While speaking at the National Association for Business Economics Annual Meeting, Federal Reserve (Fed) Chairman Jerome Powell refrained from providing any fresh hints regarding the next policy step. Powell reiterated that risks are two-sided and that they will take policy decisions on a meeting-by-meeting basis. “The Fed is not in a hurry to cut rates quickly, will be guided by data,” he added. These comments allowed the USD to hold its ground and forced XAU/USD to stay on the back foot.
Although the USD preserved its strength on Tuesday after the US Bureau of Labor Statistics (BLS) reported that the JOLTS Job Openings rose to 8.04 million in August from 7.71 million in July, Gold benefited from escalating geopolitical tensions and gained over 1% to erase all of Monday’s losses. Reports of the Israeli army mounting a ground invasion of Lebanon revived fears over a deepening and widening conflict in the Middle East.
Early Wednesday, news of Iran firing about 200 ballistic missiles on Israel and Israel vowing to retaliate against the attack helped Gold find demand. Israel’s Prime Minister Benjamin Netanyahu said that Iran had made a “big mistake” and “will pay,” further escalating tensions. As the USD recovery picked up steam in the second half of the day, however, XAU/USD struggled to gather bullish momentum and closed the day little changed. The Automatic Data Processing (ADP) reported that employment in the private sector rose by 143,000 in September, surpassing the market expectation of 120,000 and supporting the USD.
The data published by the Institute for Supply Management (ISM) showed on Thursday that the business activity in the service sector continued to expand at an accelerating pace in September, with the ISM Services Purchasing Managers Index (PMI) improving to 54.9 from 51.5 in August. The USD capitalized on this report and made it difficult for Gold to rebound.
On Friday, the BLS announced that Nonfarm Payrolls (NFP) rose by 254,000 in September, surpassing the market expectation of 140,000 by a wide margin. Additionally, August’s NFP growth of 142,000 was revised higher to 159,000. Other details of the employment report showed that the Unemployment Rate edged lower to 4.1%, while the annual wage inflation, as measured by the change in the Average Hourly Earnings, ticked up to 4% from 3.9% in August. Gold failed to stage a rebound after upbeat US labor market data.
Gold investors stay focused on geopolitics, await US inflation data
The US economic calendar will not offer any high-tier macroeconomic data releases in the first half of next week. On Wednesday, The Fed will release the minutes of the September policy meeting.
Investors will scrutinize the discussions surrounding the decision to lower the policy rate by 50 basis points (bps). In case the publication reveals that policymakers preferred a large reduction in the interest rate as a first step to a gradual policy-easing, rather than as a response to growing signs of cooling conditions in the labor market, the immediate reaction could boost the USD. The CME Group FedWatch Tool shows that markets are still pricing in a more than 30% probability that the Fed will opt for one more 50 bps cut at the next policy meeting in November, suggesting that the USD has more room on the upside if investors lean toward a 25 bps cut.
On the flip side, the USD could come under pressure and allow Gold to turn north if the minutes reflect that policymakers will keep an open mind about additional big rate cuts in case data points to an economic downturn or a worsening labor market outlook.
On Thursday, the BLS will release the Consumer Price Index (CPI) data for September. The monthly core CPI reading, which excludes prices of volatile items and is not distorted by base effect, could trigger a reaction in Gold. Markets expect the core CPI to rise 0.2% in September, following the 0.3% increase recorded in August. A reading of 0.2%, or smaller, could weigh on the USD. While an increase of 0.5% or more could cause investors to doubt the disinflation process and lift the USD, causing XAU/USD to turn south.
Market participants will also pay close attention to headlines coming out of the Middle East. If the crisis deepens with Israel retaliating against Iran and Iran not taking a step back, Gold could continue to take advantage of the safe-haven demand.
Gold technical outlook
The Relative Strength Index (RSI) indicator on the daily chart retreated slightly below 70, reflecting sellers’ reluctance to bet on an extended decline. On the downside, the mid-point of the ascending regression channel coming from late June forms first support at $2,640. In case this level fails, the next support could be seen at $2,605-$2,600 (20-day Simple Moving Average (SMA), static level) before $2,575 (lower limit of the ascending channel).
Looking north, interim resistance seems to have formed at $2,675 (static level) ahead of $2,700-$2,705 (round level, upper limit of the ascending channel).
Gold FAQs
Gold has played a key role in human’s history as it has been widely used as a store of value and medium of exchange. Currently, apart from its shine and usage for jewelry, the precious metal is widely seen as a safe-haven asset, meaning that it is considered a good investment during turbulent times. Gold is also widely seen as a hedge against inflation and against depreciating currencies as it doesn’t rely on any specific issuer or government.
Central banks are the biggest Gold holders. In their aim to support their currencies in turbulent times, central banks tend to diversify their reserves and buy Gold to improve the perceived strength of the economy and the currency. High Gold reserves can be a source of trust for a country’s solvency. Central banks added 1,136 tonnes of Gold worth around $70 billion to their reserves in 2022, according to data from the World Gold Council. This is the highest yearly purchase since records began. Central banks from emerging economies such as China, India and Turkey are quickly increasing their Gold reserves.
Gold has an inverse correlation with the US Dollar and US Treasuries, which are both major reserve and safe-haven assets. When the Dollar depreciates, Gold tends to rise, enabling investors and central banks to diversify their assets in turbulent times. Gold is also inversely correlated with risk assets. A rally in the stock market tends to weaken Gold price, while sell-offs in riskier markets tend to favor the precious metal.
The price can move due to a wide range of factors. Geopolitical instability or fears of a deep recession can quickly make Gold price escalate due to its safe-haven status. As a yield-less asset, Gold tends to rise with lower interest rates, while higher cost of money usually weighs down on the yellow metal. Still, most moves depend on how the US Dollar (USD) behaves as the asset is priced in dollars (XAU/USD). A strong Dollar tends to keep the price of Gold controlled, whereas a weaker Dollar is likely to push Gold prices up.
Silver price is under renewed pressure from the US dollar following forecast-beating Non Farm Payrolls data, but XAGUSD could recover shortly.
Silver price declined marginally on Friday, going down by 0.5 to trade at $31.87 at the time of writing on the heels of upbeat US labour market data. The greyish metal got rejected at $32.30 in its most recent ascent, but it will likely attempt another go at it as the geopolitical situation in the Middle East provides tailwinds.
US Non-Farm Payrolls numbers beat forecasts in September, coming in at 254k against the median forecast figure of 147k. Meanwhile, the August reading was revised upward from 142k to 159k, signaling a robust jobs situation. In addition, unemployment rate fell to 4.1 percent from August’s 4.2 percent which analysts had forecast to remain unchanged.
Solid jobs growth in the United States eases pressure on the Federal Reserve to cut interest rates by a deeper margin and puts pressure on dollar-denominated silver. With inflation subsiding significantly in recent months, the Fed will likely pay greater attention to the jobs market in its interest rate decision making.
That said, continued escalation of war in the Middle East and the fear sentiment surrounding it will provide safe haven demand for silver as investors seek to diversify their portfolio. Israel had sworn to retalliate Iran’s missile attack, and markets willl be on the edge as investors wait to see the direction the conflict takes. That could provide support for silver price in the near-term.
Silver price prediction today
The momentum on silver price calls for further downside, with the MACD indicator line below the signal line. The pivot will likely be at 32.10, with the first support coming at 31.90. However, a stronger bearish momentum could breach that mark and send the price to test 31.80.
Alternatively, moving above 32.10 will favour the buyers, who could advance further to the first resistance at 31.90. However, if they manage to break above that mark, the downside narrative will be invalid, and the momentum could see the price move to the next barrier established at 31.80.
December arabica coffee (KCZ24) today is down -1.85 (-0.70%), and November ICE robusta coffee (RMX24) is down -72 (-1.35%).
Coffee prices are moving lower today as forecasts for rain in Brazil sparked long liquidation coffee futures. Today’s two-week Global Forecast System model showed rain is expected for Brazil’s coffee-growing regions next week during the all-important flowering period for Brazil’s coffee trees.
The downside in coffee prices is limited today after Conab, Brazil’s crop forecasting agency, cut its 2024 Brazil coffee production forecast to 54.8 million bags from 58.8 million bags forecast in May.
Strength in the Brazilian real (^USDBRL) is bullish for arabica coffee prices as the real rallied to a 1-month high against the dollar today, discouraging export selling from Brazil’s coffee producers.
On Monday, Dec arabica and Nov robusta posted contract highs, while nearest-futures (U24) robusta posted a new all-time high. Coffee prices have rallied sharply over the past week as adverse global weather events threaten coffee production. Brazil has been facing the driest weather since 1981, according to the natural disaster monitoring center Cemaden. Rainfall in Brazil has consistently been below normal since April, damaging coffee trees during the all-important flowering stage and reducing the prospects for Brazil’s 2025/26 arabica coffee crop. Somar Meteorologia reported Monday that Brazil’s Minas Gerais region received no rain over the past week. Minas Gerais accounts for about 30% of Brazil’s arabica crop. Also, robusta coffee has support after heavy rain from typhoon Yagi may have damaged Vietnam’s robusta coffee fields.
Robusta coffee prices are underpinned by fears that excessive dryness in Vietnam will damage coffee crops and curb future global robusta production. Vietnam’s agriculture department said on March 26 that Vietnam’s coffee production in the 2023/24 crop year dropped by -20% to 1.472 MMT, the smallest crop in four years, due to drought. The USDA FAS on May 31 projected that Vietnam’s robusta coffee production in the new marketing year of 2024/25 will dip slightly to 27.9 million bags from 28 million bags in the 2023/24 season. Last Wednesday, the General Department of Vietnam Customs reported that Vietnam’s August coffee exports fell -9.9% y/y to 76,214 MT and that Vietnam’s Jan-Aug coffee exports fell -12.1% y/y to 1.06 MMT.
Last Tuesday, Cecafe reported that Brazil’s Aug green coffee exports rose +1.4% y/y to 3.41 million bags. The rise in Brazil’s green coffee exports was consistent with other recent news showing higher exports. The Brazilian Trade Ministry reported on August 7 that Brazil’s July coffee exports rose +44% y/y to 202,000 MT. Also, Cecafe reported on July 11 that Brazil’s 2023/24 coffee exports rose +33% y/y to a record 47.3 million bags. On a global basis, the International Coffee Organization (ICO) reported on September 6 that global coffee exports rose +12.2% y/y in July to 11.29 million bags and that global exports during Oct-July rose +10.5% y/y to 115.01 million bags.
A rebound in ICE coffee inventories from historically low levels is negative for prices. Last Thursday, ICE-monitored arabica coffee inventories rose to a 1-1/2 year high of 858,474 bags, up from the 24-year low of 224,066 bags posted in November 2023. Also, ICE-monitored robusta coffee inventories on July 25 rose to a 1-year high of 6,521 lots, up from the record low of 1,958 lots posted in February 2024.
In a bearish factor, the International Coffee Organization (ICO) said on May 3 that 2023/24 global coffee production climbed +5.8% y/y to 178 million bags due to an exceptional off-biennial crop year. ICO also said global 2023/24 coffee consumption rose +2.2% y/y to 177 million bags, resulting in a 1 million bag coffee surplus.
The USDA’s bi-annual report on June 20 was bearish for coffee prices. The USDA’s Foreign Agriculture Service (FAS) projected that world coffee production in 2024/25 will increase +4.2% y/y to 176.235 million bags, with a +4.4% increase in arabica production to 99.855 million bags and a +3.9% increase in robusta production to 76.38 million bags. The USDA’s FAS forecasts that 2024/25 ending stocks will climb by +7.7% to 25.78 million bags from 23.93 million bags in 2023/24. The USDA’s FAS projects that Brazil’s 2024/25 arabica production would climb +7.3% y/y to 48.2 mln bags due to higher yields and increased planted acreage. The USDA’s FAS also forecasts that 2024/54 coffee production in Colombia, the world’s second-largest arabica producer, will climb +1.6% y/y to 12.4 mln bags.
did not have (either directly or indirectly) positions in any of the securities mentioned in this article. All information and data in this article is solely for informational purposes. For more information please view the Barchart Disclosure Policy
“Traders are looking for a clearer direction, and all eyes are on the upcoming US employment report, which could serve as the next major catalyst for gold prices,” stated Mark Ashford, senior market analyst at Global Commodities. “The dollar’s strength has been a major headwind for gold.”
US Dollar Rises on Strong Labor Market Data
The US dollar has been gaining ground, nearing a one-month high, as recent economic indicators paint a picture of a stable labor market. According to the US Department of Labor, unemployment claims rose slightly to 225,000 for the week ending September 28, up from 218,000 in the prior week.
Meanwhile, private-sector employment saw an unexpected increase in job openings for August, reinforcing the strength of the US labor market.
Additionally, the Institute for Supply Management (ISM) reported that its Non-Manufacturing PMI rose to 54.9 in September, its highest reading since February 2023.
The robust labor market data has tempered expectations for significant Fed rate cuts, further supporting the US dollar and creating headwinds for non-yielding assets like gold.
Geopolitical Tensions Provide Limited Support for Gold Prices
While gold’s safe-haven appeal is being reinforced by the uncertain geopolitical landscape, this has not yet been enough to push prices higher. Hezbollah’s recent launch of 230 projectiles from Lebanon into Israel and retaliatory Israeli airstrikes have heightened the risk of a broader regional conflict.
Silver price remains firm near $32 in countdown to US NFP.
The US labor market data will influence the Fed’s likely policy-easing pace.
Middle East conflict has strengthened Silver’s appeal as a safe haven.
Silver price (XAG/USD) oscillates in a tight range near the crucial resistance of $32.00 in Friday’s European session. The white metal stays firm due to widening conflicts in the Middle East region between Israel and Iran-backed Hezbollah. Historically, the safe-haven appeal of precious metals improves amid geopolitical uncertainty.
In today’s session, the major trigger for the Silver price will be the United States (US) Nonfarm Payrolls (NFP) data for September, which will be published at 12:30 GMT. The official employment data will significantly influence market expectations for the Federal Reserve’s (Fed) interest rate outlook.
On September 18, the Fed pivoted to policy normalization with a larger-than-usual interest rate cut of 50 basis points (bps). After the Fed’s decision of jumbo rate cut, comments from Fed Chair Jerome Powell and his teammates have indicated that the central bank was more focused on reviving job growth amid confidence that price pressures are on track to return to the bank’s target of 2%.
The US NFP report is expected to show that 140K fresh payrolls were added, similar to 142K in August. The Unemployment Rate is seen steady at 4.2%. Investors will also focus on Average Hourly Earnings data, a key measure to wage growth, which is expected to have grown by 3.8% steadily year-on-year.
Meanwhile, the US Dollar Index (DXY), which tracks the Greenback’s value against six major currencies, edges lower but trades close to its two-week high around 102.00.
Silver technical analysis
Silver price trades close to near the horizontal resistance plotted from May 20 high of $32.50 on a daily timeframe. The white metal strives for more upside as the outlook is upbeat due to upward-sloping 20 and 50-day Exponential Moving Averages (EMAs), which trade around $31.00 and $30.00, respectively.
The 14-day Relative Strength Index (RSI) remains in the bullish range of 60.00-80.00, suggesting more upside ahead.
Silver daily chart
Silver FAQs
Silver is a precious metal highly traded among investors. It has been historically used as a store of value and a medium of exchange. Although less popular than Gold, traders may turn to Silver to diversify their investment portfolio, for its intrinsic value or as a potential hedge during high-inflation periods. Investors can buy physical Silver, in coins or in bars, or trade it through vehicles such as Exchange Traded Funds, which track its price on international markets.
Silver prices can move due to a wide range of factors. Geopolitical instability or fears of a deep recession can make Silver price escalate due to its safe-haven status, although to a lesser extent than Gold’s. As a yieldless asset, Silver tends to rise with lower interest rates. Its moves also depend on how the US Dollar (USD) behaves as the asset is priced in dollars (XAG/USD). A strong Dollar tends to keep the price of Silver at bay, whereas a weaker Dollar is likely to propel prices up. Other factors such as investment demand, mining supply – Silver is much more abundant than Gold – and recycling rates can also affect prices.
Silver is widely used in industry, particularly in sectors such as electronics or solar energy, as it has one of the highest electric conductivity of all metals – more than Copper and Gold. A surge in demand can increase prices, while a decline tends to lower them. Dynamics in the US, Chinese and Indian economies can also contribute to price swings: for the US and particularly China, their big industrial sectors use Silver in various processes; in India, consumers’ demand for the precious metal for jewellery also plays a key role in setting prices.
Silver prices tend to follow Gold’s moves. When Gold prices rise, Silver typically follows suit, as their status as safe-haven assets is similar. The Gold/Silver ratio, which shows the number of ounces of Silver needed to equal the value of one ounce of Gold, may help to determine the relative valuation between both metals. Some investors may consider a high ratio as an indicator that Silver is undervalued, or Gold is overvalued. On the contrary, a low ratio might suggest that Gold is undervalued relative to Silver.
U.S. crude oil prices rose about 5% on Thursday, posting a third consecutive session of gains on fears that Israel could strike Iran’s oil industry in retaliation for Tehran’s ballistic missile attack this week.
President Joe Biden was asked by reporters Thursday morning whether the U.S. would support an Israeli strike on Iranian oil facilities. Biden said: “We’re discussing that. I think that would be a little – anyway.” The president added that “there’s nothing going to happen today.”
CNBC has reached out to the White House for comment.
Biden’s comments were the catalyst that moved prices higher, said Daniel Ghali, senior commodity strategist at TD Securities. “Geopolitical risks in the Middle East are probably at their highest levels since the Gulf War,” Ghali told CNBC.
The U.S. benchmark surged 5.5% earlier in the session to an intraday high of $73.99 per barrel. West Texas Intermediate is ahead about 8% this week, on pace for its best weekly gain since March 2023.
Here are Thursday’s closing energy prices:
West Texas Intermediate November contract: $73.71 per barrel, up $3.61, or 5.15%. Year to date, U.S. crude oil has gained nearly 3%.
Brent December contract: $77.62 per barrel, up $3.72, or 5.03%. Year to date, the global benchmark is ahead nearly 1%.
RBOB Gasoline November contract: $2.0926 per gallon, up 5.37%. Year to date, gasoline has fallen less than 1%.
Natural Gas November contract: $2.97 per thousand cubic feet, up 2.91%. Year to date, gas has gained about 18%.
The risk of oil supply disruptions increases as fighting in the Middle East intensifies, but OPEC+ is sitting on a large amount of spare crude that could step into the breach, according to Claudio Galimberti, chief economist at Rystad Energy.
“This spare capacity is for now preventing runaway prices amid one of the deepest and most pervasive crises in the Middle East in the past four decades,” Galimberti told clients in a Thursday note.
OPEC+ spare capacity would be sufficient to cover a disruption to Iran’s exports if Israel strikes the Islamic Republic’s oil infrastructure as retaliation for Tehran’s ballistic missile attack, said Bjarne Schieldrop, chief commodities analyst at the Swedish bank SEB.
The problem, however, is that the world’s spare oil capacity is heavily concentrated in the Middle East, particularly the Gulf states, and could also be at risk if a wider war breaks out, according to Ghali with TD Securities.
If Israel hits Iran’s oil industry, traders would begin to worry about supply disruptions in the Strait of Hormuz, Schieldrop said. “That would add a significant risk premium to oil,” he told CNBC’s “Street Signs Europe.” The strait is one of the most important trade arteries for oil in the world.
As a consequence, oil prices could surge to $200 per barrel if Israel hits Iran’s oil infrastructure, Schieldrop said.
Gold price extends a side trend below the key $2,670 resistance amid the Israel-Iran conflict.
The US Dollar eases off six-week highs, as traders reposition ahead of the Nonfarm Payrolls data.
Gold price stays above all key daily averages and the RSI hangs in the bullish zone, pointing to a fresh upside.
Gold price is extending its consolidative phase below the key $2,670 static resistance for the third straight day. Gold traders look forward to the high-impact US Nonfarm Payrolls (NFP). data for the next push higher, as the Middle East geopolitical escalation persists.
US Nonfarm Payrolls hold key for next Gold price direction
Heading into the US NFP showdown, traders are resorting to position readjustment by way of profit-taking on the recent US Dollar (USD) rally, injecting fresh signs of life in Gold price. The Greenback retreats early Friday after hitting six-week highs against its major rivals on Thursday, courtesy of the recent strong US employment and ISM Services PMI data. Encouraging US economic data have eased bets for a 50 basis points interest rate cut by the Federal Reserve (Fed) in November.
Data on Wednesday showed that US ADP private sector employment increased by 143,000 jobs for September, accelerating from the upwardly revised 103,000 in August and better than the 120,000 estimate. Meanwhile, US ISM Services PMI jumped from 51.5 to 54.9 in September, above the forecast of 51.7 while marking the highest reading since February 2023.
Markets are currently pricing in about a 34% chance that the Fed will opt for a big rate cut at its next meeting, compared with almost 60% last week, CME Group’s FedWatch Tool shows. The non-interest-bearing Gold price struggles amid reduced bets for aggressive Fed easing. However, the Gold price downside remains cushioned due to the intensifying geopolitical tensions between Iran and Israel.
Following Iran’s missile attacks on Israel to avenge the killings of of leaders of the Tehran-back militant group Hezbollah last week, Israel responded by striking an apartment in central Beirut, which killed nine people. The Lebanese Army returned Israeli fire for the first time in nearly a year of fighting between Israel and Hezbollah. Mounting risks of the Israel-Iran conflict turning into a wider regional war in the Middle East continue to lend support to the traditional safe-haven Gold price.
The next direction in Gold price, however, will be determined by the upcoming US payrolls data, which is expected to show that the economy added 140K jobs in September, against August’s 142K gain. The Unemployment Rate is set to hold steady at 4.2% in the same period while the annual Average Hourly Earnings are likely to grow by 3.8% in September, at the same pace seen in August.
An upside surprise to the headline NFP figure and the wage inflation data could bolster bets for a 25 bps Fed rate cut in November, adding extra legs to the US Dollar recovery at the expense of Gold price. In contrast, a big disappointment could revive expectations that the Fed would opt for an outsized rate reduction at its next meeting, smashing the USD across the board. In such a case, Gold price could jump back toward the record high of $2,686.
The US labor market report will the hold key for the Gold price action while traders will also closely eye a speech from New York Fed President John Williams for fresh policy cues.
Gold price technical analysis: Daily chart
The short-term technical outlook for Gold price remains more or less the same, with buyers motivated so long as the 14-day Relative Strength Index (RSI) holds within the bullish zone. The leading indicator is currently trading near 68.
Gold price needs to yield a daily candlestick closing above the static resistance near $2,670 for a fresh upside. The next resistance is aligned at the record high of $2,686.
Further up, buyers will target the $2,700 round level, followed by the rising trendline resistance, now at $2,752.
On the flip side, acceptance below the September 24 low of $2,623 is critical to unleashing further downside toward the $2,600 threshold, where the 21-day Simple Moving Average (SMA) coincides.
Gold sellers could then challenge the September 20 low of $2,585.
Economic Indicator
Nonfarm Payrolls
The Nonfarm Payrolls release presents the number of new jobs created in the US during the previous month in all non-agricultural businesses; it is released by the US Bureau of Labor Statistics (BLS). The monthly changes in payrolls can be extremely volatile. The number is also subject to strong reviews, which can also trigger volatility in the Forex board. Generally speaking, a high reading is seen as bullish for the US Dollar (USD), while a low reading is seen as bearish, although previous months’ reviews and the Unemployment Rate are as relevant as the headline figure. The market’s reaction, therefore, depends on how the market assesses all the data contained in the BLS report as a whole.


 Daily Forecast: Technical Levels to Watch as Gold Awaits NFP Breakout")


