After reaching an all-time high of $2,531.60 on Tuesday, gold has retraced nearly 1% this week. The pullback is attributed to a stronger U.S. dollar and a rebound in Treasury yields, following an unexpected rise in the unemployment rate. Despite this, gold managed to inch higher on Friday, reflecting investor uncertainty and the potential for significant price moves depending on Powell’s remarks.
Fed’s Rate Cut Signals and Market Reactions
Market participants are closely monitoring Powell’s address at the Jackson Hole symposium for clues on the Fed’s future interest rate decisions. Traders have largely priced in a 76% probability of a 25-basis-point rate cut in September, with some speculating on a more substantial 50-basis-point reduction. This expectation has kept gold’s appeal intact, as a lower interest rate environment typically supports non-yielding assets like bullion.
However, there is concern that Powell’s speech could lead to a “buy the rumor, sell the fact” scenario, where gold could face selling pressure if the anticipated rate cut is confirmed without any surprises. This pattern may contribute to increased volatility and could limit gold’s upside potential in the near term.
Cautious Optimism Among Gold Traders
Tim Waterer, Chief Market Analyst at KCM Trade, noted, “Gold’s stay below $2,500 could be temporary, with the fundamentals still appearing favorable for the precious metal.” However, the market remains on edge as any unexpected remarks from Powell could trigger significant price moves. A more dovish stance from the Fed could boost gold, while a hawkish tone might extend the metal’s recent losses.
Market Forecast: Potential for Bullish Momentum, but Beware of Reversal
If Powell confirms the anticipated rate cut, gold prices may resume their upward trend, potentially challenging the $2,500 level again. However, traders should be mindful of a potentially bearish closing price reversal top on the weekly chart if gold ends the session lower today. Such a pattern could signal a deeper correction, making a bearish scenario likely if Powell suggests that the economy is stable enough to delay cuts. As a result, traders should prepare for a session with the potential for significant price swings depending on the Fed’s direction.
Silver price gains to near $29.30 in the countdown to Fed Powell’s speech.
Jerome Powell is expected to provide fresh cues on interest rates and the economic outlook.
US bond yields remain under pressure on firm Fed rate cut prospects.
Silver price (XAG/USD) rises to near $29.30 in Friday’s North American session, with investors focusing on the Federal Reserve (Fed) Chair Jerome Powell’s speech at the Jackson Hole (JH) Symposium. The white metal gains as bond yields decline on expectations that Jerome Powell will deliver a dovish guidance on interest rates.
10-year US Treasury yields fall to near 3.84%. Lower yields on interest-bearing assets bode poorly for non-yielding assets, such as Silver, given that they reduce the opportunity cost of holding an investment in them.
The US Dollar Index (DXY), which tracks the Greenback’s value against six major currencies, recovers its intraday losses and rebounds to near 101.50.
Market participants are optimistic about Powell’s dovish guidance but they want more clarity on the likely size of interest rate cuts in September. According to the CME FedWatch tool, 30-day Federal Funds Futures pricing data shows that the probability of 50 basis points (bps) interest-rate cut in September is 28.5%. While rest is favoring a 25-bps interest rate reduction.
Investors will also focus on Powell’s speech to know about whether chances of ‘soft landing’ are intact. Market experts started anticipating a potential United States (US) recession after the Nonfarm Payrolls (NFP) report for July indicated a sharp slowdown in the labor demand and an increase in the Unemployment Rate to 4.3%, the highest level seen since November 2021.
Silver technical analysis
Silver price turns sideways after a decisive break above August 2 high of $29.20, which faltered the lower high lower low formation on a four-hour timeframe. The 200-period Exponential Moving Average (EMA) near $28.77 acts as cushion for Silver price bulls.
The 14-period Relative Strength Index (RSI) falls to near 60.00, suggesting that the bullish momentum has concluded for now. However, the bullish bias remains intact.
Silver four-hour chart
Silver FAQs
Silver is a precious metal highly traded among investors. It has been historically used as a store of value and a medium of exchange. Although less popular than Gold, traders may turn to Silver to diversify their investment portfolio, for its intrinsic value or as a potential hedge during high-inflation periods. Investors can buy physical Silver, in coins or in bars, or trade it through vehicles such as Exchange Traded Funds, which track its price on international markets.
Silver prices can move due to a wide range of factors. Geopolitical instability or fears of a deep recession can make Silver price escalate due to its safe-haven status, although to a lesser extent than Gold’s. As a yieldless asset, Silver tends to rise with lower interest rates. Its moves also depend on how the US Dollar (USD) behaves as the asset is priced in dollars (XAG/USD). A strong Dollar tends to keep the price of Silver at bay, whereas a weaker Dollar is likely to propel prices up. Other factors such as investment demand, mining supply – Silver is much more abundant than Gold – and recycling rates can also affect prices.
Silver is widely used in industry, particularly in sectors such as electronics or solar energy, as it has one of the highest electric conductivity of all metals – more than Copper and Gold. A surge in demand can increase prices, while a decline tends to lower them. Dynamics in the US, Chinese and Indian economies can also contribute to price swings: for the US and particularly China, their big industrial sectors use Silver in various processes; in India, consumers’ demand for the precious metal for jewellery also plays a key role in setting prices.
Silver prices tend to follow Gold’s moves. When Gold prices rise, Silver typically follows suit, as their status as safe-haven assets is similar. The Gold/Silver ratio, which shows the number of ounces of Silver needed to equal the value of one ounce of Gold, may help to determine the relative valuation between both metals. Some investors may consider a high ratio as an indicator that Silver is undervalued, or Gold is overvalued. On the contrary, a low ratio might suggest that Gold is undervalued relative to Silver.
old price holds Thursday’s late rebound this Friday, eagerly awaiting Powell’s Jackson Hole speech.
The US Dollar returns to the red with Treasury bond yields on dovish Fed bets and the USD/JPY sell-off.
Gold price remains poised to reclaim $2,500 on dovish Powell’s words and bullish technicals.
Gold price is back in the green zone early Friday, adding on to Thursday’s late rebound. The Gold price rebound could be linked to the resumption of the US Dollar (USD) decline, in the face of fresh USD/JPY sell-off and negative US Treasury bnnd yields.
Gold price looks Powell’s speech for a fresh advance
Markets stay risk averse in Asian trading so far this Friday, as they keenly await US Federal Reserve (Fed) Chair Jerome Powell’s Jackson Hole appearance for fresh hints on the central bank’s interest-rate path, especially with traders pricing in aggressive Fed rate cuts on signs of loosening labor market conditions.
Risk-off flows boost the haven demand for the US government bonds, weighing on the Treasury bond yields across the curve and thus, dragging the USD lower. The Greenback also bears the brunt of the renewed USD/JPY sell-off, following Bank of Japan (BoJ) Governor Kazuo Ueda’s hawkish remarks before the parliament on Friday.
Ueda reaffirmed his commitment to raise interest rates if inflation stayed on course to sustainably hit the 2.0% target but remained wary about unstable financial markets.
Despite the latest upswing, Gold price looks set to book the second straight weekly loss, as a Fed interest-rate cut for September is a done deal. However, Fed Chair Jerome Powell’s comments are critical to gauging the magnitude of easing expected in the coming months.
Gold price corrected roughly 1% on Thursday after the US Dollar rebounded firmly from over one-year lows against its major rivals, as risk sentiment deteriorated on unimpressive US S&P Global business PMIs and Jobless Claims data. Further, traders resorted to repositioning in the lead-up to Powell’s Jackson Hole showdown on Friday.
Gold price technical analysis: Daily chart
The short-term technical outlook for Gold price remains in favor of buyers so long as the triangle resistance-turned-support, now at $2,470, holds.
Note that Gold price yielded a symmetrical triangle breakout last week while the 14-day Relative Strength Index (RSI) points north above 50.
These technical indicators suggest that the bullish potential remains well in place for Gold price.
On the upside, should Gold buyers recapture the record high of $2,532, the next relevant topside target is seen at the $2,550 level.
Acceptance above the latter could challenge the $2,600 round level en-route to the triangle target, measured at $2,660.
If the Gold price correction resumes, the immediate support is seen at the abovementioned triangle resistance-turned-support at $2,470.
A breach of the latter will call for a test of the. Further south, the $2,450 psychological barrier will come to the rescue of Gold optimists.
Economic Indicator
Fed’s Chair Powell speech
Jerome H. Powell took office as a member of the Board of Governors of the Federal Reserve System on May 25, 2012, to fill an unexpired term. On November 2, 2017, President Donald Trump nominated Powell to serve as the next Chairman of the Federal Reserve. Powell assumed office as Chair on February 5, 2018.
The US Dollar shows signs of life following recent YTD lows.
Markets’ attention remains on Powell’s speech at Jackson Hole.
XAU/USD faces initial resistance at its record top past $2,530.
XAU/USD faces some renewed selling pressure and adds to Wednesday’s losses, returning to the sub-$2,500 region per ounce troy.
The corrective decline in the precious metal was accompanied by quite a marked rebound in the Greenback, all after the US Dollar Index (DXY) broke below the key 101.00 support for the first time since December 2023 during the previous day.
Adding to the downward pressure on the yellow metal, US yields bounced across the spectrum as market participants digested the dovish tone from the FOMC Minutes released on Wednesday and started to warm up for the upcoming speech by the Federal Reserve’s (Fed) Chair Jerome Powell at the Jackson Hole Symposium on Friday.
Although the FOMC Minutes suggested that an interest rate cut could be imminent as early as next month, Powell’s upcoming speech might provide additional insights into his perspective on this possibility and, more crucially, reveal the potential magnitude of the cut. At present, CME Group’s FedWatch Tool indicates a nearly 75% chance of a 25 bps rate reduction at the September 18 gathering.
If there are indications of a larger cut, say 50 bps, it is anticipated to put significant pressure on the Greenback and enable Gold to test recent highs. Regardless, the US Dollar is likely to remain under close watch for the time being, which may limit any decline in bullion prices.
XAU/USD short-term technical outlook
The daily chart shows XAU/USD navigating above all of its moving averages, with a bullish 55 Simple Moving Average (SMA) speeding north at about $2,390, as well as bullish lengthier ones. Meanwhile, technical indicators (RSI and Momentum) receded from recent tops, while the daily ADX indicates a stable trend for the time being.
In the short term, and according to the 4-hour chart, the corrective decline persists. XAU/USD is now facing the next support at the 100-SMA at $2,452 prior to $2,432, which appears underpinned by the more relevant 200-SMA at $2,428. A sustained breakdown of this region could open the door to a deeper retracement to $2,379, ahead of $2,364.
There was a bearish reversal triggered on the weekly chart earlier this week and it looks like that is now playing out. Moreover, natural gas remains below both its 50-Day MA and 200-Day MAs, in addition to falling back below its 20-Day MA today. If the 2.02 price area fails to hold as support, then a dip lower may be in the plans. It looks like the next lower price zone is from around 1.95 to 1.92. The lower level is the 78.6% Fibonacci retracement level and the 1.95 level is the target from a falling ABCD pattern extended by the 161.8% ratio.
Bigger Picture Remains Bullish
Despite short-term weakness, natural gas remains on track to progress higher once the retracement is complete. It broke up and out of a falling bull wedge two weeks ago and then rallied to a high of 2.30, which was above a prior swing high at 2.27. That rally also recaptured the 20-Day MA. The bottom at 1.88 on August 5 completed a 40.2% decline from the prior swig high at 3.16. On a percentage basis, that drop exceeded all the prior corrections starting from the February 2023 bottom starting from the February 2023 bottom, except one. The decline from the January peak to the February low was 55.1%.
The current retracement is the first pullback since the bottom reversal since the bottom earlier this month. Once support is found followed by a bullish reversal on some time frame (daily or intraday) It has the potential to lead to a resumption of the developing bull trend. Given the significance of the prior decline a reversal up also has the potential to surprise to the upside.
For a look at all of today’s economic events, check out our economic calendar.
Gold price (XAU/USD) broke multiple records between March and August 2024, and it is going on to register all-time highs of $2,531 per ounce on August 20 at the spot market. The yellow metal’s propulsion this year has mostly been as a result of the geopolitical risk in the Middle East fand soft US macroeconomic data, which have combined to raise prospects of up to three Fed interest rate cuts, starting September 2024. Notably, its price trajectory beginning June was also contrarian, rising when inflation was cooling in United States and Europe.
That said, gold prices were down by 1.25 percent on the daily chart as of this writing to trade at $2,480 per ounce in the spot market, as buyers tamed their appetite ahead of a highly awaited speech by Federal Reserve Chairman Jerome Powell. The Fed Chair is expected to give guidance on the extent of the anticipated rate cuts, with the debate ranging widely from lows of 50-to-100 basis points in the last third of the year.
Also, the safe haven demand for the precious metal bubbles under as the Israel-Hamas war takes a new dimension, with ceasefire talks making minimal gains in August. However, China’s move to pause purchases in May, June, and July has put a lid on demand-side gold price rise.
XAU/USD gets tailwinds from weak dollar fundamentals
The US dollar has eased down in August as a series of soft macroeconomic data weighed in. First, the Nonfarm Payroll (NFP) data showed that 114,000 jobs were created in July, substantially lower than the forecast figure of 175,000. Also, the PCE and CPI readings had headed down for successive months beginning May. Furthermore, unemployment rate US rose from April through July, triggering recession fears in early August.
In the wake of these figures, the dollar has weakened against major world currencies. The DXY index, which weighs the greenback against a composite of six other currencies, slid to year-to-date lows of 100.92 on August 21st.
Falling Treasury yields a source of tailwinds for gold price
US Treasuries are substitutes for gold as far as safe-haven investments go and falling rates on these assets have tilted the scales in favour of the yellow metal. As of this writing, yields on the benchmark 10-year bonds were at 3.86%, losing their ground against non-yielding gold. This will likely supply upward propulsion on the XAUUSD trading pair in the near-to-middle term.
Please note that the original article was published in September 2022.However, we update it regularly to incorporate all the latest information.You are also welcome to join my free Telegram group for up-to-date analysis on Gold & Bitcoin.
Gold news
The US dollar sits precariously after the US economy released a series of weak data in recent weeks. A rise in the unemployment rate, a decline in NFP jobs and a higher-than-expected initial jobless claims filings underline the rising pressure on the US dollar and support for gold’s upside.
In the latest case, Initial Jobs Claims figures came in at 232,000 in the week ending August 17, matching analysts’ forecast figure. This has raised hopes of potential 50 basis points cut in September. The Federal Reserve is expected to announce its first rate cut from the four-year-old 5.25%- 5.50% rate in its September decision, and that rate is expected to spur investor appetite for gold.
Elsewhere, China did not buy gold for the third successive month in July. The country’s central bank had been on a buying spree that saw it import gold for 18 straight months to April 2024, as it sought to cushion itself against the downside of overexposure to the the dollar. China currently holds about 2,264 metric tonnes of gold, constituting about 4.9 percent of her forex reserves, the highest ever on record.
China’s economy flashed signs of contraction for the three-month period to July, with its Purchasing Managers Index (PMI) readings below the 50 percent mark in each of the three months. Coupled with recent soft US economic data, the trend could trigger a spike in the demand for safe-haven gold.
Furthermore, there has been a notable increase in retail purchases of gold amid a troubled property market. These developments have combined to provide upside propulsion to gold prices and will likely continue to provide support in the mid-term.
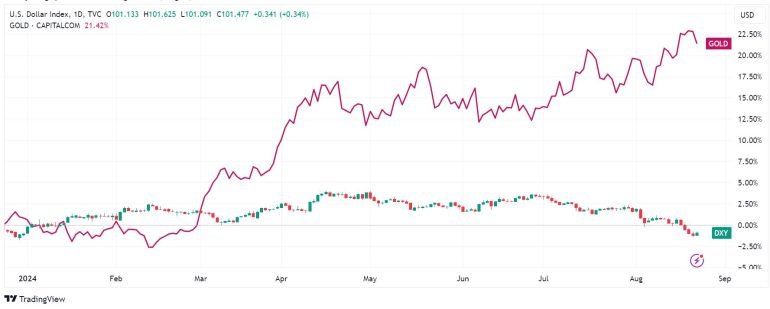
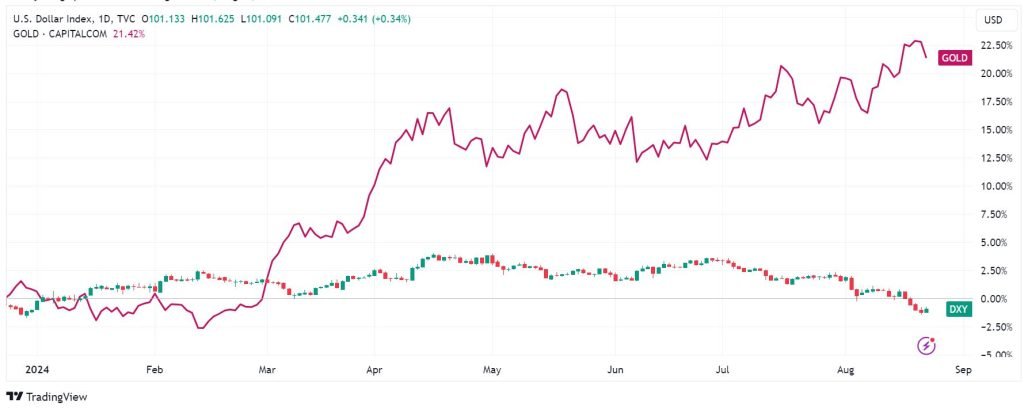
XAU/USD and Its Correlation with the DXY Index
The dollar strength index tracks the strength of the USD against a basket of major global currencies. This index has recently hit YTD lows of 100.15 and could go lower. In the event the DXY index drops below 100 points, it is very hard to see gold below $2,500.
DXY Chart
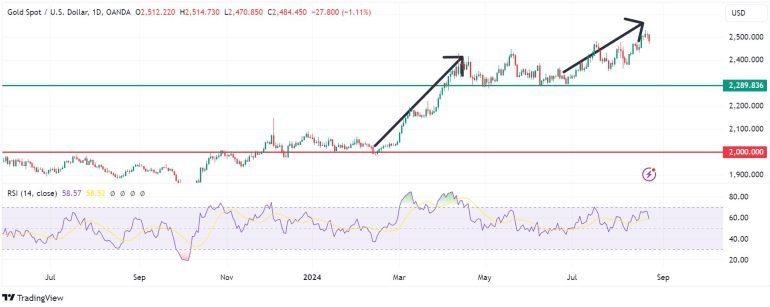
Gold Price Historical Chart
In August 2020, gold price rallied to an all-time high of $2,072.85, surpassing the previous record high of $1,924.77 it hit nine years before. With the subsequent decline, the psychologically crucial zone of $2,000 has remained evasive. However, it has remained above $1,600 since rising above it at the peak of the coronavirus pandemic in April 2020.
Gold price crashed to $1,616 on September 28, 2022. This price was about 21.88% from its highest point in 2022. This crash coincided with a period when the Federal Reserve was hiking interest rates aggressively in a bid to fight soaring inflation. It then started rising after signs emerged that inflation was starting to ease in the US.
Bullion has performed really well this year. The precious metal is up by 20.4 percent YTD, and at +3.6 percent in the last month. This has created a strong bullish undercurrent that could drive more gains in the second half of the year, especially in light of the impending Fed interest rate cuts. On the chart below, note the strong upside momentums above the $2,000 psychological level and the $2,289 marks. These could potentially serve as the near-term and medium-term support marks.
XAU/USD Historical Chart
Gold Price Forecast & Latest Analysis
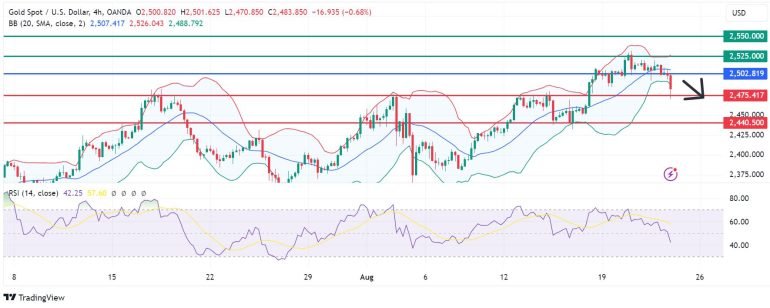
I accurately predicted that gold would hover around past the $2,300 mark in my previous forecasts.
As the price now seems to have gained strength above $2400, the pivot point will likely be at $2,502, while the immediate resistance could come at $2,525. Therefore, a break above that mark could strengthen bullishness. Furthermore, the commodity finds initial support around 2,475. A break below that mark could signal bearishness. Safe haven buying is likely to be the biggest contributor to the bullish outlook, as geopolitical risk rises in the Middle East, but better-than-expected US economic data could limit the upside for gold.
XAU/USD Latest Technical Analysis
I’ll keep posting my updated outlook on Gold and other assets in my free Telegram group, which you’re welcome to join.
Gold Price Forecast 2025
The gold price forecast 2025 is largely an extrapolation of the influential factors in the current year. At the beginning of the year, Goldman Sachs indicated that the commodities bull market observed in the past year will likely continue into the current year and beyond. Indeed, the investment bank holds that the commodities Supercycle will last for about 10 years.
The precious metal may reach new all-time highs above $2,200 an ounce based on this narrative. In addition, a tighter Fed policy and subsequent decline in economic growth will likely boost its performance as a risk-on asset.
However, even with the bullish gold price forecast 2025, competition from Bitcoin as a store of value may limit its upward potential.
Gold Price Forecast 2030
A feasible gold price forecast 2030 is founded on US dollar movements due to the existing inverse correlation. In the event of geopolitical tensions, gold may find some support in its status as a safe haven. However, its upward momentum may be limited by a rise in the demand for the greenback.
Over the past eight years, gold price has risen by about 60%. However, an assumption that the bull market will continue over the next eight years makes a surge of 50% viable. In that case, the gold price forecast for 2030 will be for the precious metal to hit a high of about $2,700 an ounce.
How to invest in gold
One of the viable ways to invest in gold is by buying bullion. It may be in coins or bars, certified with purity and weight have. Then, one can purchase or sell the physical gold to a reputable dealer. However, security reasons often lead some investors to embrace the route of futures and options.
Best gold stocks to invest in
One of the best ways to invest in gold is through stocks. In the past few years, mergers and acquisitions in the sector has led to a significant consolidation in the sector. Today, only a few large companies dominate the industry.
Barrick Gold, a company valued at $30 billion, is one of the best gold stocks to invest in. Its stock has dropped by about 7.95%. The other excellent stock to buy is Wheaton Precious Metals, which is worth over $17 billion. Unlike other gold companies, Wheaton does not do the real mining. Instead, the company has purchased rights for key gold assets.
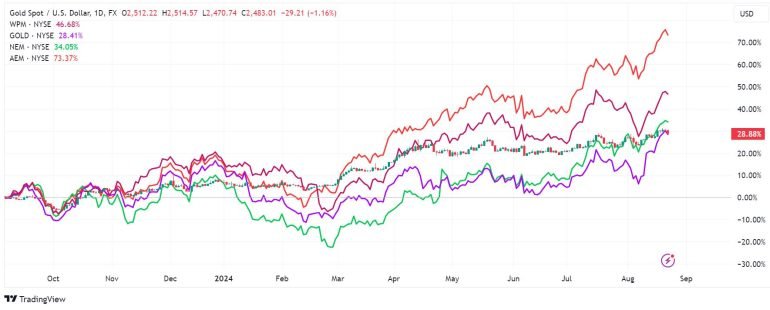
The other best gold stocks to invest in are Newmont Corporation, and Agnico Eagle mine. The chart below shows the performance of some of the biggest gold stocks in the industry.
Gold stocks chart
Gold futures
Futures are a contract in which one agrees to buy or sell the financial asset at the agreed-upon price before the expiry of the contract. For options, the investor has a chance and not an obligation to buy or sell the underlying instrument for as long as the contract is valid. To invest in gold via futures and options, one needs an account with a reputable financial broker. It is possible to trade in gold for a commission through the brokerage account.
Gold ETFs
ETFs and mutual funds are yet another viable way to invest in gold. A share of this financial instrument represents a specific amount of gold. One needs a brokerage account to trade in gold ETFs or mutual funds, like in futures and options.
In addition to the aforementioned ways of investing in gold, an investor can consider buying stocks of gold mining companies like Barrick Gold Corp. (GOLD) or Newmont Corp. (NEM). While the share price is usually correlated to gold price, the firm’s fundamentals are also influential.
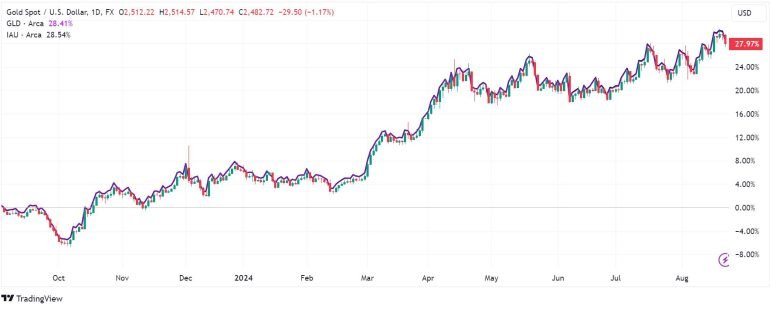
The chart below shows two of the most popular gold ETFs, the iShares Gold Trust and SPDR Gold Trust. As you can see, these ETF tend to move in sync with gold prices.
Gold ETF SPDR Gold Chart
Summary
As was the case in 2021, gold’s relation with inflation has mixed. In 2024, the trend will likely continue as inflationary pressures continue to boost the precious metal. In addition, geopolitical tension in the Middle East and the Russia-Ukraine war will continue providing safe haven tailwinds. Furthermore, Fed interest rate decisions in Starting September will have a substantial impact on gold’s upward potential.
Gold price extends corrective decline early Thursday, challenges $2,500.
The US Dollar rebounds with US Treasury bond yields after dovish Fed Minutes-induced sell-off.
All eyes turn to US Preliminary PMI data on Thursday ahead of Friday’s Fed Chair Jerome Powell’s speech.
Gold price pullback to pave the way for fresh record highs, as the daily technical setup favors buyers.
Gold price is looking to build on the previous correction in Thursday’s Asian session, challenging the key $2,500 level. Gold traders resort to profit-taking ahead of the top-tier US Preliminary S&P Global business PMI data, which could throw fresh light on the US Federal Reserve (Fed) interest-rate outlook in the countdown to Chair Jerome Powell’s Jackson Hole appearance on Friday.
Gold price awaits US PMI data for fresh buying boost
Besides, a profit-taking decline, Gold price is also bearing the brunt of a broad-based US Dollar (USD) recovery early Thursday, tracking the uptick in the US Treasury bond yields. The Greenback capitalizes on a negative shift in risk sentiment amid looming Chinese economic concerns and the Middle East geopolitical risks.
Markets also remain wary of lingering US recession fears, as they anticipate the flash S&P Global Manufacturing and Services PMI data later in the North American session. Additionally, they are adjusting their positions before Friday’s key even risk – Fed Chair Jerome Powell’s speech. Powell could use the Jackson Hole address to double down on the Fed’s dovish stance, recently highlighted by the Minutes of its July policy meeting published on Wednesday.
Most policymakers thought that “if the data continued to come in about as expected, it would likely be appropriate to ease policy at the next meeting,” the Minutes said. Further, the Minutes read that several of them would have even been willing to reduce borrowing costs in the July meeting itself.
The outrightly dovish Fed Minutes spelt doom for the US Dollar while lifting the demand for the US government bonds and the non-interest-bearing Gold price. This helped Gold price recover losses and settle modestly flat above $2,500 on Wednesday.
Earlier in the day, the US Labor Department said that Nonfarm Payrolls (NFP) for the period from April 2023 to March 2024 was lowered by 818,000. The revision represented a total downward change of about 0.5%, implying that monthly job gains during the period averaged roughly 174,000, compared to the previously reported figure of 242,000.
The NFP March benchmark revision added to the September Fed rate cut bets, weighing further on the Greenback across the board.
Markets are currently pricing in a 35% probability of 50 basis points (bps) cut at the Fed’s September 17-18 meeting and a 65% chance of a 25 bps reduction, according to the CME Group’s FedWatch Tool.
All eyes also remain centered on Fed Chairman Jerome Powell’s keynote speech in Jackson Hole on Friday for any hints on the likely size of a cut next month and whether borrowing costs are likely to be lowered at each subsequent policy meeting.
In the meantime, the Gold price downside could remain cushioned amid lingering tensions in the Middle East between Hamas and Israel after the latter did not agree to withdraw its troops from the Philadelphi corridor on the Egypt-Gaza border, Prime Minister Benjamin Netanyahu’s office said on Wednesday.
Gold price technical analysis: Daily chart
The short-term technical outlook for Gold price remains constructive, as buyers refuse to give up amid a symmetrical triangle breakout in play and a bullish 14-day Relative Strength Index (RSI)
The 14-day RSI points lower but holds well above the 50 level, currently near 63, suggesting that Gold price remains a ‘buy-the-dips’ trading opportunity.
If the Gold price retracement gathers steam, the immediate support is seen at Monday’s low of $2,486.
A breach of the latter will call for a test of the triangle resistance-turned-support, now at $2,467. Further south, the $2,450 psychological barrier will come to the rescue of Gold optimists.
Conversely, should Gold buyers recapture the record high of $2,532, the next relevant topside target is seen at the $2,550 level.
Acceptance above the latter could challenge the $2,600 round level en route to the triangle target, measured at $2,660.
Economic Indicator
S&P Global Manufacturing PMI
The S&P Global Manufacturing Purchasing Managers Index (PMI), released on a monthly basis, is a leading indicator gauging business activity in the US manufacturing sector. The data is derived from surveys of senior executives at private-sector companies from the manufacturing sector. Survey responses reflect the change, if any, in the current month compared to the previous month and can anticipate changing trends in official data series such as Gross Domestic Product (GDP), industrial production, employment and inflation. A reading above 50 indicates that the manufacturing economy is generally expanding, a bullish sign for the US Dollar (USD). Meanwhile, a reading below 50 signals that activity in the manufacturing sector is generally declining, which is seen as bearish for USD.
Natural Gas (NG) is trading at $2.242, up 0.35%. On the 2-hourly chart, the pivot point is set at $2.26. Immediate resistance levels are at $2.30, $2.35, and $2.41, indicating potential upward movement if these levels are surpassed.
On the downside, immediate support is found at $2.20, followed by $2.15 and $2.09, which is critical to watch if the price declines.
Technical indicators present a mixed outlook. The 50-day EMA is at $2.17, while the 200-day EMA stands at $2.31. These figures suggest a bearish outlook below the pivot point of $2.26. A break above this level could shift sentiment to a more bullish stance.
The US Dollar eases further after a downward revision to job creation data.
The Federal Open Market Committee will release the Minutes of the July meeting.
XAU/USD corrective decline may continue, but a steeper decline is out of the picture.
XAU/USD trades with modest losses mid-Wednesday, confined to a tight intraday range. The pair briefly dipped below the $2,500 mark, but continued pressure on the US Dollar helped it trim intraday losses.
Investors await fresh clues from the Federal Open Market Committee (FOMC) Minutes. The Federal Reserve (Fed) met on July 31 and surprised market players with a more dovish tone, as officials showed fewer concerns about inflation and shifted the focus to the employment sector, acknowledging it has been loosening. Chairman Jerome Powell noted in the following press conference that a September rate cut was “on the table,” something the Minutes should somehow confirm.
In the meantime, a revision of Nonfarm Payrolls (NFP) showed the US economy created 818K fewer jobs than originally reported in the twelve months to March 2024, according to the Bureau of Labor Statistics. The actual job growth was then roughly 30% less than initially reported. The news further supported the case of an upcoming interest rate cut, maintaining the USD on the losing side.
XAU/USD short-term technical outlook
The daily chart for XAU/USD shows the pair holds above all its moving averages, with a bullish 20 Simple Moving Average (SMA) accelerating north at around $2,440, while above also bullish longer ones. Technical indicators, in the meantime, lack directional strength but remain well above their midlines, limiting the chances of a downward movement.
In the near term, and according to the 4-hour chart, the corrective slide continues. XAU/USD is currently battling a bullish 20 SMA, while the 100 and 200 SMA gained upward traction far below the current level. Finally, technical indicators edged marginally lower, with the Momentum indicator approaching its 100 line. The overall picture is not enough to suggest a steeper decline ahead, although a clear break below the $2,500 mark following FOMC Minutes could open the door for a corrective extension in the upcoming sessions.
Silver price trades sideways below $30.00 with FOMC minutes in focus.
The US Dollar and bond yields remain in a bearish trajectory on Fed rate-cut optimism.
Fed Powell’s speech at the JH symposium will be the key event this week.
Silver price (XAG/USD) trades in a tight range below the psychological resistance of $30.00, with investors focusing on the Federal Open Market Committee (FOMC) minutes for the July monetary policy, which will be published at 18:00 GMT.
Investors await the FOMC minutes release as it will provide fresh cues about the interest rate path this year. In the July meeting, the Fed left interest rates unchanged in the range of 5.25%-5.50% but assured that policymakers are prepared to adjust the monetary policy stance in case risks emerge that could delay the attainment of banks’ goals, such as inflation at 2% along with the maintenance of full employment.
Ahead of the FOMC minutes, the US Dollar (USD) exhibits a subdued performance and remains near seven-month lows. The US Dollar Index (DXY), which tracks the Greenback’s value against six major currencies, hovers near 101.40. 10-year US Treasury yields decline to near 3.80%. Lower yields on interest-bearing assets reduce the opportunity cost of holding an investment in non-yielding assets, such as Silver.
This week, the US Dollar is expected to remain volatile as Fed Chair Jerome Powell is scheduled to speak at the Jackson Hole (JH) Symposium on Friday. Fed Powell would indicate how much the central bank could cut interest rates this year.
Silver technical analysis
Silver price delivers a bullish reversal as a decisive break above August 2 high of $29.20 has faltered the lower high lower low formation on a four-hour timeframe. An upward-sloping 20-period Exponential Moving Average (EMA) near $29.20 is expected to act as a cushion for Silver price bulls.
The 14-period Relative Strength Index (RSI) falls to near 60.00, suggesting that the bullish momentum has concluded for now. However, the bullish bias remains intact.
Silver four-hour chart
Silver FAQs
Silver is a precious metal highly traded among investors. It has been historically used as a store of value and a medium of exchange. Although less popular than Gold, traders may turn to Silver to diversify their investment portfolio, for its intrinsic value or as a potential hedge during high-inflation periods. Investors can buy physical Silver, in coins or in bars, or trade it through vehicles such as Exchange Traded Funds, which track its price on international markets.
Silver prices can move due to a wide range of factors. Geopolitical instability or fears of a deep recession can make Silver price escalate due to its safe-haven status, although to a lesser extent than Gold’s. As a yieldless asset, Silver tends to rise with lower interest rates. Its moves also depend on how the US Dollar (USD) behaves as the asset is priced in dollars (XAG/USD). A strong Dollar tends to keep the price of Silver at bay, whereas a weaker Dollar is likely to propel prices up. Other factors such as investment demand, mining supply – Silver is much more abundant than Gold – and recycling rates can also affect prices.
Silver is widely used in industry, particularly in sectors such as electronics or solar energy, as it has one of the highest electric conductivity of all metals – more than Copper and Gold. A surge in demand can increase prices, while a decline tends to lower them. Dynamics in the US, Chinese and Indian economies can also contribute to price swings: for the US and particularly China, their big industrial sectors use Silver in various processes; in India, consumers’ demand for the precious metal for jewellery also plays a key role in setting prices.
Silver prices tend to follow Gold’s moves. When Gold prices rise, Silver typically follows suit, as their status as safe-haven assets is similar. The Gold/Silver ratio, which shows the number of ounces of Silver needed to equal the value of one ounce of Gold, may help to determine the relative valuation between both metals. Some investors may consider a high ratio as an indicator that Silver is undervalued, or Gold is overvalued. On the contrary, a low ratio might suggest that Gold is undervalued relative to Silver.
 Price Forecast: Will Powell’s Speech Spark a Gold Rally or Trigger a Sell-Off?")


