The main tag of GoldPrice Articles.
You can use the search box below to find what you need.
[wd_asp id=1]
The main tag of GoldPrice Articles.
You can use the search box below to find what you need.
[wd_asp id=1]
Gold buyers have been reluctant to give up, but XAU/USD’s behaviour suggests they may face a tough battle in the upcoming days. The rally that saw the Gold price double in a little over a year and drove the bright metal to record highs came to a halt at the end of January, when the price dropped $1,200 per ounce in a couple of days.
The subsequent recovery was initially encouraging, but continued failure to retain gains beyond the $5,000 is discouraging buyers more as time goes by. Even worse, risk-off peaks tend to benefit the Greenback, even against the safe-haven par excellence.
The battle between sellers and buyers is likely to continue, yet the firsts are slowly gaining ground. Following failure to retain the psychological mark, Gold is making lower lows on a daily basis, usually a sign of further declines ahead.
There’s one word to sum it up: resilience. The United States (US) economy has proven resilient, with steady growth despite fluctuations in the labor market and stubborn inflation. It has also proved resilient despite US President Trump’s foreign and protectionist policies, and even with the Federal Reserve’s independence under threat. One may love it or hate it, but there’s no doubt the US is the world’s largest economy, and there’s nobody out there to challenge the crown.
Gold drew a line in the sand in early February, bottoming at $4,402. As long as the price remains above the level, bulls will retain some hopes, yet the closer the level comes, the more discouraged they will be.
In the near term, and according to the 4-hour chart, XAU/USD is bearish. The 20-period Simple Moving Average (SMA) has slipped beneath the 100-period SMA, both tilt lower, and are above the current level, providing near-term dynamic resistance at $4,967 and $5,017. Meanwhile, a mildly bullish 200-period SMA provides support around $4,827. The Momentum indicator aims marginally lower within neutral levels, yet the Relative Strength Index (RSI) indicator at 33 hints at lower lows ahead.
In the daily chart, XAU/USD finally broke below the 20-day SMA, now capping advances in the $4,990 area. Price holds above the longer SMAs, which, anyway, develop below the critical $4,400 region. Finally, technical indicators aim firmly lower, with the Momentum dipping into negative territory and the RSI crossing its midline to the downside, in line with mounting selling pressure.
(The technical analysis of this story was written with the help of an AI tool.)
Silver price (XAG/USD) trades lower to near $73.70 on Tuesday at the time of writing, down 3.50% on the day. The white metal has been under pressure as dovish Federal Reserve (Fed) expectations remain capped despite cooling United States (US) inflation in January.
Theoretically, immaterial dovish Fed prospects in the near term weigh on non-yielding assets, such as Silver.
The data released on Friday showed that the US headline inflation dropped to 2.4% YoY from 2.7% in December. In the same period, the core Consumer Price Index (CPI) – which excludes volatile food and energy items – grew moderately by 2.5%, as expected, against the previous reading of 2.6%.
Meanwhile, investors brace for high volatility in the North American session as US markets will open after an extended weekend.
This week, the major trigger for the Silver price will be the release of Federal Open Market Committee (FOMC) minutes of the January policy meeting on Wednesday. In the meeting, the Federal Reserve left interest rates unchanged in the range of 3.50%-3.75%.
Globally, investors will pay attention to the second round of talks between the US and Iran in Geneva during the day. Delegates from both nations are expected to discuss the nuclear programme in Tehran. Ahead of talks, US President Donald Trump has signaled that Iran will make a deal, while warning that the nation will face consequences if they don’t resolve issues.
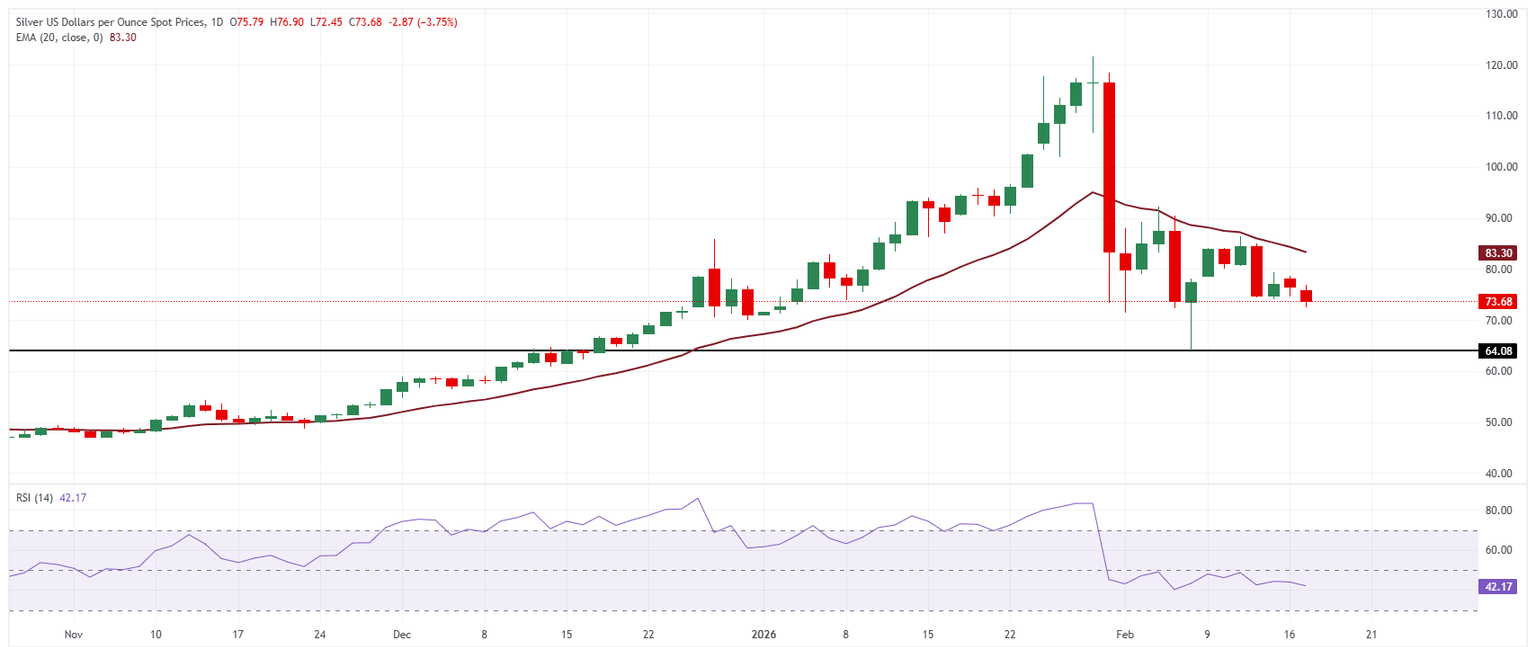
In the daily chart, XAG/USD trades at $73.68. The 20-day exponential moving average descends to $83.30, signaling a weakening short-term structure. Price holds below this gauge, keeping rebounds capped and leaving sellers in control. RSI (14) at 42.17 (neutral) stays under the midline, indicating momentum favors the downside without oversold conditions.
A daily close back above the falling 20-day EMA would ease immediate pressure and improve the near-term tone. Absent that, the path of least resistance remains lower, with failed bounces prone to being faded as the average continues to cap recovery attempts.
(The technical analysis of this story was written with the help of an AI tool.)
Silver is a precious metal highly traded among investors. It has been historically used as a store of value and a medium of exchange. Although less popular than Gold, traders may turn to Silver to diversify their investment portfolio, for its intrinsic value or as a potential hedge during high-inflation periods. Investors can buy physical Silver, in coins or in bars, or trade it through vehicles such as Exchange Traded Funds, which track its price on international markets.
Silver prices can move due to a wide range of factors. Geopolitical instability or fears of a deep recession can make Silver price escalate due to its safe-haven status, although to a lesser extent than Gold’s. As a yieldless asset, Silver tends to rise with lower interest rates. Its moves also depend on how the US Dollar (USD) behaves as the asset is priced in dollars (XAG/USD). A strong Dollar tends to keep the price of Silver at bay, whereas a weaker Dollar is likely to propel prices up. Other factors such as investment demand, mining supply – Silver is much more abundant than Gold – and recycling rates can also affect prices.
Silver is widely used in industry, particularly in sectors such as electronics or solar energy, as it has one of the highest electric conductivity of all metals – more than Copper and Gold. A surge in demand can increase prices, while a decline tends to lower them. Dynamics in the US, Chinese and Indian economies can also contribute to price swings: for the US and particularly China, their big industrial sectors use Silver in various processes; in India, consumers’ demand for the precious metal for jewellery also plays a key role in setting prices.
Silver prices tend to follow Gold’s moves. When Gold prices rise, Silver typically follows suit, as their status as safe-haven assets is similar. The Gold/Silver ratio, which shows the number of ounces of Silver needed to equal the value of one ounce of Gold, may help to determine the relative valuation between both metals. Some investors may consider a high ratio as an indicator that Silver is undervalued, or Gold is overvalued. On the contrary, a low ratio might suggest that Gold is undervalued relative to Silver.
Copper price continued its negative moves, conforming its surrender to the previously suggested bearish corrective scenario, fluctuating near $5.6780 level, the stability below $5.9700 barrier and the continuation of providing negative momentum by stochastic will increase the chances of facing $5.5100 support, and breaking it will force it to suffer extra losses by reaching $5.3600 initially, reaching the next support at $5.1000 level.
The expected trading range for today is between $5.5100 and $5.8500
Trend forecast: Bearish
Spot Gold has spent most of this Monday trading in a tight range around the $5,000 mark, shedding some ground in the American afternoon, yet lacking directional momentum. A holiday in the United States (US), as the country celebrates Presidents’ Day, exacerbates the quietness after the European close.
Still, the Greenback trades with modest gains across most major rivals, as recent US data hinted at resilient economic progress, while leaving the door open for the Federal Reserve (Fed) to cut interest rates. A clearer picture should appear on Friday, when the US will publish Personal Consumption Expenditures (PCE) Price Index data, the Fed’s favorite inflation gauge. On the same day, the country will release the preliminary estimate of the Q4 Gross Domestic Product (GDP).
In the meantime, investors will look at political headlines for direction. Negotiations between the US and Iran are set to continue on Tuesday, in Geneva, with Iranian Foreign Minister Abbas Araghchi announcing he is coming with “real ideas to achieve a fair and equitable deal.”
At the same time, US President Donald Trump met Israeli Prime Minister Benjamin Netanyahu over the weekend. Trump said afterwards that he would support Israeli strikes on Iran’s ballistic missile program if negotiations between Washington and Tehran fail.
From a technical point of view, the 4-chart shows that XAU/USD is neutral. The pair seesaws right below a flat 20-period Simple Moving Average (SMA), which converges with the 100-period SMA, limiting advances around $5,020. The 200-period SMA at $4,810.85 maintains a modest upward slope, providing relevant support. Technical indicators, in the meantime, head nowhere within neutral levels, reflecting the absence of a certain trend.
In the daily chart, XAU/USD battles to remain above a bullish 20-day Simple Moving Average (SMA), which keeps rising above the 100- and 200-day SMAs. The 20-day SMA currently stands at $4,988.67, offering immediate dynamic support. Meanwhile, the Momentum indicator heads south below its midline, indicating bearish pressure building as upside impetus fades. Finally, the Relative Strength Index (RSI) also heads south yet at 54, not enough to confirm lower lows ahead.
(The technical analysis of this story was written with the help of an AI tool.)
Platinum price forced to provide slow trading in the last period due to the continuation of the main indicators’ contradiction, especially with the stability of moving average 55 below the current trading, to form an intraday support at $1910.00 level.
In general, we will keep preferring the bearish corrective scenario, depending on the stability at $2245.00 and the continuation of the bearish momentum by stochastic, we will keep waiting for extra support at $1950.00 and breaking it might extend the losses directly towards $1880.00 reaching the next support at $1785.00.
The expected trading range for today is between $1950.00 and $2100.00
Trend forecast: Bearish
Copper price began this morning, activating with the negative factors that are represented by the stability of the barrier at $5.9700 besides the continuation of providing negative momentum, fluctuating near $5.7000 level.
We will keep our bearish corrective suggestion until facing extra support level at $5.5100, representing key for detecting the expected targets in the medium period trading
The expected trading range for today is between $5.5100 and $5.8500
Trend forecast: Bearish
Gold is on the defensive but holds the $5,000 threshold in early trading on Monday. Market holidays in the United States (US) and China leave the bright metal trading listlessly, so far.
Gold buyers seem to have taken a breather at the start of the week on Monday, following Friday’s solid return. Traders also take account of the latest US inflation and jobs data, while bracing for the US Gross Domestic Product for the fourth quarter of 2025.
The key US economic data will not be released until Friday and hence, China’s Lunar New Year holiday lull and sentiment surrounding the Fed and artificial intelligence (AI) concerns-driven rotation could continue to lead the way for the precious metal traders.
On Friday, the unexpected slowdown in the US Consumer Price Index (CPI) inflation data for January bolstered bets that the US Federal Reserve will deliver at least two interest rate cuts this year.
Futures imply a 68% chance the Fed will cut in June and have 62 basis points of easing priced in for the year, per Reuters.
The US Labor Department said that the CPI rose 0.2% last month after an unrevised 0.3% gain in December, falling short of the estimated increase of 0.3%. The headline annual inflation fell to 2.4% in January, against the forecast of 2.5%.
Excluding the volatile food and energy components, the CPI increased 0.3% after rising by an unrevised 0.2% in December, matching the market expectations.
US Treasury bond yields slipped on increased dovish Fed rate cut bets, smashing the US Dollar (USD) across the board, while lifting the USD-denominated Gold price.
The 21-day Simple Moving Average (SMA) climbs above the 50-, 100- and 200-day readings, underscoring a firm bullish alignment. All SMAs slope higher while price holds above them. The 21-day SMA at $4,973.78 offers immediate dynamic support. The 14-day Relative Strength Index stands at 54.62 (neutral), indicating momentum has normalized after the recent surge. Measured from the $5,597.89 high to the $4,401.99 low, the 50% retracement at $4,999.94 and the 61.8% retracement at $5,141.05 cap the recovery and would need to give way for an upside continuation.
The medium-term structure stays positive as the 50- and 100-day SMAs continue to rise above the 200-day one, and the price retains altitude over these baselines. Initial downside cushions emerge at the 50-day SMA at $4,644.95, while the 100-day SMA at $4,360.91 marks a deeper floor. A daily close above the immediate retracement barriers would open room for a continuation of the primary trend, whereas rejection near them would keep trade confined to the 21-day SMA-led range.
(The technical analysis of this story was written with the help of an AI tool.)
Gold has played a key role in human’s history as it has been widely used as a store of value and medium of exchange. Currently, apart from its shine and usage for jewelry, the precious metal is widely seen as a safe-haven asset, meaning that it is considered a good investment during turbulent times. Gold is also widely seen as a hedge against inflation and against depreciating currencies as it doesn’t rely on any specific issuer or government.
Central banks are the biggest Gold holders. In their aim to support their currencies in turbulent times, central banks tend to diversify their reserves and buy Gold to improve the perceived strength of the economy and the currency. High Gold reserves can be a source of trust for a country’s solvency. Central banks added 1,136 tonnes of Gold worth around $70 billion to their reserves in 2022, according to data from the World Gold Council. This is the highest yearly purchase since records began. Central banks from emerging economies such as China, India and Turkey are quickly increasing their Gold reserves.
Gold has an inverse correlation with the US Dollar and US Treasuries, which are both major reserve and safe-haven assets. When the Dollar depreciates, Gold tends to rise, enabling investors and central banks to diversify their assets in turbulent times. Gold is also inversely correlated with risk assets. A rally in the stock market tends to weaken Gold price, while sell-offs in riskier markets tend to favor the precious metal.
The price can move due to a wide range of factors. Geopolitical instability or fears of a deep recession can quickly make Gold price escalate due to its safe-haven status. As a yield-less asset, Gold tends to rise with lower interest rates, while higher cost of money usually weighs down on the yellow metal. Still, most moves depend on how the US Dollar (USD) behaves as the asset is priced in dollars (XAU/USD). A strong Dollar tends to keep the price of Gold controlled, whereas a weaker Dollar is likely to push Gold prices up.
The EURCHF continued to form bearish waves in the last period, to reach the second target at 0.9075 which represents %78.2 Fibonacci extension level.
The main indicators contradiction might push the price to provide mixed trading, however the negative stability below 0.9215 level and the stability of the moving average 55 above the current trading, these factors make us keep the negative scenario, which might target 0.8975 level reaching towards 0.8860.
The expected trading range for today is between 0.9030 and 0.9155
Trend forecast: Bearish
Platinum price remains under the dominance of the bearish trend until this moment, due to its stability below $2245.00 level, forming mixed trading to keep its stability near $2040.00.
We will keep waiting for the price to activate with stochastic negativity, to repeat the pressure on $1950.00 level, and breaking it will open the way for resuming the bearish moves until reaching the extra targets that are located at $1880.00 and $1785.00.
The expected trading range for today is between $1950.00 and $2100.00
Trend forecast: Bearish


