The main tag of GoldPrice Articles.
You can use the search box below to find what you need.
[wd_asp id=1]
The main tag of GoldPrice Articles.
You can use the search box below to find what you need.
[wd_asp id=1]
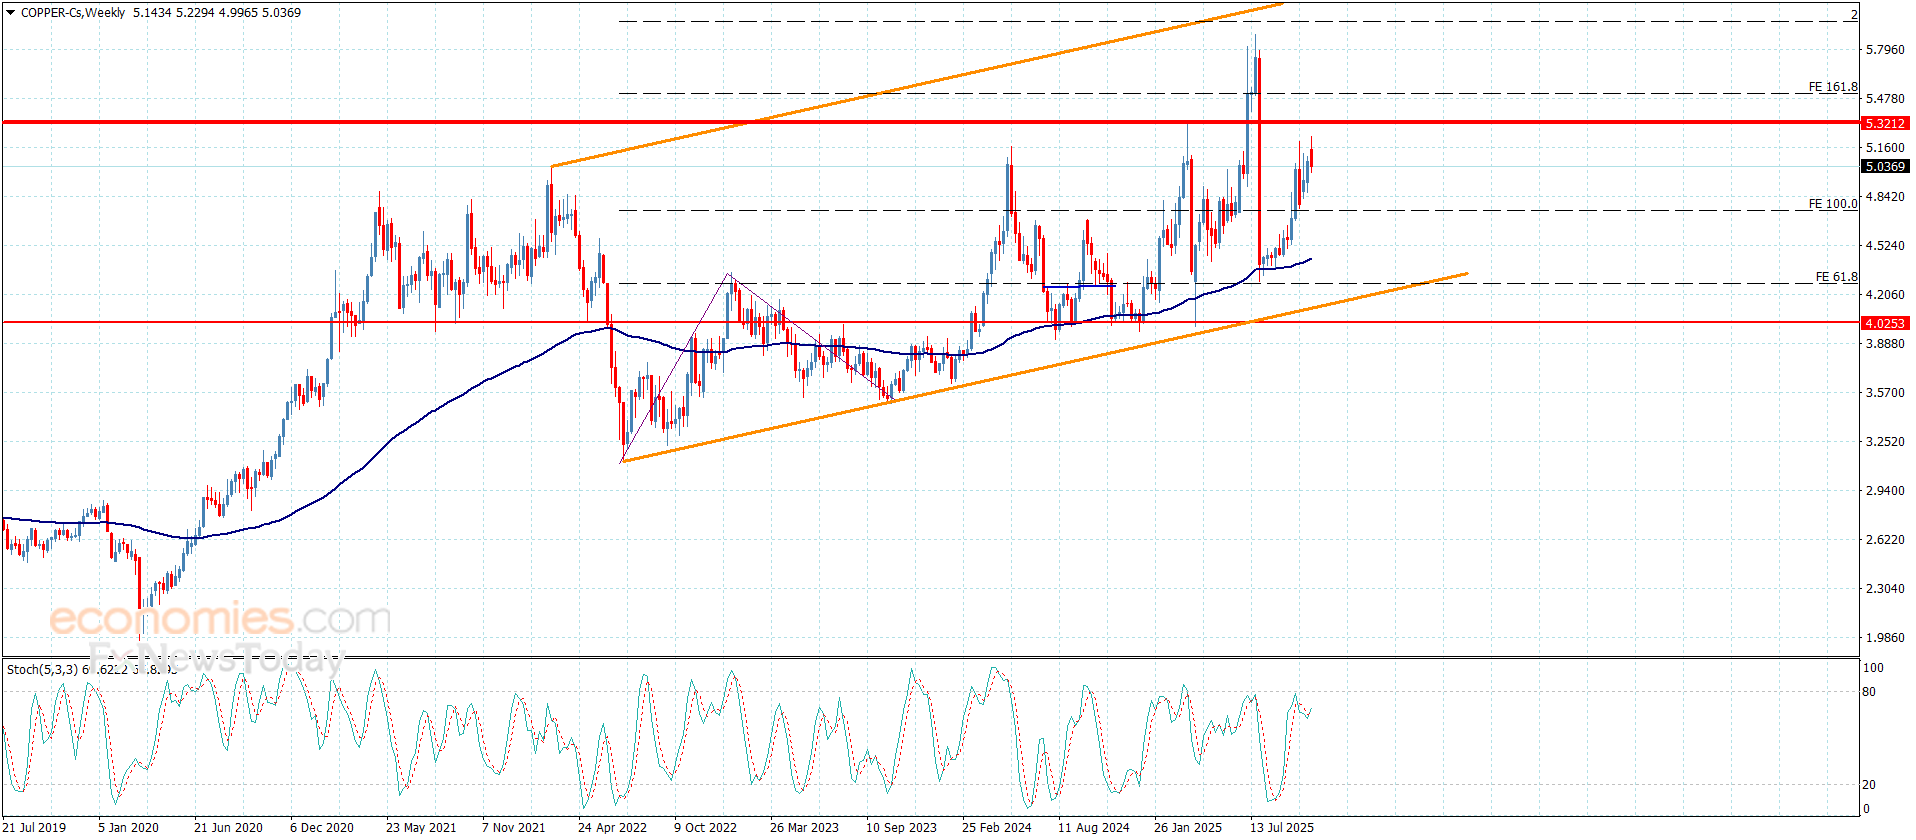
Copper price remains affected by the stability of the extra barrier near $5.2000, reducing the chances of resuming the bullish attack, providing more sideways trading by its stability near $5.0500.
Reminding you that the bullish scenario will remain valid if the price settles above the support at $4.7500, to increase the chances of gathering the required positive momentum to surpass the barrier and target extra positive stations that might begin at $5.3200, while reaching below this support and providing negative close will force it to provide bearish corrective trading, to suffer clear losses by reaching $4.5100 and $4.3500.
The expected trading range for today is between $4.9000 and $5.2000
Trend forecast: Fluctuated within the bullish trend
Gold has reverted to the $4,000 threshold in Asian trades on Monday, but buyers trade with caution, awaiting the private data releases from the United States (US). The US ISM Manufacturing PMI is due later in the day.
Safe-haven flows return at the start of the week on Monday, as investors fret over the economic impact of the prolonged US government shutdown, which is set to become the longest on record.
Further, weak Chinese private Manufacturing PMI data and renewed US-China trade risks weigh on sentiment. The RatingDog China General Manufacturing PMI, compiled by S&P Global, declined to 50.6 in October from the six-month high of 51.2 in September, missing markets’ expectations of 50.9.
Meanwhile, US President Donald Trump came out on the wires and noted that he plans to block China from obtaining Nvidia’s most advanced semiconductor technology, per CBS News.
His comments could refuel US-China trade tensions that were eased last week following the meeting between Trump and Chinese President Xi Jinping last Thursday on the sidelines of the APEC Summit in South Korea.
The prevalent risk-averse market environment injects life into the traditional store of value, Gold, after it continued its previous downside in the early hours.
Additionally, a pause in the US Dollar’s winning streak helps Gold stage a decent comeback.
Later in the day, Gold traders will closely monitor the US ISM Manufacturing PMI data, in the absence of any official publication of statistics, for fresh hints on the health of the American economy, especially after the cautious interest rate cut by the US Federal Reserve (Fed) last week.
Markets are now pricing in a 69% probability of a 25 bps Fed rate cut in December compared with a 91.7% chance a week ago, the CME Group’s FedWatch tool shows.
That being said, the US-China trade headlines and speeches from Fed officials will also be eyed for any impact on risk sentiment, eventually affecting the safe-haven Gold.
The daily chart shows that Gold price is flirting with the $4,000 barrier, after having closed the week above it on Friday.
Adding credence to the upside bias, the 14-day Relative Strength Index (RSI) stays bullish, while sitting just above the 50 level.
If the renewed upside extends, buyers will target the $4,050 psychological level, followed by the 21-day Simple Moving Average (SMA) at $4,082
The next critical resistance is aligned at $4,129 – the 23.6% Fibonacci Retracement level of the parabolic rise to the record high that began on August 19.
Conversely, the immediate support is seen at the 38.2% Fibo level at $3,973, below which a test of the 50% Fibo of $3,847 will be inevitable.
Thereafter, the 50-day SMA at $3,833 will come to the rescue of buyers. A sustained break below the latter will put the $3,800 level at risk.
The Institute for Supply Management (ISM) Manufacturing Purchasing Managers Index (PMI), released on a monthly basis, is a leading indicator gauging business activity in the US manufacturing sector. The indicator is obtained from a survey of manufacturing supply executives based on information they have collected within their respective organizations. Survey responses reflect the change, if any, in the current month compared to the previous month. A reading above 50 indicates that the manufacturing economy is generally expanding, a bullish sign for the US Dollar (USD). A reading below 50 signals that factory activity is generally declining, which is seen as bearish for USD.
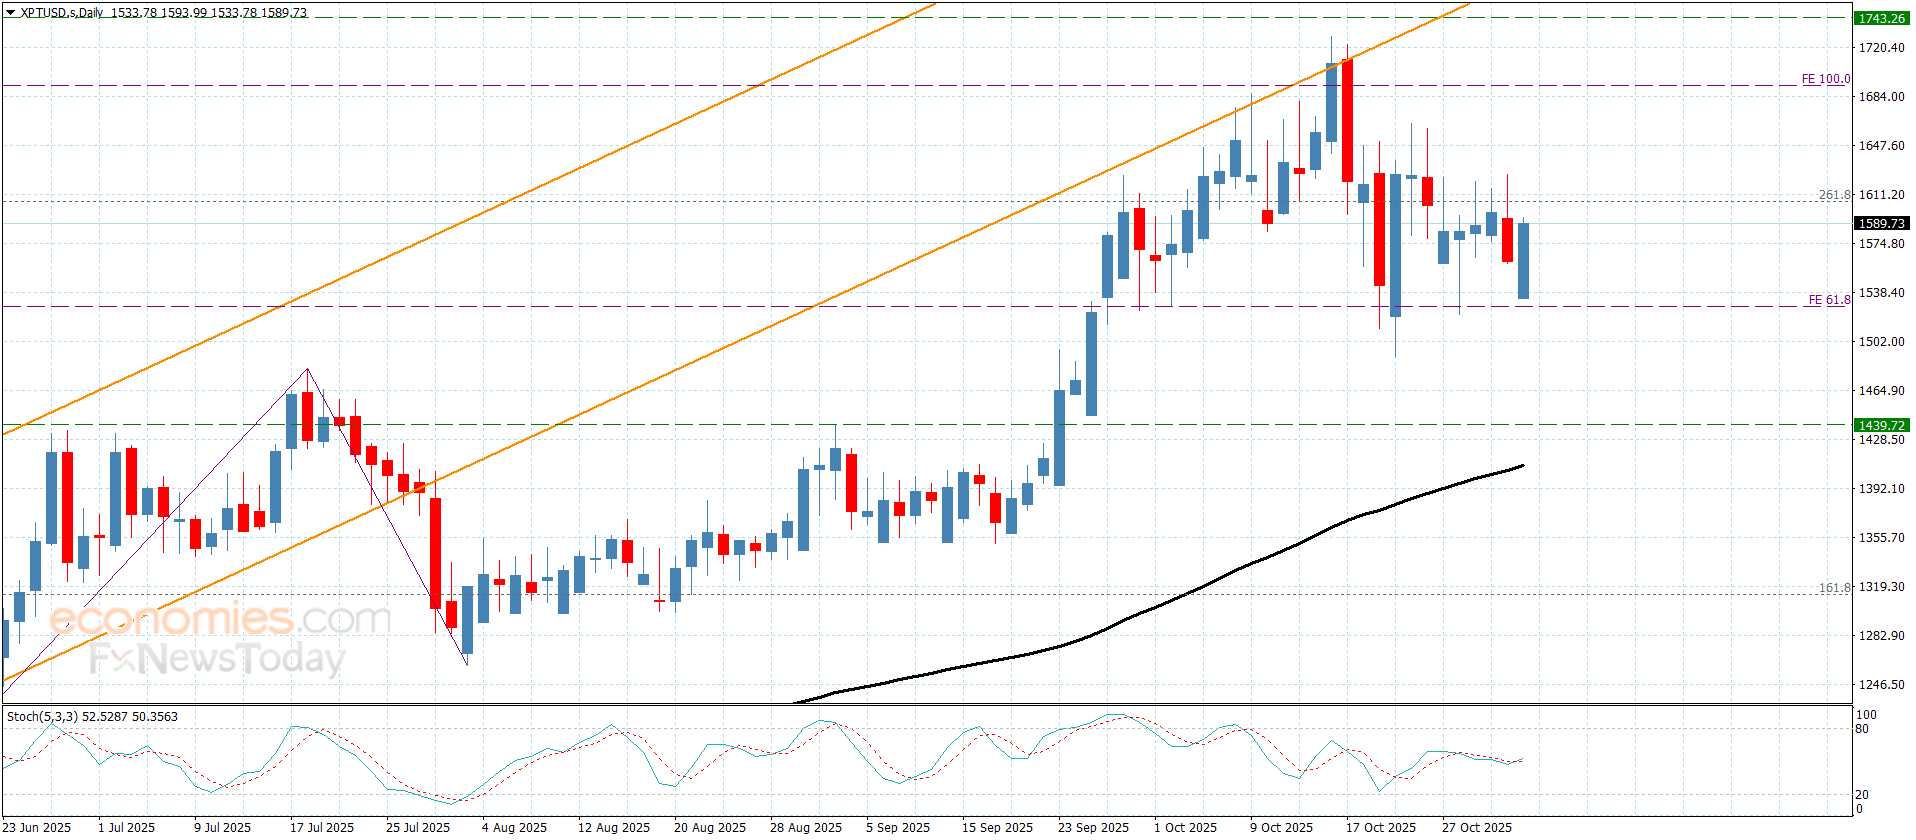
Silver price settled higher in its last intraday trading, after a series of consecutive gains, the price successfully breached bearish corrective trendline, leading it to surpass the resistance of its EMA50, to get rid of its negative pressure, on the other hand, this rise led the relative strength indicators to reach overbought levels, which may obstruct the continuation of these gains on the near-term basis, especially with the emergence of negative overlapping signals.
Get high-accuracy trading signals delivered directly to your Telegram. Subscribe to specialized packages tailored for the world’s top markets:
Full VIP signals performance report for 13-17, October 2025:
View Full Performance Report Telegram (https://t.me/besttradingsignalstocksbot?start=p88d632b0-66dd-11f0-a948-13815052d5ae)
The 20-day line, now at $4,086, was decisively breached last week, triggering a bearish retracement low at $3,886 — a critical support level. The breakdown was accompanied by additional bearish developments, including a drop below the top of a near-term rising trend channel and the prior low of $4,003. With key support now broken, the current upswing is testing that former support as resistance, but bulls have shown little conviction, barely extending beyond a tight three-day range sitting directly on support.
Rallies into the 10-day line at $4,070 and 20-day average at $4,086 form a formidable resistance zone. Expect resistance to turn price back down and fail the rally. The 10-day, now below the 20-day, takes on greater significance as dynamic resistance. A sustained advance above the 20-day would target the top rising channel line and a prior three-day resistance shelf from $4,144 to $4,161, where sellers could reassert control.
The pattern strongly suggests at least another leg down before the correction completes. If the 20-day cannot be reached, it signals persistent overhanging selling pressure likely resolving to the downside. The 20-day’s long-standing role as dynamic support since August’s advance makes the dynamics of the first pullback higher particularly significant — a test as resistance is expected before sellers regain full control and push lower.
The close below $3,972 is decisive — below it risks $3,886, above it tests $4,086. Resistance caps rallies, but failure to reach the 20-day flags deeper weakness. Watch $4,070-$4,086 closely — a break opens $4,144, while rejection targets lower support. The bearish crossover and weak rally favor sellers until proven otherwise.
For a look at all of today’s economic events, check out our economic calendar.
Why is the U.S. natural gas price rising today?
That was the question Rigzone asked Phil Flynn, a senior market analyst at the PRICE Futures Group, in an exclusive interview on Friday.
In response, Flynn told Rigzone that Thursday’s natural gas injection “was right in line” and added that “now we are getting forecasts indicating colder conditions for late October and early November”, which he outlined “have led to increased purchasing activity in major U.S. regions, including the Midwest and Northeast”.
“We saw initial weather models suggested a return of warmer temperatures, momentarily dampening the rally. Subsequent projections of below-normal temperatures have renewed bullish market sentiment,” Flynn added.
“This trend is consistent with global developments. Cold weather across Europe and Asia is reducing inventories, with European stocks declining by 11 percent since early October and supporting elevated benchmark prices such as Henry Hub,” he continued.
In its latest weekly natural gas storage report, which was released on Thursday and included data for the week ending October 24, the U.S. Energy Information Administration (EIA) noted that working gas in storage was 3,882 billion cubic feet as of October 24, according to its estimates.
“This represents a net increase of 74 billion cubic feet from the previous week,” the EIA said in that report.
“Stocks were 29 billion cubic feet higher than last year at this time and 171 billion cubic feet above the five-year average of 3,711 billion cubic feet. At 3,882 billion cubic feet, total working gas is within the five-year historical range,” it added.
When he was asked why the U.S. natural gas price is rising today in a separate exclusive interview on Friday, Art Hogan, Chief Market Strategist at B. Riley Wealth, pointed out that “U.S. natural gas futures successfully tested the important support level of $3.27 earlier this week and now has risen past $4.1 per MMBtu [million British thermal units], the highest in seven months”.
“Expectations of colder weather in the U.S. ahead of the winter supported demand for gas-intensive heating. Meanwhile, the average flow of gas to the eight big U.S. LNG export plants were at 16.5 billion cubic feet per day in October, well above the 15.7 billion cubic feet per day from the previous month to set up a fresh record ahead of the turn of the month,” he added.
Hogan went on to state that “high LNG flows were aligned with added demand from Europe as the gradual shun of Russian gas coincided with lower stocks in gas trading hubs, while the U.S. Presidential administration pressed for pledges of U.S. energy imports for Asian countries negotiating trade deals”.
In an EBW Analytics Group report sent to Rigzone by the EBW team on Friday, Eli Rubin, an energy analyst at the company, said the December natural gas contract “is nearing technical resistance at the 100-day moving average of $4.13 per MMBtu for the first time since June, with the market transitioning away from storage oversupply fears toward a robust structural winter narrative”.
“Fundamentally, though, the near to medium term remains very well supplied,” Rubin said in that report.
Rubin highlighted in this report that “daily LNG is skyrocketing, with early-cycle nominations smashing record highs by 0.6 billion cubic feet per day”.
“Strong Gulf Coast demand drove Henry Hub spot prices to $3.45 per MMBtu – the highest level since mid-July,” he added.
In the report, Rubin went on to state that “December contract strength, despite this week’s 25 billion cubic foot bearish weather shift and storage on track to surpass 3,950 billion cubic feet, signals upside momentum – and risks that early-winter optimism may exceed fundamentals”.
“While higher supply and technical resistance may slow upside … momentum appears quite strong into November,” he said.
To contact the author, email andreas.exarheas@rigzone.com
Used primarily as a bargaining tool to encourage Putin to return to the negotiating table regarding the Russia-Ukraine conflict, markets are seriously questioning the effectiveness of recent sanctions.
While predictably, the Kremlin made comments shortly after the announcement to suggest that the domestic Russian oil industry would be unaffected by new American sanctions, markets are now taking these comments more seriously.
This goes double for Vladimir Putin, who went on record to say he would not be “cowed” by other nations into making concessions about Ukraine, while simultaneously boasting about the success of new nuclear technology.
While it is understandable that Trump wants to target Russian fossil fuels, with the three largest companies by market cap in Russia, Lukoil, Rosneft, and Gazprom, all being energy corporations, it will take more supply-side risk to secure higher pricing for WTI, which is on pace for its worst yearly performance since 2020.
As expected, the level of risk premium priced into WTI markets has reduced significantly this week, not only due to the above, but also because of the market’s inherent nature: sudden news events often cause the markets to overreact.
Coffee beans in canvas sack by Bragin Alexey via Shutterstock
December arabica coffee (KCZ25) today is down -2.30 (-0.59%), and January ICE robusta coffee (RMF26) is down -7 (-0.15%).
Coffee prices are under pressure today but remain above Tuesday’s 2-week lows. Prices are sliding amid forecasts of rain this week in key coffee-growing areas of Brazil, which would partially alleviate the dry conditions from last week. Somar Meteorologia reported Monday that Brazil’s largest arabica coffee-growing area, Minas Gerais, received only 0.3 mm of rain during the week ended October 24, or 1% of the historical average.
Arabica coffee prices are also being undercut by speculation that the US may soon lift its 50% tariff on Brazilian coffee. On Monday, Brazil’s President Luiz Inacio Lula da Silva said he had a “surprisingly good” meeting with President Trump and said there could be a “definitive solution” on US-Brazil trade within days.
Shrinking ICE coffee inventories are supportive for prices. The 50% tariffs imposed on US imports from Brazil have led to a sharp drawdown in ICE coffee inventories. ICE-monitored arabica inventories fell to a 1.5-year low of 446,475 bags on Wednesday, and ICE robusta coffee inventories fell to a 3.25-month low of 6,111 lots. American buyers are voiding new contracts for Brazilian coffee purchases due to the 50% tariffs on US imports from Brazil, thereby tightening US supplies, as about a third of America’s unroasted coffee comes from Brazil.
Last Thursday, arabica coffee rallied to an 8.5-month nearest-futures high due to concern that excessive dry conditions in Brazil during the critical flowering period for coffee trees will threaten the 2026/27 coffee crop. According to the Bloomberg Brazil Weather Analysis, coffee-producing regions in Brazil have been experiencing an intense drought, with the state of Minas Gerais recording only about 70% of its average rainfall over the past month.
Coffee prices garnered support after the National Oceanic and Atmospheric Administration (NOAA) on September 16 increased the likelihood to 71% of a La Niña weather system in the southern hemisphere from October to December, which could bring excessive dry weather to Brazil and harm the 2026/27 coffee crop. Brazil is the world’s largest producer of arabica coffee.
Robusta coffee is under pressure from increased Vietnamese supplies. The Vietnam National Statistics Office reported on October 13 that Vietnam’s Jan-Sep 2025 coffee exports rose +10.9% y/y to 1.230 MMT. Also, Vietnam’s 2025/26 coffee production is projected to climb +6% y/y to 1.76 MMT, or 29.4 million bags, a 4-year high. In addition, the Vietnam Coffee and Cocoa Association (Vicofa) said last Friday that Vietnam’s coffee output in 2025/26 will be 10% higher than the previous crop year if weather conditions remain favorable. Vietnam is the world’s largest producer of robusta coffee.
Larger coffee exports are bearish for prices after the International Coffee Organization (ICO) reported on October 6 that global coffee exports for the current marketing year (Oct-Aug) rose +0.2% y/y to 127.92 million bags, indicating adequate exports and supplies.
Coffee prices found support after Conab, Brazil’s crop forecasting agency, cut its Brazil 2025 arabica coffee crop estimate on September 4 by -4.9% to 35.2 million bags from a May forecast of 37.0 million bags. Conab also reduced its total Brazil 2025 coffee production estimate by 0.9% to 55.2 million bags, from a May estimate of 55.7 million bags.
The USDA’s Foreign Agriculture Service (FAS) projected on June 25 that world coffee production in 2025/26 will increase by +2.5% y/y to a record 178.68 million bags, with a -1.7% decrease in arabica production to 97.022 million bags and a +7.9% increase in robusta production to 81.658 million bags. FAS forecasted that Brazil’s 2025/26 coffee production will increase by +0.5% y/y to 65 million bags and that Vietnam’s 2025/26 coffee output will rise by 6.9% y/y to a 4-year high of 31 million bags. FAS forecasts that 2025/26 ending stocks will climb by +4.9% to 22.819 million bags from 21.752 million bags in 2024/25.
On the date of publication,
did not have (either directly or indirectly) positions in any of the securities mentioned in this article. All information and data in this article is solely for informational purposes.
For more information please view the Barchart Disclosure Policy
here.
Binance Coin (BNBUSD) declined slightly in its latest intraday trading under continued negative pressure from trading below the 50-day SMA and within the dominance of a short-term corrective bearish trend, with trading along a descending line. Meanwhile, the relative strength indicators have reached extremely overbought levels compared to the price movement, accompanied by the early appearance of a bearish crossover, which further intensifies the negative pressure around the cryptocurrency.
Therefore, we expect the cryptocurrency to decline in its upcoming intraday trading as long as the resistance level of $1,181.90 holds, targeting the key support level of $1,020.50.
Today’s price forecast: Bearish.
Gold is consolidating weekly losses in Asian trades on Friday, having stalled Thursday’s turnaround just shy of the $4,050 mark.
Gold buyers seem to catch a breather following the previous upswing before the end-of-the-week and – month profit-taking wave creeps back in.
Markets resorted to taking profits off the table after the recent tremendous correction in Gold in anticipation of a potential US-China trade deal, while taking account of a less dovish US Federal Reserve (Fed) monetary policy decision.
The Fed on Wednesday delivered the expected 25 basis points (bps) interest rate cut, with Chair Jerome Powell noting that policymakers are likely to become more cautious if it deprives them of further job and inflation reports.
Markets are now pricing in a 72.8% probability of a 25 bps Fed rate cut in December compared with a 91.1% chance a week ago, the CME Group’s FedWatch tool shows.
The Gold rebound was also powered by the latest World Gold Council report that showed, “global gold demand rose 3% year-on-year to 1,313 metric tons, the highest quarterly number on record, in the third quarter as investment demand soared,” per Reuters.
What remains to be seen is if Gold could regain the recovery momentum as the US Dollar (USD) stands tall at two-month highs against its major currency rivals.
Additionally, the continued contraction in the Chinese manufacturing sector weighs negatively on Gold. China is the world’s top yellow metal consumer. The official Manufacturing purchasing managers’ index (PMI) fell to 49.0 in October from 49.8 in September, a six-month low.
That said, the downside in Gold will likely be cushioned by lingering US economic and fiscal concerns as the government shutdown shows no signs of reopening and markets are flying blind amid the data drought.
The daily chart shows that Gold price recaptured the $4,000 barrier on a closing basis on Thursday, reviving the bullish potential.
Adding credence to the upside bias, the 14-day Relative Strength Index (RSI) stays bullish after breaking above the 50 level.
The important resistance levels to watch now are the $4,050 psychological level and the 21-day Simple Moving Average (SMA) at $4,078, followed by $4,129 – the 23.6% Fibo level of the same ascent.
To the downside, the immediate support is seen at the 38.2% Fibo level at $3,973, below which a test of the 50% Fibo of $3,847 will be inevitable
Deeper declines will challenge the 50-day SMA at $3,822.
Gold has played a key role in human’s history as it has been widely used as a store of value and medium of exchange. Currently, apart from its shine and usage for jewelry, the precious metal is widely seen as a safe-haven asset, meaning that it is considered a good investment during turbulent times. Gold is also widely seen as a hedge against inflation and against depreciating currencies as it doesn’t rely on any specific issuer or government.
Central banks are the biggest Gold holders. In their aim to support their currencies in turbulent times, central banks tend to diversify their reserves and buy Gold to improve the perceived strength of the economy and the currency. High Gold reserves can be a source of trust for a country’s solvency. Central banks added 1,136 tonnes of Gold worth around $70 billion to their reserves in 2022, according to data from the World Gold Council. This is the highest yearly purchase since records began. Central banks from emerging economies such as China, India and Turkey are quickly increasing their Gold reserves.
Gold has an inverse correlation with the US Dollar and US Treasuries, which are both major reserve and safe-haven assets. When the Dollar depreciates, Gold tends to rise, enabling investors and central banks to diversify their assets in turbulent times. Gold is also inversely correlated with risk assets. A rally in the stock market tends to weaken Gold price, while sell-offs in riskier markets tend to favor the precious metal.
The price can move due to a wide range of factors. Geopolitical instability or fears of a deep recession can quickly make Gold price escalate due to its safe-haven status. As a yield-less asset, Gold tends to rise with lower interest rates, while higher cost of money usually weighs down on the yellow metal. Still, most moves depend on how the US Dollar (USD) behaves as the asset is priced in dollars (XAU/USD). A strong Dollar tends to keep the price of Gold controlled, whereas a weaker Dollar is likely to push Gold prices up.
The EURJPY pair formed strong bullish rally, taking advantage of the positive factors that are represented by its stability above the extra support at 177.05 besides the main indicators attempt to provide positive momentum, to notice recording the initial target by reaching 178.80.
No escape from renewing the bullish attempts, to attempt to breach 178.80 level and hold above to open the way for recording extra gains that might extend towards 179.35 reaching 180.00, forming temporary psychological barrier against the bullish trading.
The expected trading range for today is between 177.70 and 179.35
Trend forecast: Bullish