The main tag of GoldPrice Articles.
You can use the search box below to find what you need.
[wd_asp id=1]
The main tag of GoldPrice Articles.
You can use the search box below to find what you need.
[wd_asp id=1]
For several days, natural gas has been testing support around the 78.6% Fibonacci retracement of a prior upswing. This appears to be a pause in the downtrend, and the expectation remains that the bear trend will resume once the short-term consolidation phase is complete. If a bounce occurs first, the behavior of price near potential resistance zones should reveal more about shifting supply and demand dynamics.
Tuesday’s sharp decline marked a decisive break below a critical support area that had been tested repeatedly in recent weeks. This zone was defined by the confluence of a long-term uptrend line and an anchored volume-weighted average price (AVWAP) from the 2024 trend low. Also included was the April swing low at $2.86, which served as an extended boundary for the zone.
Once $2.86 was broken, a bearish continuation signal was triggered, confirming the continuation of an ABCD decline from the March trend high. The bearish signal was reinforced by a daily close below $2.86. It will establish longer-term bearish confirmation on the weekly chart if the week finishes below that price.
Downside projections begin with $2.63, the completion of a smaller descending ABCD pattern (purple). Below that, the next target is the 78.6% retracement of a larger upswing than the earlier Fibonacci measure. Given the recent long-term breakdown through major support, the technical bias favors lower levels before the current bearish correction runs its course.
If a rally develops and clears the two-day high of $2.85, natural gas could stage a countertrend move toward a resistance zone between $2.96 and $3.07. The lower end of this zone aligns with the AVWAP level, while the upper boundary is defined by the declining 20-Day moving average. As the 20-Day MA continues to fall, the top of the resistance range will gradually shift lower.
For a look at all of today’s economic events, check out our economic calendar.
International Paper Company (IP) stock rose slightly in its latest intraday trading, attempting to recover part of previous losses while also trying to relieve some of the oversold pressure apparent on the Relative Strength Index indicators, especially as positive signals begin to appear. However, the stock’s recent rise faced resistance from the 50-day SMA, with the medium-term trend still under bearish control.
Therefore, we expect the stock price to decline in its upcoming trading, as long as the 48.50$ resistance holds, targeting the key support level of 43.55$.
Today’s price forecast: Bearish
Spot Gold pressures a fresh weekly low around the $3,330 level in the American session on Thursday, amid resurgent US Dollar (USD) demand. Financial markets were shocked by recent United States (US) inflation-related figures, as, following the release of a benign July Consumer Price Index (CPI) earlier in the week, the Producer Price Index (PPI) in the same period was much hotter than anticipated.
Inflation at wholesale levels in the US surged at an annualised pace of 3.3% in July according to the PPI, while the core annual reading printed at 3.7%, much higher than the 2.6% posted in June or the expected 2.9%. The figures weighed down hopes for an interest rate cut in September, but a rate cut remains on the table. According to the FedWatch Tool, a rate cut of 25 basis points (bps) is 90.4% possible in September, compared to the 94.3% from before the PPI release.
Wall Street turned south with the news, with the three major indexes trading in the red at the time. At the same time, demand for the USD returns, resulting in a modest XAU/USD retracement despite the softer mood.
Friday will bring the US July Retail Sales and the preliminary estimate of the August Michigan Consumer Sentiment Index.
The daily chart for the XAU/USD pair shows that it has been trading within a limited intraday range, just below a flat 20 Simple Moving Average (SMA), providing dynamic resistance at around $3,357. The same chart shows the 100 SMA keeps grinding north, albeit losing its upward momentum at around $3,301.80. Finally, technical indicators remain within neutral levels, with the Relative Strength Index (RSI) indicator turning marginally lower, in line with the ongoing weakness.
In the near-term, and according to the 4-hour chart, the risk skews to the downside. The XAU/USD pair develops below all its moving averages, with the 20 SMA gaining downward traction between directionless 100 and 200 SMAs. At the same time, technical indicators turned flat, although within negative levels, reflecting the latest bounce but far from suggesting additional recoveries.
Support levels: 3,328.10 3,312.25 3,301.80
Resistance levels: 3,350.00 3,372.30 3,389.85
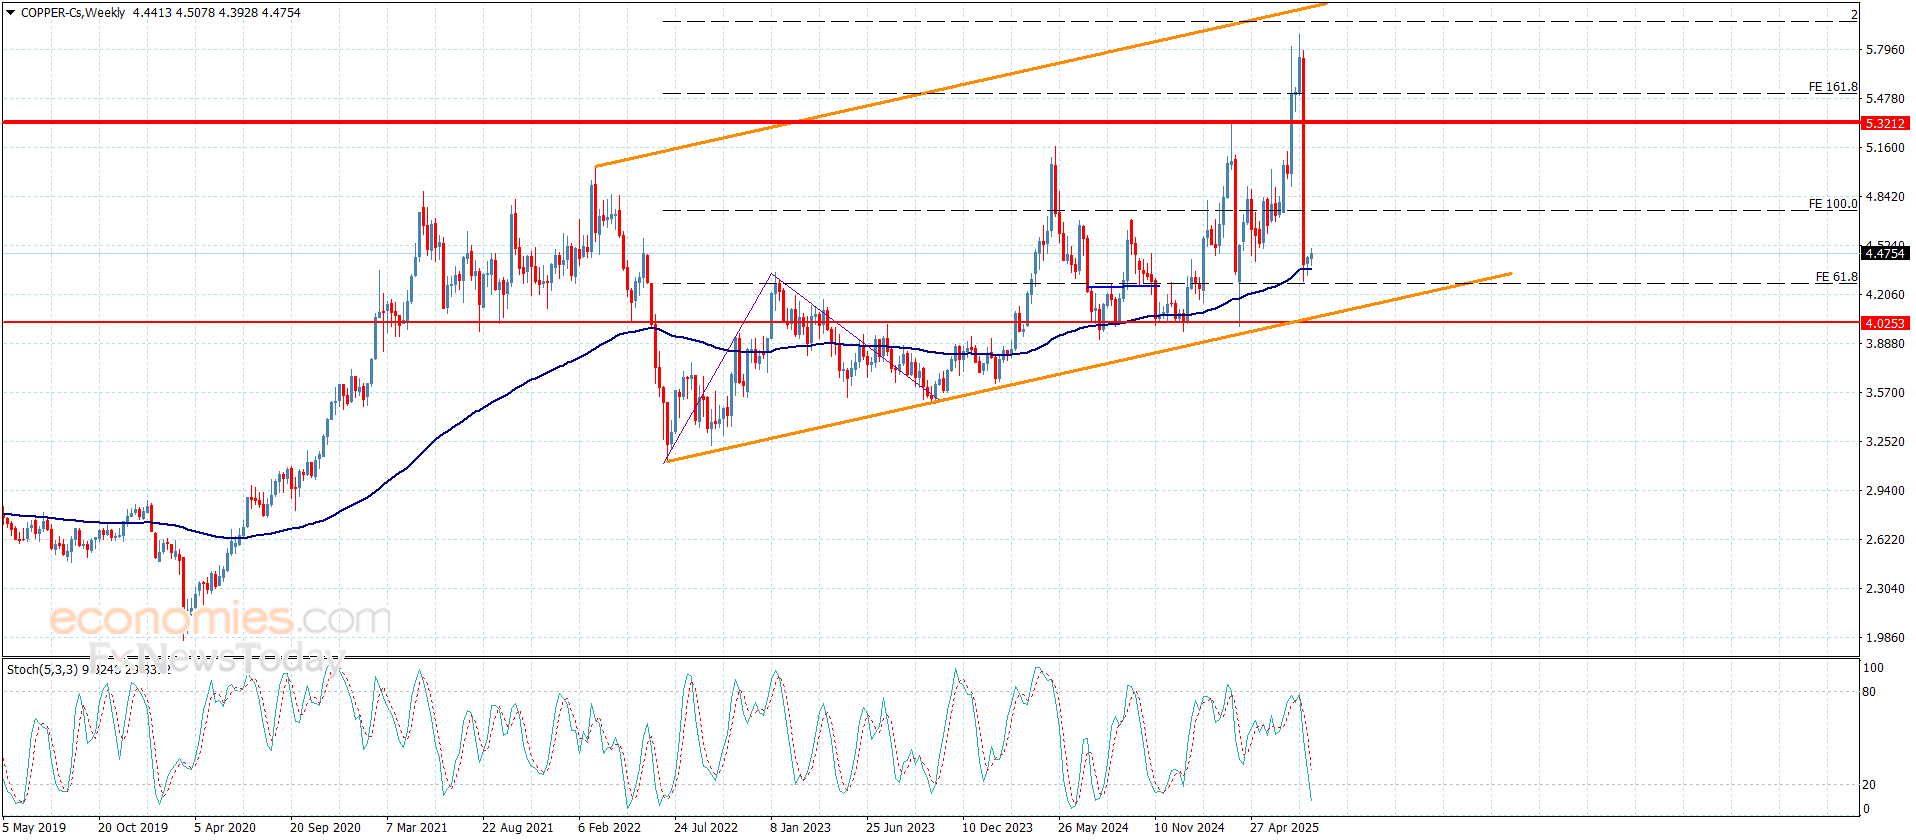
Copper price kept its positive stability above the moving average 55 to keep the continuation of the suggested positivity that depends on the stability of the bullish channel’s support at $4.0500, to notice the weakness of the bullish attempts due to the continuation of stochastic contradiction that is fluctuating now within the oversold level.
Gaining the required extra positive momentum, to motivate the bullish attack, to expect attacking the initial positive target at $4.7400, and surpassing it will make it record several gains in the upcoming period trading.
The expected trading range for today is between $4.3700 and $4.6300
Trend forecast: Bullish
Gold is looking to extend the break above the $3,350 psychological barrier in the Asian trades on Thursday. Gold keeps the green for the third consecutive day, awaiting the US Producer Price Index (PPI) and Jobless Claims data for fresh trading incentives.
Following tame July Consumer Price Index (CPI) and soft labor data from the United States (US), markets have doubled down on their expectations of interest rate cuts by the US Federal Reserve (Fed) this year.
A 25 basis points (bps) rate cut its now fully priced in next month, with some industry experts and even US officials calling for a 50 bps reduction.
On Wednesday, US President Donald Trump called for rates at 1% while Treasury Secretary Scott Bessent on Wednesday called for a “series of rate cuts,” and said the Fed could kick off the policy easing with a half-point cut.
Intensifying dovish sentiment surrounding the Fed keeps the US Dollar (USD) undermined near two-week troughs against its six major currency rivals, providing the much-needed zest to Gold buyers amid a mostly risk-on market environment.
The latest chatter that Trump is considering BlackRock’s Rick Rieder as one of the candidates as new Fed Chairman exacerbated the pain in the Greenback. Rieder argued that he sees scope for a 50 bps Fed cut in September after a downside surprise in the US consumer inflation data.
Additionally, rife concerns over the Fed’s independence and economic prospects remain a drag on the USD, painting a positive picture for the non-yielding/ USD-denominated Gold.
The annual US PPI and core PPI are seen rising by 2.5% and 2.9% in July, respectively while the monthly CPI inflation is expected to tick higher 0.2% in the same period. The core CPI is also seen advancing by 0.2% over the month in July.
An unexpected slowdown in the factory-gate prices could ramp up the odds of a big rate cut, fuelling a fresh rally in Gold while spelling doom for the buck.
The reaction to the US data could be limited as traders turn their attention to Friday’s meeting between Trump and Russian President Vladimir Putin in Alaska on the Ukraine peace deal.
The daily chart leans bullish for Gold as the Relative Strength Index (RSI) remains above the midline.
Buyers need to crack the static resistance near $3,380 to unleash additional upside toward the intermittent highs of $3,440. Ahead of that, the $3,400 round level will be put to the test.
On the downside, 50-day Simple Moving Average (SMA) at $3,350 offers immediate support, a break below which sellers will target the 100-day SMA at $3,302.
Deeper declines will challenge the July 31 low of $3,274.
The oil market could be even more oversupplied at the end of this year than previously expected amid tepid demand growth and surging supply from both OPEC+ and non-OPEC+ producers, the International Energy Agency (IEA) said on Wednesday.
Global oil demand is now expected to rise by just 680,000 barrels per day (bpd) this year, and by 700,000 bpd in 2026, to reach 104.4 million bpd next year, the IEA said in its monthly Oil Market Report out today.
The latest forecasts are a downward revision of 20,000 bpd in demand growth estimates from the July report—the fifth consecutive from the agency, which has slashed its projection for the 2025 oil demand growth by a combined 350,000 bpd since the beginning of the year.
The latest downgrade reflects “lacklustre demand across the major economies and, with consumer confidence still depressed, a sharp rebound appears remote,” the IEA said.
Consumption in emerging and developing economies has been weaker than expected, with China, Brazil, Egypt and India all revised down compared with last month’s report, the Paris-based agency noted.
The only bright spot in demand has been jet fuel demand, which is on track to increase by 2.1% this year, the strongest of any product, said the IEA. But the agency noted that the overall projected jet fuel consumption of 7.7 million bpd in 2025 would still be about 180,000 bpd lower compared to the 2019 pre-Covid level.
While the IEA downgraded its demand growth estimate, again, it hiked its global supply growth forecast by 370,000 bpd to 2.5 million bpd this year, after the eight OPEC+ members agreed earlier in August to boost output by 547,000 bpd in September, fully unwinding their 2.2 million bpd cuts agreed to in November 2023.
The IEA said that sanctions on Russia and Iran could curb supplies from these producers, but noted that “oil market balances look ever more bloated as forecast supply far eclipses demand towards year-end and in 2026.”
As usual, the IEA is much more bearish on oil demand growth than OPEC, which said in its own report on Tuesday that demand in 2026 is set to strengthen on the back of expected stronger economies in key oil-consuming regions.
By Michael Kern for Oilprice.com
More Top Reads From Oilprice.com
The triangle pattern has formed near the top of gold’s long-term uptrend, generally signaling potential for an eventual upside breakout. Yet its clarity also means surprises are possible. A breakout that fails could quickly reverse, leading to a sharp swing in the opposite direction. Traders should remain aware of this scenario, as it has precedent. Last month, a smaller symmetrical triangle broke briefly before reversing, and then a breakdown also failed to follow through.
This led to the expanded current wider consolidation range. Patterns observed near major highs can lead to increased market volatility when false breakouts happen, highlighting the importance of effective risk management.
The triangle boundaries are defined by trendlines connecting recent swing highs and lows. An upside breakout would require a move above $3,409, followed by a push through $3,439. On the downside, a break below the lower boundary, confirmed by a drop beneath the recent higher swing low at $3,268, would show control of the bears and could lead to a deeper retracement.
If $3,268 fails as support, the next area of interest is the 38.2% Fibonacci retracement from the earlier $3,500 record high, which would act as a potential minimum downside target. While this level may hold, traders should be aware that failed breakouts or sudden reversals can push momentum further, making it important to monitor price action closely and adjust strategies as conditions evolve.
For a look at all of today’s economic events, check out our economic calendar.
The EURJPY pair reacted with stochastic exit from the overbought level this morning, which forces it to delay the bullish attack to reach below 172.00, announcing its surrender to the bearish correctional scenario by its stability near 171.38.
The continuation of the negative pressure might force the price to suffer extra losses by reaching 170.90 followed by the extra support at 170.45, while the price return to settle above 172.00 will provide chances for renewing the bullish attempts and reaching 172.60.
The expected trading range for today is between 170.45 and 172.60
Trend forecast: Bearish temporarily
Copper price kept its positive stability above the moving average 55 to keep the continuation of the suggested positivity that depends on the stability of the bullish channel’s support at $4.0500, to notice the weakness of the bullish attempts due to the continuation of stochastic contradiction that is fluctuating now within the oversold level.
Gaining the required extra positive momentum, to motivate the bullish attack, to expect attacking the initial positive target at $4.7400, and surpassing it will make it record several gains in the upcoming period trading.
The expected trading range for today is between $4.3700 and $4.6300
Trend forecast: Bullish
Today’s oil market presents a complex landscape of price movements, global dynamics, and shifting supply-demand fundamentals. For investors, traders, and industry observers, understanding these movements requires examining multiple factors across the energy spectrum. This guide breaks down the current state of crude oil prices today and what’s driving market movements.
Oil prices continue to show resilience despite market expectations of weakness. The two major global benchmarks are showing modest gains, while other energy commodities display varying performance.
WTI crude is currently trading at $68.57 per barrel, showing a modest increase of 0.18% in the last trading session. Meanwhile, Brent crude stands at $70.53, with a similarly modest gain of 0.24%. These two major benchmarks serve as global reference points for oil pricing and continue to reflect positive momentum despite earlier predictions of price declines.
The relative stability of these benchmarks suggests underlying market strength that has surprised many analysts who expected more significant price drops following recent production announcements. Recent oil price rally insights suggest that several fundamental factors are supporting the market despite bearish expectations.
Beyond the major benchmarks, other energy commodities are showing interesting price action:
Murban’s notable outperformance relative to WTI and Brent suggests particular strength in the Middle Eastern crude market, potentially reflecting stronger Asian demand for this grade specifically.
Several key factors are influencing today’s oil price movements, from production decisions to inventory levels and geopolitical tensions.
Recent OPEC+ announcements have significantly influenced market sentiment. The cartel’s decision to increase production by over 500,000 barrels daily surprised many analysts who expected prices to fall substantially as a result. Instead, prices have remained resilient, with Brent climbing above $70 per barrel following the announcement.
UAE Energy Minister Suhail al Mazrouei explained this unexpected price resilience, stating: “You can see that even with the increase in several months, we haven’t seen a major buildup in the inventories, which means the market needed those barrels.” This assessment from a key OPEC official confirms that global demand has been absorbing the additional supply without creating gluts.
The market’s reaction to OPEC+ decisions suggests a tighter supply-demand balance than many expected, with the additional barrels being readily absorbed by consumers. This dynamic has contributed to the stagnant oil price factors observed in recent trading sessions.
Current inventory data reveals significant tightness in key markets:
This tight inventory situation creates a bullish underpinning for prices. According to the International Energy Agency’s June 2025 Oil Market Report, these inventory levels represent one of the tightest market conditions in recent years despite increased production.
The diesel situation is particularly concerning for transportation costs. James Noel-Beswick from Sparta Commodities noted in a Wall Street Journal interview: “Because of those run cuts [refinery operations], we started this year with not enough diesel in storage.” This shortage creates potential ripple effects throughout global supply chains.
Recent escalations in the Middle East and developments in Russia continue to create market uncertainty. While no oil infrastructure has been directly targeted in recent conflicts, each flare-up in tensions has triggered price spikes of $2-3 per barrel before settling back.
These reactions demonstrate the market’s ongoing sensitivity to potential supply disruptions, despite current adequate global production capacity. The geopolitical risk premium remains embedded in current prices, particularly for Brent crude which is more exposed to Middle Eastern supply disruption risks.
Oil prices vary significantly by region due to quality differences, transportation constraints, and local supply-demand dynamics.
U.S. domestic crude varieties show varied performance across different regions:
The significant discount for Western Canadian Select ($14.35 below WTI) highlights the persistent challenges facing Canadian producers. This discount primarily stems from transportation constraints between Canadian production regions and U.S. refineries, along with quality differentials – WCS is a heavier, more sour crude that requires more complex refining processes.
Middle Eastern and African crude grades command different price points based on their quality characteristics and proximity to key markets:
African light sweet grades like Bonny Light typically command premium prices due to their favorable quality characteristics – they’re low in sulfur content and yield high proportions of valuable products like gasoline and diesel with less intensive refining.
The spread between various crude grades provides important market signals:
| Differential | Current Value | Historical Average | Significance |
|---|---|---|---|
| Brent-WTI | $2.00 | $4.50 | Narrower than historical average, suggesting improving U.S. export capabilities |
| WTI-WCS | $14.35 | $15.25 | Slightly narrower than average, but still reflecting Canadian transport constraints |
| Brent-Dubai | $1.85 | $2.40 | Narrowing spread indicates stronger Asian demand relative to European |
The currently narrow Brent-WTI spread of approximately $2.00 is particularly noteworthy, as it’s significantly tighter than historical averages. This compression reflects the improved export capabilities for U.S. crude and changing global trade patterns, with American oil increasingly flowing to Asian markets.
The interplay between supply and demand continues to shape market dynamics, with seasonal factors currently supporting prices.
On the supply side, key developments include:
The Saudi export increase, confirmed by official trade data, signals the kingdom’s willingness to meet growing demand as global economies continue to expand. Meanwhile, UAE Energy Minister Suhail al Mazrouei has stated that the market is “thirsty for more OPEC+ barrels,” justifying the group’s decision to raise production levels despite concerns about potential oversupply later in the year.
Recent Alaska drilling policy shift decisions could further influence North American production trends, potentially adding new supply sources to the market in coming years.
The northern hemisphere is currently in its peak demand season, creating strong support for prices, particularly for transportation fuels. Key seasonal factors include:
This seasonal strength is expected to fade later in the year, potentially creating a more balanced or even oversupplied market as production increases coincide with reduced seasonal consumption in the fourth quarter.
A critical but often overlooked factor in oil markets is refining capacity. Low refining margins in late 2024 led many facilities to reduce operating rates, creating downstream bottlenecks that continue to affect product markets today.
According to OPEC projections, the world will need an additional 19.5 million barrels per day of refining capacity by 2050 to meet growing demand. This long-term structural challenge in the downstream sector means that crude oil abundance doesn’t always translate to product abundance – a key reason why diesel prices have remained elevated despite relatively moderate crude prices.
Oil price movements have wide-ranging implications beyond the energy sector, affecting corporate profits, transportation costs, and broader economic indicators.
Major oil companies are adjusting their profit expectations in response to price movements. BP has specifically indicated that lower oil prices will negatively impact its Q2 profits, as noted in a recent earnings guidance update. This demonstrates how price volatility directly affects corporate performance across the energy sector.
For upstream producers, current price levels around $70 for Brent remain profitable for most operations, but represent a significant reduction from the $100+ levels seen during 2023’s peak. Companies with higher-cost production or significant debt loads face greater pressure in this environment.
Diesel supply tightness threatens to raise transportation costs, with potential ripple effects throughout supply chains. The 23% deficit in U.S. diesel inventories compared to five-year averages is particularly concerning given diesel’s critical role in commercial transportation.
As Dennis Kissler from BOK Financial notes: “I think [inventories] will recover at higher prices.” This assessment suggests continued pressure on transportation costs that could eventually filter through to consumer goods pricing if the situation persists.
Oil price movements continue to influence inflation metrics, currency values, and trade balances globally. Countries heavily dependent on oil imports, such as India, are actively diversifying their supply sources to mitigate price risks.
India has notably increased purchases from the United States and Brazil, as confirmed by trade data showing these nations becoming key suppliers alongside traditional Middle Eastern sources. This diversification strategy helps India reduce exposure to regional supply disruptions and potentially negotiate better terms with a broader supplier base.
Market Insight: While oil prices have historically correlated strongly with inflation rates, this relationship has weakened somewhat in recent years as economies become more service-oriented and energy-efficient. Nevertheless, transportation fuel costs remain a significant component of consumer price indices.
Market analysts offer varying perspectives on future price movements, with consensus building around near-term support but potential weakness later in the year.
Most market analysts expect continued tightness through the summer driving season, supporting current price levels through Q3 2025. As BOK Financial’s Dennis Kissler notes: “I think they’re going to be a little bit behind the curve, and there’s some catching up to do,” suggesting that inventory recovery will likely occur “at higher prices.”
The combination of seasonal demand strength, tight inventories, and persistent geopolitical risk premiums provides support for prices in the $65-75 range for WTI and $70-80 for Brent through the summer months. However, investors should remain vigilant for oil price crash signals that could indicate a market turning point.
Looking toward the end of 2025, the outlook becomes more bearish. ING commodity analysts Warren Patterson and Ewa Manthey predict that OPEC+ supply increases “should move the global market into a large surplus in the fourth quarter, intensifying downward pressure on prices.”
This assessment aligns with typical seasonal patterns, where demand weakens post-summer while production continues at steady or increasing rates. The projected surplus could push prices lower as markets rebalance, potentially testing the $60 level for WTI if OPEC+ maintains higher production levels.
OPEC has revised its 2026 demand projection downward to 106.3 million barrels daily from the previous forecast of 108 million bpd, primarily due to slowing Chinese demand growth. This adjustment reflects changing expectations about the pace of global energy transition and economic growth patterns.
Bob McNally from Rapidan Energy Group provides context for these shifting projections: “Right now, if you look out the window, the market is pretty tight.” This highlights the contrast between current market conditions and longer-term forecasts that suggest more abundant supply relative to demand.
The downward revision in OPEC’s demand outlook stems primarily from reassessments of Chinese consumption growth, which is expected to peak earlier than previously forecast due to economic restructuring and accelerated electric vehicle adoption.
For investors and market participants, oil price volatility presents both challenges and opportunities across different time horizons.
Investors should closely track several critical indicators to gauge market direction:
These indicators provide early signals of changing market dynamics that can impact price movements. For example, a series of inventory builds combined with weakening refining margins typically precedes price declines, while increasing geopolitical tensions often precede price spikes.
Energy market participants can utilize several approaches to manage price risk:
The current market structure, with its mix of short-term tightness and potential longer-term oversupply, creates opportunities for strategic hedging across different time horizons. Producers might consider locking in forward prices for 2026 production while leaving near-term output unhedged to benefit from current strength.
Exposure to various energy subsectors can help balance portfolio risk:
The divergent performance of crude oil versus natural gas highlights the benefits of maintaining diversified energy investments. While both are hydrocarbons, they respond to different seasonal patterns and supply-demand drivers.
The market appears tighter than previously expected, with global inventories significantly below historical averages. OECD inventories remain 97 million barrels below last year’s levels, creating a foundation of support for prices.
Additionally, current seasonal demand strength is absorbing the additional supply, as confirmed by UAE Energy Minister Suhail al Mazrouei who noted that despite production increases, “we haven’t seen a major buildup in the inventories, which means the market needed those barrels.“
Finally, geopolitical risk premiums continue to support prices despite increased production, with each flare-up in Middle Eastern tensions triggering price spikes that have been only partially reversed.
The current diesel supply tightness stems from multiple factors:
As Sparta Commodities analyst James Noel-Beswick explained: “Because of those run cuts, we started this year with not enough diesel in storage.” This shortage could lead to higher prices before the situation normalizes, particularly if summer demand for diesel remains strong.
China’s demand growth is slowing, prompting OPEC to revise its long-term forecasts downward. The organization now projects global demand at 106.3 million barrels daily by 2026, down from the previous forecast of 108 million bpd, with Chinese consumption patterns being the primary driver of this revision.
However, China remains a crucial market for global exporters. Saudi Arabia’s oil exports to China are expected to reach a two-year high in August, demonstrating the country’s continued importance despite changing growth patterns. The ongoing oil price trade war trends highlight the complex relationship between Chinese demand and global supply dynamics.
Chinese refinery purchasing
Discover why significant ASX mineral discoveries can lead to exceptional returns by exploring Discovery Alert’s dedicated discoveries page, where our proprietary Discovery IQ model instantly identifies high-potential opportunities before the broader market. Begin your 30-day free trial today to gain this crucial market advantage.