The main tag of GoldPrice Articles.
You can use the search box below to find what you need.
[wd_asp id=1]
The main tag of GoldPrice Articles.
You can use the search box below to find what you need.
[wd_asp id=1]
It may be significant that Wednesday’s low aligned with a lower boundary of a small falling channel, a level that also held during Tuesday’s session. A decisive move above today’s high could prompt a test of prior support levels, which may now serve as resistance. One such area is the anchored volume-weighted average price (AVWAP) line drawn from the 2024 bottom, currently near $2.96. This level coincides with potential resistance around a long-term uptrend line that was recently broken, now at around $3.03.
Despite the midweek bounce, the broader technical picture remains bearish. Natural gas confirmed a continuation of its short- and intermediate-term downtrends on Tuesday with a breakdown below the prior swing low at $2.86. While a rebound could develop in the short run, it is expected to face firm resistance within the prevailing downtrend structure. The 20-Day moving average, now at $3.10, represents the most critical dynamic resistance level, and a sustained rally above it would be required to shift sentiment meaningfully.
Should the market turn lower again and break below Wednesday’s $2.76 low, a fresh bearish signal would be triggered. This could set the stage for a decline toward $2.63, completing an initial target for a falling ABCD pattern (purple). Additional potential support sits near the $2.54 level, defined by another 78.6% Fibonacci retracement from a larger prior upswing. Between these levels, a long-term downtrend line may offer interim support as well, but the dominant trend remains to the downside.
For a look at all of today’s economic events, check out our economic calendar.
Broad US Dollar (USD) weakness helped Gold price advance on Wednesday, with the XAU/USD pair peaking at $3,370.80 early in the American session. In the absence of fresh news, financial markets keep revolving around the latest United States (US) headlines and mounting speculation that the Federal Reserve (Fed) will cut the benchmark interest rate when it meets in September. Speculative interest maintains the upbeat mood, as seen in Wall Street’s behaviour, with the three major indexes extending their weekly advances.
Gold shed some ground amid its safe-haven status, but the slide was limited by the lack of interest in the USD. As the American session unfolds, the XAU/USD pair hovers around $3,360, little changed for a second consecutive day.
Meanwhile, investors keep an eye on US political developments. On the one hand, Russian President Vladimir Putin will meet his American counterpart, Donald Trump, in Alaska next Friday to discuss the end of the Russia-Ukraine war. Putin has claimed the Donbas region as a condition for further progress, something Ukrainian President Volodymyr Zelenskyy said won’t happen.
On the other hand, President Trump is busy planning the Fed Chair’s replacement. According to people familiar with the matter, the White House is considering eleven candidates, including Jefferies Chief Market Strategist David Zervos, former Fed Governor Larry Lindsey and Rick Rieder, chief investment officer for global fixed income at BlackRock. The list also includes actual Fed members, such as Michelle Bowman, Chris Waller and Philip Jefferson.
The macroeconomic calendar had little to offer on Wednesday, but it will become a bit more interesting in the next 24 hours. Australia will release its monthly employment report, while the United Kingdom (UK) will publish Gross Domestic Product (GDP) updates. Later in the day, the Eurozone will publish a Q2 GDP estimate, while the US will release the July Producer Price Index (PPI).
The daily chart for the XAU/USD pair shows that the pair remains stuck around a flat 20 Simple Moving Average (SMA), unable to run past the level. At the same time, the 100 and 200 SMAs maintain their upward slopes within positive levels, limiting the downside potential of Gold. Finally, technical indicators aim modestly higher at around their midlines, not enough to confirm another leg north.
In the near term, and according to the 4-hour chart, XAU/USD was unable to maintain gains beyond a bearish 20 SMA, suggesting buyers remain sidelined. At the same time, the pair is stuck around a flat 100 SMA, while the 200 SMA is also directionless, well below the shorter ones. As it happens in the wider time frame, technical indicators fall short of giving directional clues, as they hold around their midlines without clear directional strength.
Support levels: 3,349.00 3,331.10 3,312.25
Resistance levels: 3,372.30 3,389.85 3,402.70
(Reuters) -Goldman Sachs raised its oil price forecasts for the second half of 2025 on Monday, citing the risk of supply disruption, lower oil inventories in Organisation for Economic Co-operation and Development countries and Russia’s production constraints.
The bank expects Brent crude to average $66 a barrel in the second half of 2025, up $5 from its previous forecast, and WTI at $63, up $6. Its 2026 forecasts remain unchanged at $56 for Brent and $52 for WTI.
“Our unchanged 2026 price forecast reflects an offset between a boost from higher long-dated prices and a hit from a wider 1.7 million barrels per day 2026 surplus,” the bank said. Previously, it expected a surplus of 1.5 mbpd.
Goldman Sachs now expects OPEC+, the Organization of the Petroleum Exporting Countries and allies, to unwind 2.2 mbpd of cuts by September, including a final 0.55 mbpd increase.
Goldman flagged a range of possible outcomes. A drop in Iranian supply could push Brent up to $90, while increased stockpiling by countries such as China could keep prices closer to $60 in 2026. A full unwinding of the 1.65 mbpd of OPEC+ cuts from April 2023, which would be additive to the ongoing 2.2 mbpd OPEC+ cut unwind, could drag prices below the bank’s baseline, potentially falling to $40 in a recession scenario by 2026.
“Reduced spare capacity increases our confidence that prices will rebound after 2026,” Goldman said.
It based its bullish long-term view on factors including falling investment, a lack of new non-OPEC projects beyond 2026, and growing demand over the next decade.
Goldman reiterated its cautious stance for 2026 and continues to recommend hedging against downside risk.
“We still recommend buying oil puts (or put spreads) and selling calls,” it said, suggesting investors sell a June 2026 $75 Brent call to fund buying a $55/45 put spread.
(Reporting by Noel John and Sherin Elizabeth Varghese in Bengaluru; Editing by Mark Porter and Barbara Lewis)
The US Energy Information Administration (EIA) has revised its 2025 Brent crude oil price forecast upward, citing increased geopolitical risk as a key driver.
Average Brent crude oil price for this year is projected at $68.89 per barrel, up by over $2.90 from the previous month’s estimate of $65.97, according to the EIA’s Short- Term Energy Outlook (STEO) released late Tuesday.
The EIA attributes the revision to a notable rise in geopolitical risk premiums following Israel’s June 13 attacks on multiple nuclear and military sites, as well as civilian areas, in several Iranian cities. The attacks occurred amid ongoing nuclear negotiations between Iran and the US.
Despite the elevated risk premium, the report notes that a significant build in global petroleum inventories is expected to cap further price increases. After averaging $75.83 per barrel in the first quarter of 2025, Brent prices are forecast to decline to $64.02 by the fourth quarter and average $58.48 in 2026.
The EIA also noted that its latest projections were finalized before OPEC+ announced its August production targets on July 5. It is also highlighted that the newly announced targets exceed the levels previously assumed in the preparation of the outlook.
In addition, falling oil prices have led US producers to slow drilling and well completion activity throughout the year.
As a result, US crude oil output is projected to decline slightly—from 13.28 million barrels per day (bpd) in the second quarter of 2025 to 13.26 million bpd by the end of 2026.
Thus, Brent crude is expected to average $68.89 per barrel this year, while the average price of West Texas Intermediate (WTI) crude is projected at $65.22 per barrel, compared to $62.33 in last month’s estimate.
The EIA reported that last year, Brent crude averaged $80.56 per barrel, while West Texas Intermediate (WTI) crude traded at an average of $76.60 per barrel.
– US crude production forecast revised up
The EIA projects that average daily crude oil production in the US will reach approximately 13.37 million bpd in 2025, higher than the previous year’s forecast of 13.21 million barrels.
On an annual basis, production is expected to average 13.4 million bpd in 2026.
On the other hand, global oil supply is expected to average 104.61 million bpd this year, while global oil consumption is expected to reach 103.54 million bpd.
In 2026, global supply is expected to average 105.72 million bpd, while consumption is expected to reach 104.59 million bpd.
By Humeyra Ayaz
Anadolu Agency
energy@aa.com.tr
A lower swing high was established last week at $3,409, a minor bearish development that raises the probability of further weakness toward the triangle’s lower support zone. This lower swing high reinforces the view that sellers are gaining traction, though not yet strong enough to force a breakdown. Until gold breaks out of the formation, trading is expected to remain choppy, with limited follow-through in either direction as market participants await a decisive move.
An upside breakout would be signaled by a rally through the top boundary of the pattern, confirmed on a move above $3,439, while a close beneath the lower boundary would trigger a bearish breakdown signal, confirmed below the recent swing low of $3,268.
Despite short-term weakness, the broader technical structure continues to favor an eventual upside breakout of consolidation. This view is supported by the location of the symmetrical triangle near the highs of a long-term uptrend and generally bullish readings across multiple time frames. Moreover, the pattern has developed after a strong rally earlier this year, which often serves as a continuation formation. Still, a weekly bearish signal was triggered this week when gold fell below last week’s low of $3,345, keeping downside risks alive.
From a longer-term perspective, gold recently reversed higher after testing the 20-Week MA two weeks ago, forming a higher swing low on the daily chart. The 20-Week MA, now at $3,310, lies close to the lower boundary of the triangle, reinforcing it as a strong potential support area. A sustained hold above this zone would likely encourage renewed buying, while a decisive drop lower could shift the focus toward the recent swing low at $3,268. A move below that level would confirm a bearish breakdown and open the way for deeper retracements, possibly toward $3,210 – $3,200.
For a look at all of today’s economic events, check out our economic calendar.
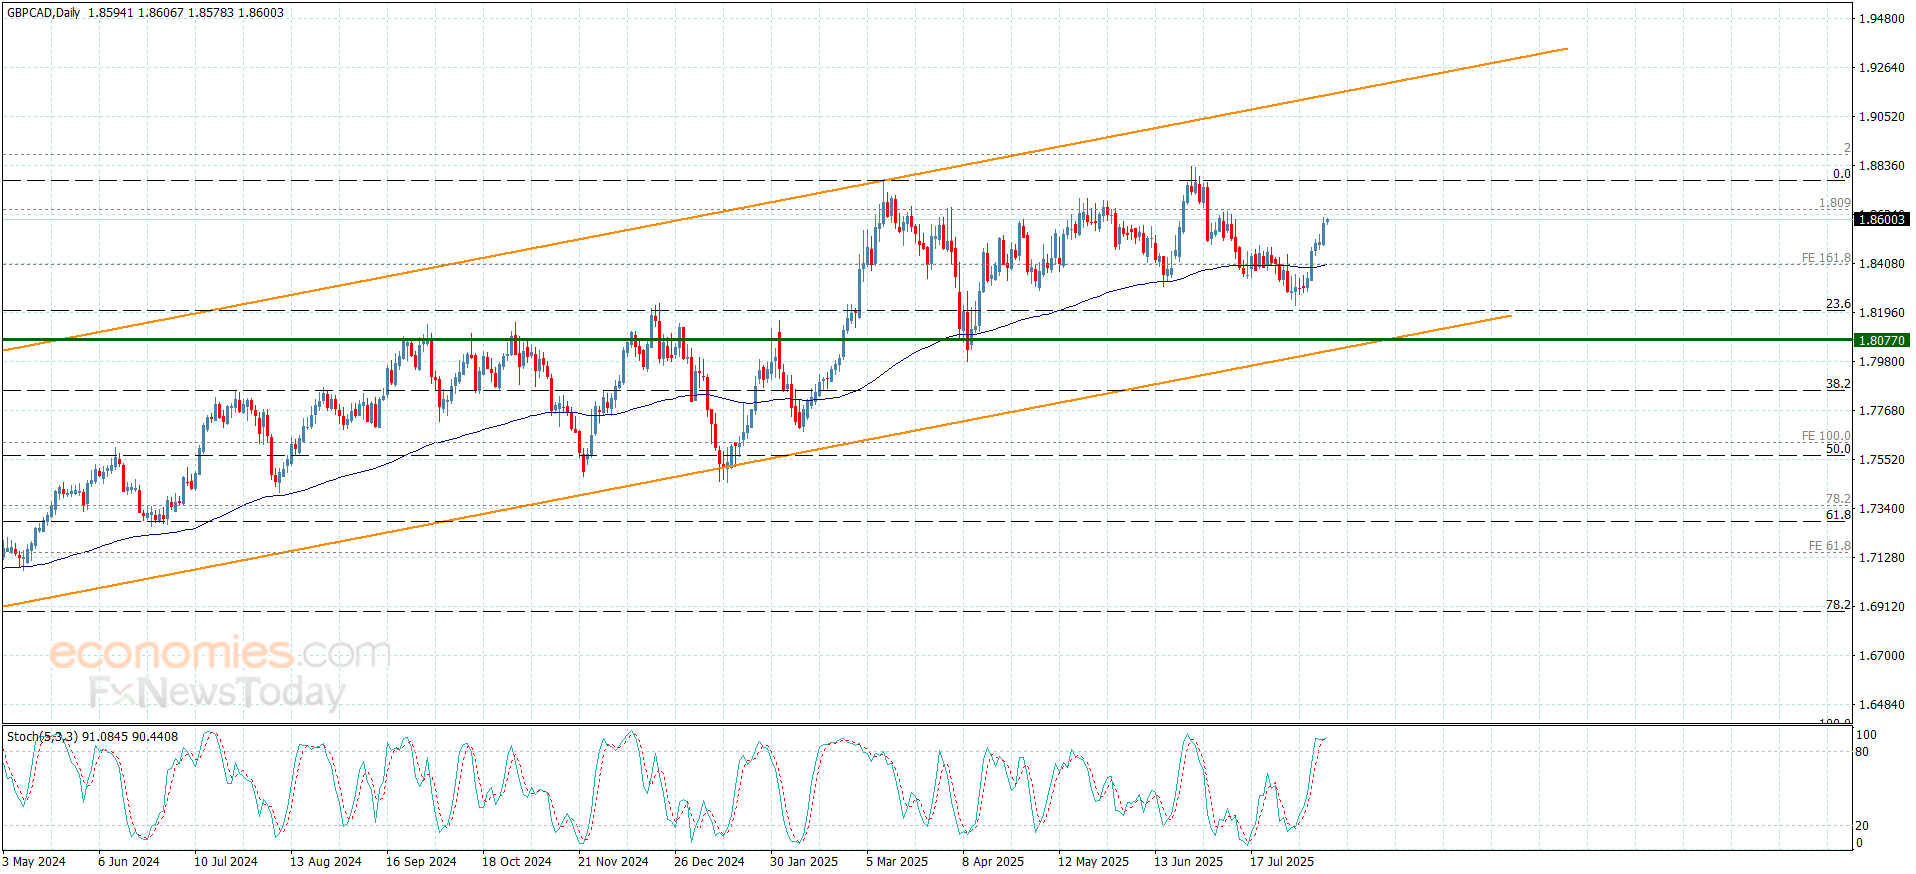
The GBPJPY pair succeeded in settling above 66%Fibonacci correction level at 198.85, reinforcing the continuation of the positivity, to face 200.10 resistance, achieving the extra waited target in the previous report.
Note that monitoring the price behavior as there is a chance for forming mixed trading until breaching the current resistance, to settle within the bullish channel’s levels again, increasing the chances for achieving extra gains that might begin at 200.85 reaching 78.2%Fibonacci correction level at 202.00.
The expected trading range for today is between 199.25 and 200.40
Trend forecast: Sideways
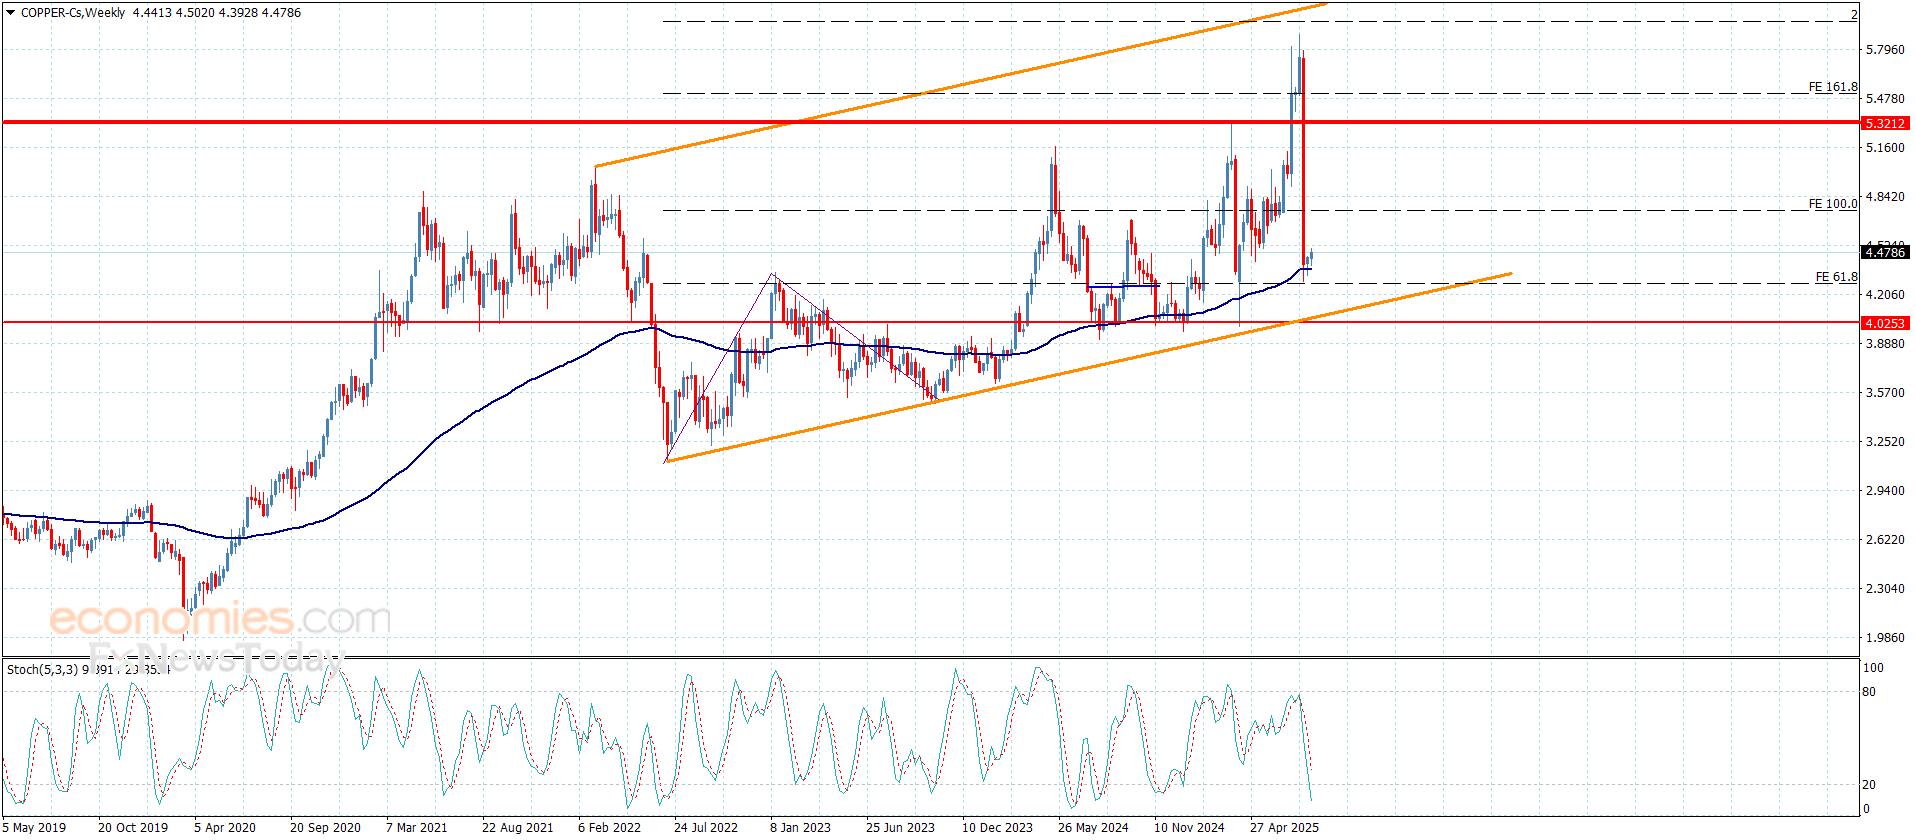
Copper price began forming slow bullish waves after stochastic reach to oversold level, to announce surpassing the negative pressure, to keep its main stability within the bullish track, which depends on the stability of the support level at $4.0500.
The price success in gaining positive momentum will ease the mission of recording positive stations, to keep waiting for reaching $4.6300, then press on the barrier at $4.7400, to monitor its behavior due to the importance of this level to detect the expected trend in the upcoming trading.
The expected trading range for today is between $4.330 and $4.6300
Trend forecast: Bullish
Copper price began forming slow bullish waves after stochastic reach to oversold level, to announce surpassing the negative pressure, to keep its main stability within the bullish track, which depends on the stability of the support level at $4.0500.
The price success in gaining positive momentum will ease the mission of recording positive stations, to keep waiting for reaching $4.6300, then press on the barrier at $4.7400, to monitor its behavior due to the importance of this level to detect the expected trend in the upcoming trading.
The expected trading range for today is between $4.330 and $4.6300
Trend forecast: Bullish
Notice that the top of the flag shows resistance around the 200-Day MA (blue) and the 20-Day MA (purple). Plus, the 20-Day line has turned down recently and that follows an advance since May 28. It is also interesting to notice that a minimum 38.2% Fibonacci retracement was completed around the recent lower swing high at $69.98. Together, these signs of resistance are consistent with the formation of a bearish flag and simultaneous bull channel breakdown.
Given the sharp descent that generated the pole portion of the bear flag, the bears will be fighting the bulls, as a large potential support zone is not much lower. When including the 50-Day MA, that zone would start around $65.74 to $64.50. The range begins with the 50-Day MA, is followed by the combination of an AVWAP level and the neckline of a double bottom pattern around $65.33 and finishes with the 61.8% Fibonacci retracement. Subsequently, a decisive decline below the 61.8% level will confirm a continuation of the bear flag breakdown.
Despite the bear trigger there needs to be follow-though to confirm. Notice that today’s range is very narrow and not what is generally anticipated on a solid breakdown. Traders should stay cautious as a rally above today’s high of $67.41 could lead to another test of resistance around 20-Day MA, now at $68.47, or another resistance level. Of course, that would keep crude oil within the flag consolidation pattern. On the upside, a decisive decline below today’s low of $66.50 triggers a continuation of the bear flag breakdown and opens the door to lower prices.
For a look at all of today’s economic events, check out our economic calendar.
Gold trades with a softer tone on Tuesday, falling to a fresh one-week low of $3,331.12 in the American session. The US Dollar (USD) gathered momentum following the release of United States (US) data, finding additional legs in political headlines.
The US published the July Consumer Price Index (CPI), which rose at an annualized pace of 2.7% in July, lower than the 2.8% market forecast. The core annual reading, however, increased by 3.1%, higher than the previous 2.9% and the 3% anticipated. On a monthly basis, the CPI rose by 0.2%, while the core monthly reading resulted at 0.3%, matching expectations.
The figures support the case for a September rate cut, leading to broad USD weakness. Stocks rallied, reflecting the better mood amid potential lower costs, and weighing on the bright metal.
The USD kept falling despite some political noise. US President Donald Trump extended the 90-day pause on massive tariffs on China, while Beijing answered reciprocally. Later in the day, Trump said he is considering allowing a lawsuit against Federal Reserve (Fed) Chair Jerome Powell amid the “ horrible, and grossly incompetent, job he has done in managing the construction of the Fed Buildings.”
Kansas City Federal Reserve (Fed) President Jeffrey Schmid said that the muted impact of tariffs on inflation should be seen as evidence that monetary policy is appropriate, and not a reason to cut interest rates.
Other than that, Trump’s candidate to replace Adriana Kugler, Stephen Miran, said he believes tariffs will be borne by the countries that they are tariffing, while the next head of the Bureau of Labor Statistics, EJ Antoni, suggested not publishing the Nonfarm Payrolls report anymore. The noise is doing no good to the Greenback.
The macroeconomic calendar cools down on Wednesday, as the only relevant figure will be the final estimate of German Harmonized Index of Consumer Prices (HICP).
The XAU/USD pair is little changed from Monday’s close, hovering around the $3,350 level. The daily chart shows the pair is unable to advance beyond a flat 20 Simple Moving Average (SMA), although well above bullish 100 and 200 SMAs. At the same time, technical indicators suggest buyers remain sidelined: the Momentum indicator ticked modestly higher but remains below its 100 line, while the Relative Strength Index (RSI) indicator heads nowhere at around 50.
In the near term, and according to the 4-hour chart, the risk skews to the downside- Technical indicators keep grinding lower below their midlines, in line with lower lows ahead. At the same time, a flat 100 SMA at around $3,359 provides intraday resistance, while the 20 SMA gains bearish traction above the longer one.
Support levels: 3.331.10 3,312.25 3,290.00
Resistance levels: 3,359.00 3,372.30 3,389.85