The main tag of GoldPrice Articles.
You can use the search box below to find what you need.
[wd_asp id=1]
The main tag of GoldPrice Articles.
You can use the search box below to find what you need.
[wd_asp id=1]
Gold is modestly in the red for the first time in six trading days early Thursday, holding its retreat from record highs of $3,895 reached mid-Wednesday.
Concerns over the United States (US) government shutdown-induced delay in critical employment and inflation data weighed on investors as they flocked to safety in the traditional safe haven Gold.
The delay in the US statistics could probably raise doubts on the scope and timing of further US Federal Reserve (Fed) interest rate cuts beyond the October 28-29 meeting, This narrative dented the sentiment around the US Dollar (USD), further helping Gold stretch its record raly.
However, the USD changed course in the mid-American session and staged a decent comeback following the news that the Supreme Court allowed Fed Governor Lisa Cook to remain in her post pending oral arguments in January on whether President Donald Trump has legal cause to fire her., per CNBC News.
Gold paused its record run and pulled back sharply from fresh lifetime highs on the USD turnaround to settle Wednesday near $3,865.
In Thursday’s trading so far, Gold is consolidating the previous retracement moves, supported above the $3,850 barrier.
The bright metal is drawing support from lingering geopolitical tensions surrounding Russia and Ukraine.
The Group of Seven (G7) nations vowed to tighten sanctions enforcement against Russia, pledging to phase out remaining imports and warning of penalties for countries and firms helping to finance Moscow’s war effort.
Following this announcement late Wednesday, the Wall Street Journal (WSJ) reported, quoting US President Trump that he will provide Ukraine with intelligence to support long-range missile strikes on Russian energy infrastructure.
Additionally, impending worries over the effects of the US shutdown and increased October Fed rate cut expectations will likely keep any pullback in Gold price short-lived as markets take account of weakening US labor market conditions.
The Automatic Data Processing (ADP) showed on Wednesday, private companies shed a seasonally adjusted 32,000 jobs during the month, the biggest slide since March 2023. Markets expected an increase of 50,000 in the reported month.
The US ADP data outweighed the uptick in the ISM Manufacturing PMI to 49.1 in September.
Looking ahead, traders will continue to pay close attention to whether the lawmakers will reach an interim deal to pause the shutdown, enabling the release of the US weekly Jobless Claims and August Factory Orders, originally scheduled later in the day.
As observed on the four-hour chart, the 14-day Relative Strength Index (RSI) remains within the bullish territory, currently near 64.
Therefore, the leading indicator suggests that the Gold uptrend remains well in place in the near term, and that any dip could be quickly bought in.
Buyers must find acceptance above the $3,900 level on a daily closing basis to resume the bullish momentum.
The next topside hurdle is located at the $3,950 barrier on the way to the $4,000 mark.
Conversely, any retracement pullback could test the initial support at $3,839, the 21-Simple Moving Average (SMA), below which the 50-SMA at $3,787 would be tested.
Deeper correction could target the September 24 low near $3,720, where the 100-SMA coincides.
Gold has played a key role in human’s history as it has been widely used as a store of value and medium of exchange. Currently, apart from its shine and usage for jewelry, the precious metal is widely seen as a safe-haven asset, meaning that it is considered a good investment during turbulent times. Gold is also widely seen as a hedge against inflation and against depreciating currencies as it doesn’t rely on any specific issuer or government.
Central banks are the biggest Gold holders. In their aim to support their currencies in turbulent times, central banks tend to diversify their reserves and buy Gold to improve the perceived strength of the economy and the currency. High Gold reserves can be a source of trust for a country’s solvency. Central banks added 1,136 tonnes of Gold worth around $70 billion to their reserves in 2022, according to data from the World Gold Council. This is the highest yearly purchase since records began. Central banks from emerging economies such as China, India and Turkey are quickly increasing their Gold reserves.
Gold has an inverse correlation with the US Dollar and US Treasuries, which are both major reserve and safe-haven assets. When the Dollar depreciates, Gold tends to rise, enabling investors and central banks to diversify their assets in turbulent times. Gold is also inversely correlated with risk assets. A rally in the stock market tends to weaken Gold price, while sell-offs in riskier markets tend to favor the precious metal.
The price can move due to a wide range of factors. Geopolitical instability or fears of a deep recession can quickly make Gold price escalate due to its safe-haven status. As a yield-less asset, Gold tends to rise with lower interest rates, while higher cost of money usually weighs down on the yellow metal. Still, most moves depend on how the US Dollar (USD) behaves as the asset is priced in dollars (XAU/USD). A strong Dollar tends to keep the price of Gold controlled, whereas a weaker Dollar is likely to push Gold prices up.
At 16:14 GMT, Natural Gas Futures are trading $3.447, down $0.023 or -0.66%.
Mild early-fall temperatures are weighing on national demand. According to NatGasWeather, the northern two-thirds of the U.S. are experiencing unseasonably warm conditions, with highs in the upper 60s to 80s. The South remains warmer, reaching into the 90s in some areas. While this setup limits Heating Degree Days, Cooling Degree Days are running slightly above average. Still, overall U.S. demand remains light for the first week of October.
However, demand is not quite as weak as models had indicated late last week, partially supporting the price recovery. Traders are pricing in a more balanced outlook, with short-covering likely contributing to the rally after several weeks of choppy trade.
A new risk emerged Wednesday as a partial U.S. government shutdown began, following a standoff between former President Trump’s allies and Senate Democrats. While the Energy Information Administration (EIA) is expected to release its weekly natural gas storage report on schedule, traders remain on alert for possible delays in upcoming data that could cloud market signals and create volatility.
In the meantime, traders are awaiting fresh EIA inventory data, after last week’s report showed a build of +75 Bcf — just above expectations but still slightly below the 5-year average. Inventories remain well supplied, sitting +6.1% above seasonal norms.
Weather models are starting to shift, with forecasts from Atmospheric G2 suggesting cooler trends in the West between October 6–10, and a broader cool risk developing nationwide for October 10–14. This potential boost to heating demand may offer further upside if confirmed.
Silver (XAG/USD) has snapped a three-day rally on Tuesday, as the pair failed to consolidate at levels beyond $47.00, and retreated to session lows below $45.80, before returning to levels right above the $46.00 line
Precious metals are correcting lower from long-term highs on Tuesday. Investors remain wary about a potential shutdown of the federal government, but the US Dollar sell-off seen in previous days has stalled.
Everything that goes up must come down, and Silver is not different. The technical picture shows a healthy bearish correction in progress, with the 4-Hour Relative Strength Index coming down from strongly overbought levels.
A reverse trendline resistance is acting as support in the area of the September 29 lows, between $45.90 and $46.10, holding bears for now. Further down, the previous long-term highs, at $45.30 (September 25 high) and $44.45 (September 23 high) would come into focus.
To the upside, immediate resistance lies at Tuesday’s high. to $47.15.Beyond here, e, Fibonacci tool shows the 161.8% extension of the September 17-23 bullish run, at $49.15.
Silver is a precious metal highly traded among investors. It has been historically used as a store of value and a medium of exchange. Although less popular than Gold, traders may turn to Silver to diversify their investment portfolio, for its intrinsic value or as a potential hedge during high-inflation periods. Investors can buy physical Silver, in coins or in bars, or trade it through vehicles such as Exchange Traded Funds, which track its price on international markets.
Silver prices can move due to a wide range of factors. Geopolitical instability or fears of a deep recession can make Silver price escalate due to its safe-haven status, although to a lesser extent than Gold’s. As a yieldless asset, Silver tends to rise with lower interest rates. Its moves also depend on how the US Dollar (USD) behaves as the asset is priced in dollars (XAG/USD). A strong Dollar tends to keep the price of Silver at bay, whereas a weaker Dollar is likely to propel prices up. Other factors such as investment demand, mining supply – Silver is much more abundant than Gold – and recycling rates can also affect prices.
Silver is widely used in industry, particularly in sectors such as electronics or solar energy, as it has one of the highest electric conductivity of all metals – more than Copper and Gold. A surge in demand can increase prices, while a decline tends to lower them. Dynamics in the US, Chinese and Indian economies can also contribute to price swings: for the US and particularly China, their big industrial sectors use Silver in various processes; in India, consumers’ demand for the precious metal for jewellery also plays a key role in setting prices.
Silver prices tend to follow Gold’s moves. When Gold prices rise, Silver typically follows suit, as their status as safe-haven assets is similar. The Gold/Silver ratio, which shows the number of ounces of Silver needed to equal the value of one ounce of Gold, may help to determine the relative valuation between both metals. Some investors may consider a high ratio as an indicator that Silver is undervalued, or Gold is overvalued. On the contrary, a low ratio might suggest that Gold is undervalued relative to Silver.
Spot Gold peaked at $3,895.29 on Wednesday, a fresh all-time high. The bright metal rallied on news that the United States (US) government effectively shut down on Wednesday, as Congress was unable to agree on a funding bill. The US Dollar (USD) fell against all major rivals, with safe-haven assets benefiting the most.
Republicans and Democrats have different views on how to re-fund the federal government, and the irreconcilable differences persist. Mid-Wednesday, the Senate voted once again not to advance the Democratic-backed resolution to fund the government for a few weeks.
Meanwhile, US data was mixed. On the one hand, ADP released the Employment Change report, which showed the private sector lost 32,000 job positions in September, much worse than the 50,000 gain anticipated by market participants. The report also reported a 3,000 position loss in August, downwardly revised from a previously reported 54,000 increase.
On the other hand, the ISM Manufacturing Purchasing Managers’ Index (PMI) came in slightly better than anticipated, printing at 49.1 in September vs expectations of 49 and the previous 48.7.
The dismal mood eased after Wall Street’s opening, as stocks shrugged off concerns. The three major indexes trade in the green, weighing on the bright metal. The XAU/USD pair also retreated on modest USD demand.
Most of the US data scheduled for the rest of the risk will hardly see the light if the shutdown persists. In such a scenario, then, Gold is likely to remain attractive and challenge the $4,000 mark.
XAU/USD trades around $3,870, and technical readings in the daily chart show that it keeps posting higher highs, in line with the dominant bullish trend. The Relative Strength Index (RSI) remains at extreme readings, ticking marginally higher at around 81 but mostly flat. The Momentum indicator, in the meantime, resumed its advance above its 100 line, with plenty of room to advance. Finally, the pair keeps rallying above all bullish moving averages, with the nearest being the 20 Simple Moving Average (SMA), currently at $3,699.
The 4-hour chart shows XAU/USD has corrected overbought readings, while the risk remains skewed to the upside. The RSI indicator turned flat after easing sub-70, while the Momentum indicator still aims south, although well above its 100 line while losing downward steam. Finally, moving averages maintain their upward slopes well below the current level, with the 20 SMA providing support at around $3,828.
Support levels: 3,853.25 3,828.00 3,807.05
Resistance levels: 3,895.00 3,910.00 3,930.00
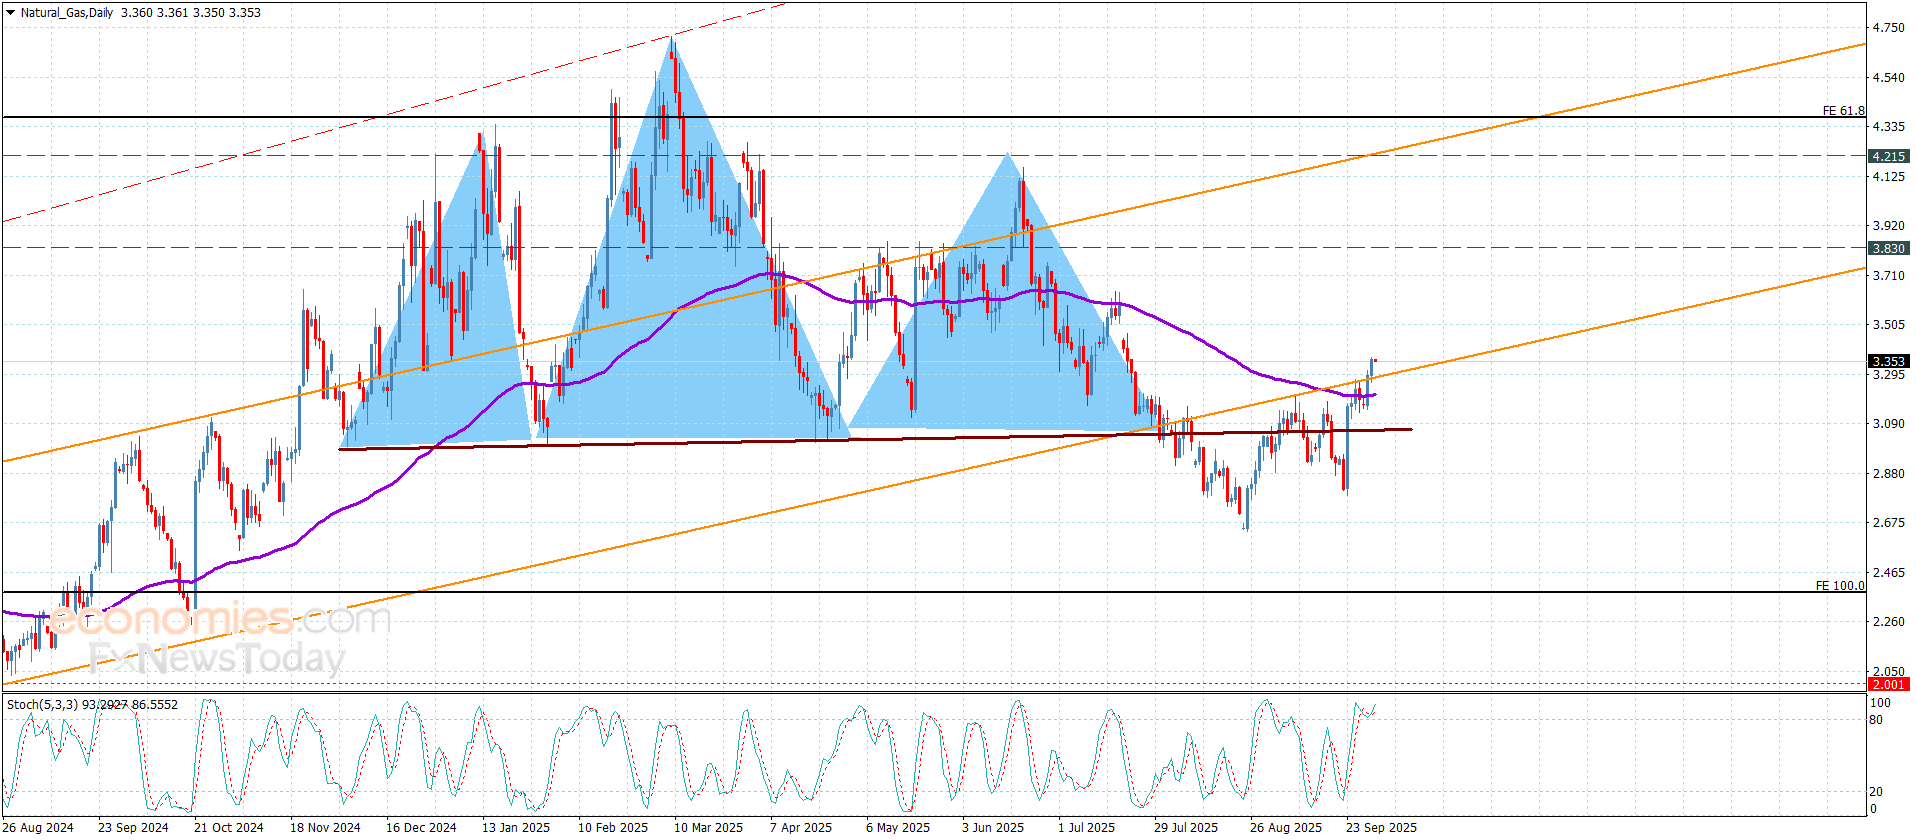
Natural gas price activated with the main indicators’ positivity, breaching the resistance at $3.290 level, to settle within the main bullish channel’s levels, achieving some gains by reaching 3.365.
Forming main support at $3.280 level, besides the continuation of providing positive momentum by the main indicators, we expect forming a new bullish rally to surpass $3.410 level, to target the next station at 3.350.
The expected trading range for today is between $3.300 and $3.530
Trend forecast: Bullish
The (ETHUSD) price settled with gains in its last intraday trading, amid the dominance of the bullish correctional trend on the short-term basis and its trading alongside supportive trend line for this track, with the continuation of the positive pressure due to its trading above EMA50, representing dynamic support that helps the price rise, with the positive divergence on the relative strength indicators, after reaching oversold levels, exaggeratedly compared to the price move, with the emergence of the positive signals from them.
Get high-accuracy trading signals delivered directly to your Telegram. Subscribe to specialized packages tailored for the world’s top markets:
Full VIP signals performance report for September 22–26, 2025:
Gold keeps its record-setting rally intact early Wednesday, consolidating near lifetime highs above $3,870 as the United States (US) heads for an imminent government shutdown.
Kicking off the final quarter of 2025 on a bullish note, Gold buyers refuse to give up and flex their muscles as the US government funding expires at 04:00 GMT on Wednesday, with the Republicans and Democrats unlikely to strike a last-minute interim deal.
The last government shutdown stretched from December 22, 2018, to January 25, 2019, lasting 35 days – during US President Donald Trump’s first term.
The immediate effect of a government shutdown will likely be the delay in the monthly labor market report, scheduled for this Friday, which is critical for the markets to gauge whether the US Federal Reserve will remain on track for two additional interest rate cuts this year.
Markets are fully pricing in a 25 basis points (bps) Fed rate cut later this month, the CME Group’s FedWatch Tool shows.
A likelihood of prolonged uncertainty on the US fiscal and monetary policy front is expected to rattle investors’ confidence in the US assets, including the US Dollar (USD), fuelling an increased rush to safety in the traditional safe haven Gold.
Meanwhile, the Greenback is also reeling from the pain of a mixed reading for the Bureau of Labor Statistics’ (BLS) Job Openings and Labor Turnover Survey (JOLTS). The report showed US openings increased marginally by 19,000 in August, while hiring declined, consistent with a softening labor market.
All eyes now remain on the US government shutdown scenario and its likely impact on the broader market sentiment. If a shutdown happens, the US private sector payrolls by the Automatic Data Processing (ADP) will hog the limelight on Wednesday, in the absence of the US Nonfarm Payrolls (NFP) release this Friday.
The US ISM Manufacturing PMI and speeches from Fed policymakers could also drive the sentiment around Gold price.
As observed on the four-hour chart, the 14-day Relative Strength Index (RSI) remains within the bullish territory, currently near 68.
Therefore, the leading indicator suggests that Gold still has more room to the upside, and that any dip could be quickly bought in.
However, if buyers refuse to give up, buyers yearn for acceptance above the $3,870 level on a daily closing basis to resume the bullish momentum.
The next topside hurdle is located at the $3,900 barrier as the hunt for the $4,000 mark remains on the radar.
Conversely, any retracement pullback could test the initial support at $3,806, the 21-Simple Moving Average (SMA), below which the 50-SMA at $3,763 would be tested.
Deeper correction could target the September 24 low at $3,718, followed by the 100-SMA at $3,708.
Monetary policy in the US is shaped by the Federal Reserve (Fed). The Fed has two mandates: to achieve price stability and foster full employment. Its primary tool to achieve these goals is by adjusting interest rates.
When prices are rising too quickly and inflation is above the Fed’s 2% target, it raises interest rates, increasing borrowing costs throughout the economy. This results in a stronger US Dollar (USD) as it makes the US a more attractive place for international investors to park their money.
When inflation falls below 2% or the Unemployment Rate is too high, the Fed may lower interest rates to encourage borrowing, which weighs on the Greenback.
The Federal Reserve (Fed) holds eight policy meetings a year, where the Federal Open Market Committee (FOMC) assesses economic conditions and makes monetary policy decisions.
The FOMC is attended by twelve Fed officials – the seven members of the Board of Governors, the president of the Federal Reserve Bank of New York, and four of the remaining eleven regional Reserve Bank presidents, who serve one-year terms on a rotating basis.
In extreme situations, the Federal Reserve may resort to a policy named Quantitative Easing (QE). QE is the process by which the Fed substantially increases the flow of credit in a stuck financial system.
It is a non-standard policy measure used during crises or when inflation is extremely low. It was the Fed’s weapon of choice during the Great Financial Crisis in 2008. It involves the Fed printing more Dollars and using them to buy high grade bonds from financial institutions. QE usually weakens the US Dollar.
Quantitative tightening (QT) is the reverse process of QE, whereby the Federal Reserve stops buying bonds from financial institutions and does not reinvest the principal from the bonds it holds maturing, to purchase new bonds. It is usually positive for the value of the US Dollar.
While strength has been confirmed, natural gas now confronts a decision zone. The ABCD measured move symmetry between the rising AB and CD legs aligns with the 100% projected target at $3.34. This creates the possibility of a pivot and pullback, especially since a lower gap remains unfilled and the market has yet to revisit the 20-Day and 50-Day moving averages for support. These moving averages, converging near $3.00, represent important levels to watch if selling pressure emerges.
A strong daily close above today’s high could open the door to higher levels. The next upside zone lies near the 200-Day moving average at $3.49, reinforced by the 127.2% ABCD projection at $3.50. The overlap of multiple indicators at this level strengthens its potential importance as resistance. Before that target is reached, however, natural gas must break decisively above a descending trendline, a move that would further confirm strengthening demand.
The interaction with the long-term uptrend line has turned into a bullish signal. A sustained close above the 200-Day average would mark a significant shift in trend dynamics and encourage further bullish momentum. Until then, the $3.25 level serves as immediate support, while the $3.34–$3.35 area defines the near-term decision point for traders.
For a look at all of today’s economic events, check out our economic calendar.