The main tag of GoldPrice Articles.
You can use the search box below to find what you need.
[wd_asp id=1]
The main tag of GoldPrice Articles.
You can use the search box below to find what you need.
[wd_asp id=1]
The Gold Price (XAU/USD) drifts higher to a fresh record high near $3,375 during the early Asian session on Monday after facing some profit-taking due to the long weekend. Uncertainty about US President Donald Trump’s tariff policies and persistent geopolitical tensions continue to underpin the precious metal.
Investors have rushed to safe-haven assets like Gold due to rising uncertainty about tariffs and their impact on the economy, resulting in a more than 25% increase in the yellow metal prices since January. “The case for adding gold allocations has become more compelling than ever in this environment of escalating tariff uncertainty, weaker growth, higher inflation, geopolitical risks & diversification away from US assets & the US$,” said UBS analysts.
Additionally, central bankers have been adding gold to their portfolios. China, the world’s largest gold consumer, China added gold to its holdings for the fifth consecutive month, boosting its demand for the precious metal as a safe haven asset in the face of mounting global trade and geopolitical tensions.
On the other hand, the Federal Reserve (Fed) Chair Jerome Powell turned hawkish last week, reducing the likelihood of a Fed rate reduction in June. Meanwhile, San Francisco Fed President Mary Daly said on Friday that the US economy is in a good place, though some sectors are slowing down. This, in turn, could lift the Greenback and weigh on the USD-denominated commodity price.
Gold has played a key role in human’s history as it has been widely used as a store of value and medium of exchange. Currently, apart from its shine and usage for jewelry, the precious metal is widely seen as a safe-haven asset, meaning that it is considered a good investment during turbulent times. Gold is also widely seen as a hedge against inflation and against depreciating currencies as it doesn’t rely on any specific issuer or government.
Central banks are the biggest Gold holders. In their aim to support their currencies in turbulent times, central banks tend to diversify their reserves and buy Gold to improve the perceived strength of the economy and the currency. High Gold reserves can be a source of trust for a country’s solvency. Central banks added 1,136 tonnes of Gold worth around $70 billion to their reserves in 2022, according to data from the World Gold Council. This is the highest yearly purchase since records began. Central banks from emerging economies such as China, India and Turkey are quickly increasing their Gold reserves.
Gold has an inverse correlation with the US Dollar and US Treasuries, which are both major reserve and safe-haven assets. When the Dollar depreciates, Gold tends to rise, enabling investors and central banks to diversify their assets in turbulent times. Gold is also inversely correlated with risk assets. A rally in the stock market tends to weaken Gold price, while sell-offs in riskier markets tend to favor the precious metal.
The price can move due to a wide range of factors. Geopolitical instability or fears of a deep recession can quickly make Gold price escalate due to its safe-haven status. As a yield-less asset, Gold tends to rise with lower interest rates, while higher cost of money usually weighs down on the yellow metal. Still, most moves depend on how the US Dollar (USD) behaves as the asset is priced in dollars (XAU/USD). A strong Dollar tends to keep the price of Gold controlled, whereas a weaker Dollar is likely to push Gold prices up.
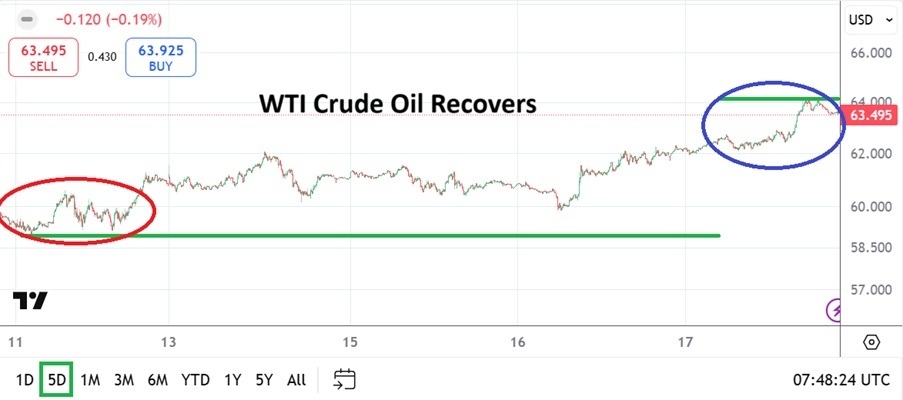
The current price in WTI Crude Oil is certainly within the lower part of its long-term track record. Any prices below the 66.000 USD level can be thought to be rather low in the commodity. Before the onslaught of selling which erupted in the first week of April due to concerns about Trump tariff policies, WTI Crude Oil was flirting with nearly 72.000 USD per barrel.

Day traders need to remain cautious in WTI Crude Oil and all commodities in the coming days, there is still a lot of dynamic influence large players could cause. Looking for higher prices in WTI Crude Oil which are not overly ambitious may feel correct, but speculators should keep their targets realistic and watch the broad markets like equity indices as a barometer. If prices climb above 64.000 USD early this week and sustain higher values this would be a sign large players are still focusing on further price recovery.
The current price of WTI Crude Oil is certainly within the lowest aspects of its long-term range. A look at six month and one year charts show that anything below the $66.000 level looks relatively cheap.
WTI Crude Oil has been hit with volatility because it is one of the key commodities in the global economy. If tariff implications continue to be debated without clarity for solutions, large traders may remain nervous. However, the ability of the commodity to ebb higher on Wednesday and Thursday of last week before the long holiday weekend may indicate traders were a bit less nervous.
Day traders should watch the first handful of hours in WTI Crude Oil as it begins to trade this week to gauge behavioral sentiment. The broad markets and the energy sector remain in fragile price ranges. Although some recovery of value was demonstrated last week, conditions are not abundantly optimistic. A wagering environment may continue to hold the power in the coming days as a tendency for optimistic outlooks fights with potential calls of retaliatory actions by some nations being confronted by U.S tariffs.
Ready to trade our weekly forecast? We’ve shortlisted the best Forex Oil trading brokers in the industry for you.
The high for the week was a successful test of resistance at the 200% projection of a rising ABCD pattern that began from the August 2018 lows. It was also in the region of $3,335, which is the 261.8% extension for the bearish correction that began from the 2011 peak. Both price levels are derived from long-term patterns. So far, the targets seem to be recognized by the market. But given the sustained signs of strength, the quickening uptrend may continue.
Gold has benefited from rising global uncertainty and it may continue to do so. Therefore, a decisive advance above this week’s high of $3,358, has gold next targeting the $3,383 price zone as that is the 127.2% projection for a rising ABCD pattern (purple) that began from the February swing low (A). Then, a little higher is the projection for a recent small bull pennant pattern that triggered on Wednesday at $3,454. The 161.8% projection for the rising ABCD pattern is then at $3,498.
Although the rising angle of ascent in the price of gold is a sign of strong and growing demand, it also indicates that the trend may be extended with the risk of a correction increasing. The top of two rising trend channels were broken recently. Subsequently, a pullback to test support around the prior trend high of $3,246 and near potential support of a top channel line, would be normal and retain the near-term bullish outlook for gold. However, a decline below Tuesday’s low of $3,208 could lead to a deeper pullback.
For a look at all of today’s economic events, check out our economic calendar.
Following a lower swing high of $4.25 on March 3, the bearish correction from the recent peak of $4.90 accelerated to the downside. This can be seen as the price of natural gas was rejected from the top of the channel. It then fell back below the 50-Day MA and then the midline (green dashes) of a falling trend channel as highlighted in red. The original channel is bound by blue trendlines, and a 25% extension was added to the bottom with a green lower line.
Over the past several days resistance was successfully tested around the lower blue channel line, and it has held up so far. Once prior support becomes resistance, the downtrend may be ready to continue. In summary, these are bearish signs. Natural gas remains in a clear downtrend and bearish momentum has been increasing.
Despite the overall bearish indications, natural gas is in a position that could lead to a bullish reversal. A potential support zone around the 88.6% Fibonacci retracement of $3.21 has been tested as support for several days and again on Thursday with a new retracement low of $3.19. It continues to indicate support even though there is a recent series of lower daily lows and is supported by the lower end of the descending channel. Now, on Thursday an outside day was produced as a new trend low was reached earlier in the session followed by a rise above Wednesday’s high.
A bullish breakout and possible one-day bullish reversal will trigger on a rally above $3.33. The first stop on the way up looks to be a recent interim lower swing high from Monday. Further up is the 20-Day MA, now at $3.73, followed by another lower swing high at $3.83. Subsequently, the 50-Day MA may indicate signs of resistance. It is now at $3.90.
For a look at all of today’s economic events, check out our economic calendar.
Despite downward pressure, natural gas will complete an outside day as there was an advance above Wednesday’s high of $3.32 to $3.33 today. Recent highs indicate that the market seems to be recognizing the declining channel lines. Although natural gas continues to show weakness as it may end the day at its lower daily closing price for the corrective decline, which previously was $3.27 from Wednesday, it may close today below the lower boundary line of the original channel (blue lines).
Nevertheless, a decisive rally above Thursday’s high of $3.33 triggers a one-day bullish reversal and reclaims the lower end of the original channel. A daily close above today’s high would then be needed to confirm strength. There are two initial potential upside targets, while the middle green dashed line of the channel can help as a guide. The first upside target is the most recent interim lower swing high at $3.61, followed by the 20-Day MA, currently at $3.73. Keep in mind that since the 20-Day line is falling it may reach the area around the $3.61 level or lower before it is tested as resistance.
On the downside, if natural gas continues to fall below $3.19 and keeps going, there are several reasons that support may be seen within a range of $3.08 to $2.99. The potentially significant 200-Day MA is within that range at $3.06 currently.
For a look at all of today’s economic events, check out our economic calendar.
Gain access to all that Trend has to offer, as well as to premium, licensed content via subscription or direct purchase through a credit card.
The World Trade Organization now forecasts a 0.2% contraction in global goods trade this year, adding to the risk-off tone. Meanwhile, the weakening DXY has enhanced gold’s relative appeal for foreign investors.
Federal Reserve Chair Jerome Powell signaled caution on rate cuts, pointing to persistent inflation and uneven economic momentum. Markets still price in 86 basis points of cuts by year-end 2025, with July flagged as the earliest likely move.
U.S. jobless claims declined to 215,000, suggesting labor market resilience, though continuing claims ticked up to 1.885 million. March housing data was mixed—permits rose 1.6%, while starts slipped.
Despite the recent pullback, gold’s broader trend remains constructive. As long as rate uncertainty lingers and trade risks persist, investor demand for safe-haven assets like gold and silver is likely to remain firm.
Gold holds above $3,322 support as trade risks and a weak dollar sustain safe-haven demand. Silver eyes $33.11 resistance, but momentum hinges on holding key support near $32.12.
Thursday’s high completed a 200% extended target for a large rising ABCD pattern that begins from the August 2018 swing low. That target is joined by the 261.8% extended retracement of the multi-year bearish correction that began from the August 2011 peak at $3,355. Therefore, a decline below $3,284 is a sign of weakness and could lead to a deeper pullback to test prior resistance as support.
Key initial price levels start with the prior high of $3,246 along with Wednesday’s low of $3,239. Then, there is the inside day from Tuesday with a low of $3,208. A bull breakout of that day led to the sharp bullish upside continuation run on Wednesday. Therefore, it may hold significance on the way down as well, if it is approached.
This week’s upside continuation in the price of gold followed a long bullish engulfing pattern that was completed last week. It showed aggressive buying and a continuation of the long-term bull trend. Moreover, the strong advance triggered breakouts of two rising parallel trend channels, further indicating that demand was increasing. The top line of the blue channel should also be watched for signs of support during a deeper pullback, if it occurs.
An initial target from a rising ABCD pattern has not yet been reached and it therefore identifies the next higher potential target at $3,3,83. Higher up is the 161.8% extended target for a larger rising ABCD pattern (not shown). Then, a little higher is $3,454. That price area is the estimated target for a small bull flag defined by the two narrow range days of consolidation from Monday and Tuesday. An intraday chart (not shown) provides a clearer view of the bull flag pattern.
For a look at all of today’s economic events, check out our economic calendar.
Platinum price kept its positive stability above the moving average 55, to notice it attempted to enter the minor bullish channel’s levels again by hitting $972.60 level, which forced it to provide some of the sideways trading range, due to Stochastic reach to the overbought level.
Note that the continuation of the formation of extra support at $950.00 level will represent an important factor to confirm the continuation of the positivity, which makes us wait to gather the required extra positive momentum to motivate the bullish rally, until reaching the main targets at $981.00 and $994.00.
The expected trading range for today is between 985.00 and 1040.00
Trend forecast: Bullish
Do you need help in trading decisions? Do you want to learn how to start trading?
Join Economies.com VIP Club and benefit from over 15 years of market analysis expertise and get:
Special Offer: Subscribe to the Economies.com VIP channel and get also a free subscription to a trusted trading signals channel provided by Best Trading Signal.
Given the sharp five-day decline to a low of $55.23 that ended last week, there is a strong case to be made for a sharp countertrend rally as well. Crude oil fell by $17.25 or 23.8% following the April 2 high of $72.49, measured to last week’s low and the low of the bearish correction. It has been consolidating off that bottom until the upside breakout that triggered today. Certainly, there can still be some backing and filling within this week’s price range of $60.40 to $64.72, before an advance might continue.
But this week will end with a higher weekly high and higher weekly low, a sign that buyers are stepping in more aggressively than they have recently. Furthermore, today’s bullish advance follows a bullish outside day from Wednesday, another bullish sign. Traders and investors will likely see short-term weakness as an opportunity given the new bullish signals in crude oil.
The first key upside target zone is from the confluence of several indicators from $65.40 to $65.89. Prior lows and now potential support are at $65.40 to $65.65, while the 20-Day MA, now at $65.72, and the 61.8% Fibonacci retracement at $65.89 complete the price range. A little higher is the initial 100% target from a rising ABCD pattern (not shown) that completes at $67.08. Subsequently, there is the 78.6% Fibonacci retracement at $68.79, which is joined by the 127.2% extended target for the ABCD pattern at $69.31.
For a look at all of today’s economic events, check out our economic calendar.