The main tag of GoldPrice Articles.
You can use the search box below to find what you need.
[wd_asp id=1]
The main tag of GoldPrice Articles.
You can use the search box below to find what you need.
[wd_asp id=1]
(Reuters) – JP Morgan on Monday lowered its oil price forecasts for 2025 and next year, citing higher production from OPEC+ and weaker demand.
The bank cut its 2025 Brent price forecast to $66 per barrel from $73 and its 2026 target to $58 from $61. It lowered the 2025 WTI price outlook to $62 per barrel from $69 and the 2026 view to $53 from $57.
Brent crude futures were trading around $65 on Monday, and U.S. West Texas Intermediate crude futures were around $61. [O/R]
JP Morgan now expects global oil demand to increase by 0.8 million barrels per day (mbd), with growth averaging only 0.3 mbd in the third quarter.
“Higher production volumes from the OPEC+ alliance indicate a shift in the reaction function, which, when combined with weaker demand, will push balances into a large surplus and drive Brent down below $60 towards year-end,” the bank said in a note.
The oil market remains under pressure from an “80% probability of a mild recession coupled with an additional 1 mbd of increased” production by the Organization of Petroleum Exporting Countries (OPEC), JP Morgan analysts said.
While OPEC+ is poised to gain market share in 2025, stabilizing the market at $60 Brent in 2026 would require the alliance not only to reverse current production increases, but to implement further cuts, JP Morgan said.
Earlier this month, Goldman Sachs reduced its Brent and WTI oil forecasts for 2025 and 2026 on the expectation of higher OPEC+ supply and the risk of an escalating trade conflict will trigger a global recession, denting demand.
(Reporting by Brijesh Patel and Ishaan Arora in Bengaluru; Editing by Chris Reese and Leslie Adler)
Spot Gold trades above the $3,200 mark in the American session down on a daily basis amid a better market mood. Investors’ attention lies elsewhere, with g Asian and European stocks posting gains amid easing tariffs-related concerns. As it happened lately, demand for the US Dollar (USD) is limited amid concerns United States (US) President Donald Trump tariffs will put the world’s largest economy one step closer to recession.
Headlines, however, are still unclear. The White House announced over the weekend that some technology imports from China will be exempted from the reciprocal tariffs, yet still subject to the initial 20% levy. However, Trump stated on Monday that Chinese-made smartphones and other electronics will not be exempt from tariffs – adding they are moving into a different levy “bucket”.
The latest on Trump weighed on Wall Street. After a strong start to the day, US indexes are in retreat mode, helping XAU/USD to remain afloat.
The shortened week due to Easter holidays will anyway include two central banks’ monetary policy announcements: The Bank of Canada (BoC) will unveil its decision on Wednesday, while the European Central Bank (ECB) will do the same on Thursday. In the meantime, the United Kingdom (UK) and Canada will release inflation updates. As for the US, the macroeconomic calendar seems pretty quiet, although multiple Federal Reserve (Fed) officials will be on the wires throughout the upcoming sessions.
From a technical point of view, the daily chart for the XAU/USD pair shows it holds inside Friday’s range, having surpassed its record high for a few cents. Technical indicators, in the meantime, eased from extreme levels, with limited downward strength. Indicators are reflecting the ongoing near-term slide, rather than suggesting the bullish run is over. At the same time, the pair develops far above all its moving averages, which maintain solid bullish slopes, in line with the dominant bullish trend.
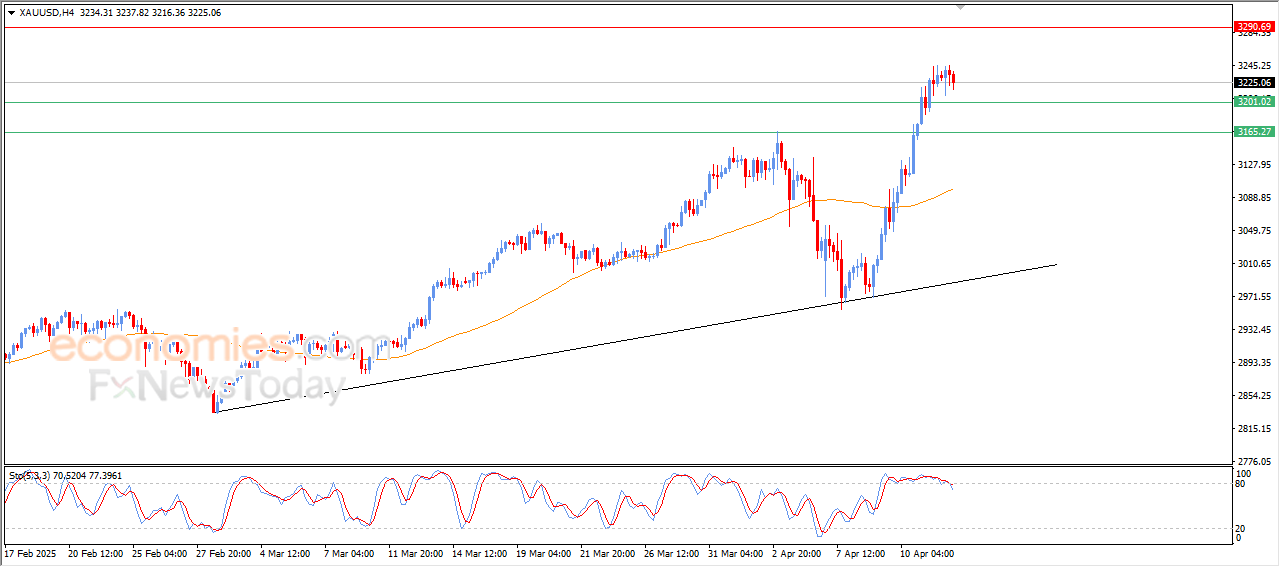
In the near term, and according to the 4-hour chart, XAU/USD downward correction seems to be complete. The Momentum indicator has ticked higher above its 100 line after correcting extreme readings, while the Relative Strength index (RSI) indicator seems to stabilize at around 63. At the same time, a bullish 20 SMA offers support at around $3,170.90, while heading firmly higher above also bullish 100 and 200 SMAs.
Support levels: 3,193.30 3,181.15 3,170.90
Resistance levels: 3,215.40 3,231.60 3,245.75
The natural gas market has shown itself to be somewhat resilient near this crucial $3.50 level. And I think that is going to be the main story here, resiliency. The $3.50 level, of course, is a large round, psychologically significant figure that people will be paying close attention to. But I would also bring to your attention that it is where a major trend line hangs out. And just below there, we have the 200 day EMA. The 200 day EMA, of course, is an indicator that a lot of longer term traders will be paying close attention to. And therefore, I think you’ve got a situation where we could see a lot of noise here. Keep in mind that natural gas is going to start to see a lack of demand soon, mainly due to the seasonality, as it is a major component in heating.
It also produces a lot of electricity in the United States as well. So, if the economy slows down, it’s possible that natural gas demand will fall off of a cliff. I’m not necessarily expecting that right away, but I do recognize that we have a situation where natural gas is at a major inflection point that we need to pay close attention to. If we were to break down below the $3.30 level and take out the 200-day EMA, then I think you’ve got a real shot at this market falling even further, perhaps down to the $3 level.
Crude oil prices rose in its recent intraday trading, challenging the key resistance level at $61.50, supported by a short-term bullish correctional wave and the emergence of positive signals from the Relative Strength Index (RSI). However, the price is also facing a strong obstacle, which is the resistance of the EMA50.
To get our more detailed analysis and 100% accurate signals provided by Best Trading Signal, subscribe to Economies.com VIP Club through the link below!
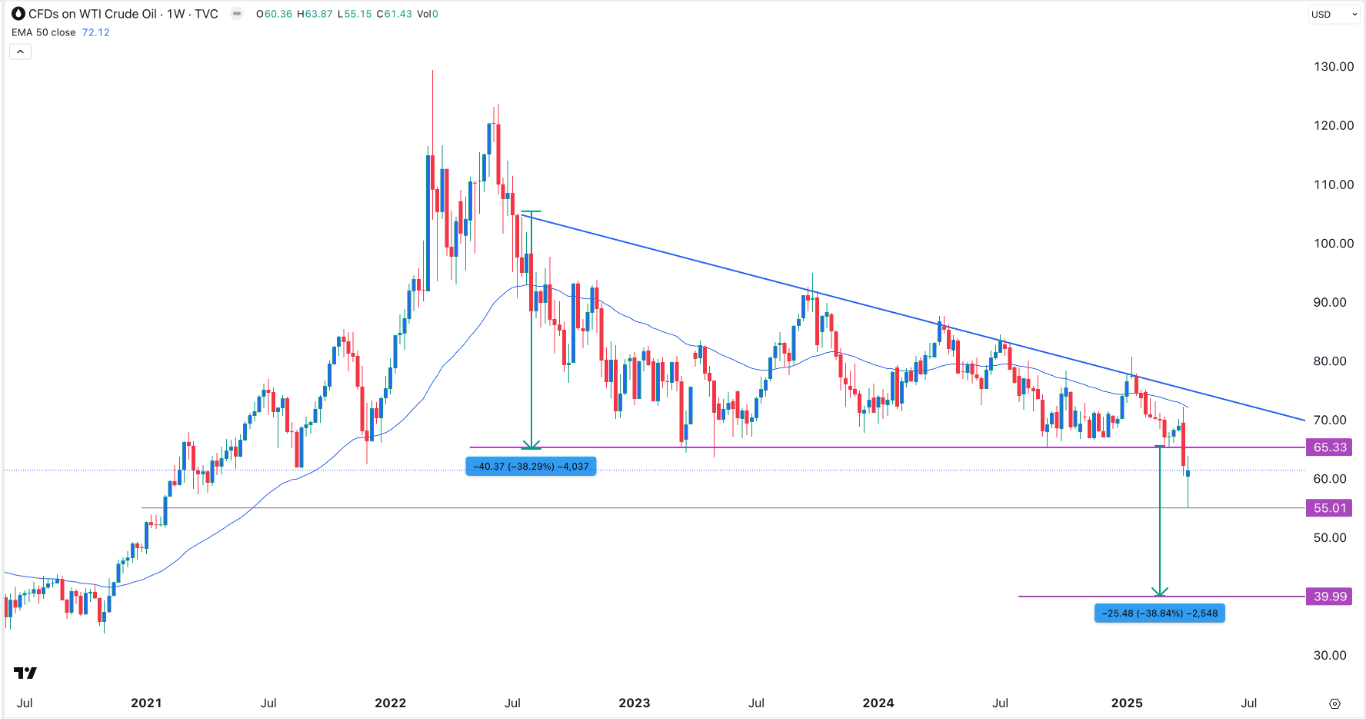
The WTI crude oil price crashed to $55 last week, its lowest level since February 2021 as demand concerns coincided with higher oil OPEC output. It then bounced back to end the week at $61.43.
The WTI crude oil price outlook is bearish as the industry battles numerous demand and supply concerns.
The main demand aspect is that there are concerns that the US and other countries may move into a recession this year. In a note last week, the Energy Information Administration (EIA) warned that demand could drop as uncertainties remains. It also slashed demand estimate for this year and 2025.
At the same time, oil producers are preparing production increases this year. OPEC member countries voted to increase production gradually in the coming months.
Donald Trump is also aiming to boost US oil production as he seeks to lower inflation and ease regulations. He campaigned on a “drill, baby, drill” mantra, which involves boosting production, which currently stands at 13.5 million barrels a day. Any trade deal with other countries will likely involve them buying more oil to reduce the US deficit.
The United States is talking to Russia on ending the war in Ukraine. Any potential deal would end the sanctions that the US and other countries have placed on Russia, a move that would bring more oil online.
Additionally, the US is negotiating with Iran on ending its nuclear power program. A deal would also involve the Trump administration removing sanctions on Iranian oil that have reduced its exports in the past few months.
The WTI crude oil price will react to trade news this week. Signs of de-escalation between China and the US will likely be a bullish sign for oil prices.

The weekly chart shows that the WTI crude oil price has been in a downward trend in the past few months. It has formed a descending triangle pattern, a popular bearish sign in the technical analysis.
The price has moved below all moving averages and the lower side of the descending triangle pattern. The widest point of this triangle is 38%, meaning that the longer-term target is about $40. This target was achieved by measuring the same distance from the lower side of this triangle.
In the short term, however, the WTI crude oil price may retest the lower side of this triangle and then resume the downtrend.
Ready to trade our weekly forecast? Here’s a list of some of the best Oil trading platforms to check out.
Natural gas price continued resisting the negative pressures, by its stability above $3.350 level, to decrease the chances for suffering extra losses, and increase the chances for activating the bullish track, due to stochastic exit from the oversold levels as appear in the above image.
The price rally is expected toward the extra resistance at $3.640, confirming that surpassing it is important to confirm regaining the bullish bias, by its rally directly to the positive stations near $3.950 reaching $4.180 in the medium period trading.
The expected trading range for today is between $3.450 and $3.950
Trend forecast: Bullish
Copper price resumed its bullish rally, to notice its approach from $4.5600 this morning, which represents 50%Fibonacci correction level for the last decline, which began from the top at $5.3200.
Note that the continuation of copper’s price stability below $4.5600 level as an important barrier might push it to delay the bullish attack, and providing new negative trading, to target $4.4300 and $4.3200, while breaching the barrier and holding above it will reinforce the chances for recording extra gains that might extend to $4.6800 and $4.7500.
The expected trading range for today is between $4.4300 and $4.5600
Trend forecast: Bearish
No news for Platinum price by its repeated fluctuations below the obstacle at $950.00, which forces it to provide weak sideways trading, delaying the waited bullish rally.
Note that stochastic attempt to reach the overbought level supports the chances for gaining positive momentum, to keep waiting for breaching the current obstacle to ease achieving the extra gains, which are located near $963.00 and$976.00, while the failure of the breach will confirm the domination of the sideways scenario, with a chance for retesting the initial support at $920.00 before any attempt to reach the previously suggested targets.
The expected trading range for today is between $935.00 and $963.00
Trend forecast: Bullish
Gold price is sustaining its retreat from all-time highs of $3,245 reached on Friday, reverting toward $3,200 early Monday.
Having posted an outstanding 6.5% weekly gain, Gold price kicks off a new week on the back foot, pausing its three-day record-setting rally. The latest downtick in Gold price could be attributed to the positive shift in risk sentiment following a tumultuous week.
US President Donald Trump’s tariff concession on the Chinese electronics supply chain, hopes of more stimulus coming from China and Beijing’s stance of ignoring further US responses have offered markets some relief, diminishing the safe-haven appeal of the Gold price.
Trump clarified late Sunday that there will be no tariff exemption on semiconductors and the electronics supply chain but these products will be subject to the existing 20% tariffs on fentanyl and not the 145% levies.
This comes after China said on Friday that it will ignore further US responses after raising tariffs on US good to 125%, in retaliation to Trump’s 145% tariffs.
Meanwhile, Chinese policymakers vow to step up stimulus to cushion the world’s second-largest economy from the impact of the escalating trade war with the United States (US).
Gold price also bears the brunt of some progress on the US-Iran geopolitical talks. According to Reuters, US envoy Steve Witkoff and Iranian Foreign Minister Abbas Araghchi spoke for around 45 minutes on Saturday, with the Trump administration reportedly satisfied with the first round of talks. The second round of negotiations are expected to continue later this week.
That said, any dip in Gold price is likely to be bought in as traders remain wary about tariff talks and ahead of Wednesday’s Chinese first-quarter growth figures. Markets also remain unnerved as the US earnings season begins later this week.
In the meantime, Gold traders will look forward to China’s March trade data. However, the data is unlikely to show the full impact of the US-Sino trade war. Later in the day, several Federal Reserve (Fed) policymakers are scheduled to speak. Their take on Trump’s tariffs and hints on the Fed’s next interest rate move could provide some trading incentives in Gold price.
The daily chart shows that the 14-day Relative Strength Index (RSI) has eased from the overbought region to currently trade near 69, suggesting that the corrective pullback will likely be shallow.
The first area of contention for sellers is at the $3,200 threshold, below which Friday’s low of $3,176 will be challenged.
Additional declines could test the $3,100 round level, followed by the 21-day Simple Moving Average (SMA) resistance-turned-support at $3,074.
Conversely, the record high of $3,245 is the immediate topside barrier for Gold buyers. Scaling that level will open the door toward the $3,300 mark.
Gold price is back in the red early Monday, snapping a three-day record rally to lifetime highs of $3,245 set on Friday.
Safe-haven flows appear to have eased in Asian trading on Monday as traders rejoice in Wall Street’s turnaround on Friday alongside some positive updates on the US-China tariff war, alleviating the bullish pressure on the Gold price for now.
On Friday, China responded to the US tariff hike to 145% by raising tariffs on American goods to 125%. However, Beijing said it would ignore further US responses.
Over the weekend, US President Donald Trump considered imposing 20% tariffs on Chinese semiconductors and the electronics supply chain against the previously announced 145% levies.
These tariff updates seem to be perceived positively by markets, as they provide some consolation and allow a modest recovery in the US Dollar against its major currency rivals from 35-month lows.
The US Dollar uptick and risk appetite keep the corrective downside intact in Gold price as traders await China’s Trade Balance report and speeches from several US Federal Reserve (Fed) policymakers for further trading impetus.
Markets could use the excuse of not-so-steep tariffs on Chinese electronics and chips to take profits off the table following the recent Gold price upsurge.
Tariffs are customs duties levied on certain merchandise imports or a category of products. Tariffs are designed to help local producers and manufacturers be more competitive in the market by providing a price advantage over similar goods that can be imported. Tariffs are widely used as tools of protectionism, along with trade barriers and import quotas.
Although tariffs and taxes both generate government revenue to fund public goods and services, they have several distinctions. Tariffs are prepaid at the port of entry, while taxes are paid at the time of purchase. Taxes are imposed on individual taxpayers and businesses, while tariffs are paid by importers.
There are two schools of thought among economists regarding the usage of tariffs. While some argue that tariffs are necessary to protect domestic industries and address trade imbalances, others see them as a harmful tool that could potentially drive prices higher over the long term and lead to a damaging trade war by encouraging tit-for-tat tariffs.
During the run-up to the presidential election in November 2024, Donald Trump made it clear that he intends to use tariffs to support the US economy and American producers. In 2024, Mexico, China and Canada accounted for 42% of total US imports. In this period, Mexico stood out as the top exporter with $466.6 billion, according to the US Census Bureau. Hence, Trump wants to focus on these three nations when imposing tariffs. He also plans to use the revenue generated through tariffs to lower personal income taxes.